Calderwood (Delwood) neighborhood in San Jose, California (CA), 95118 detailed profile
Settings
X


Business Search - 14 Million verified businesses
Area: 0.114 square miles
Population: 764
Population density:
| Calderwood (Delwood): | 6,722 people per square mile |
| San Jose: | 5,554 people per square mile |

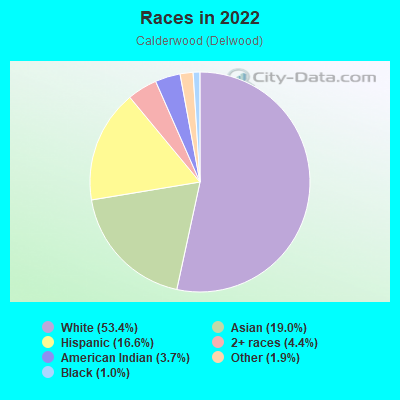
- 42153.4%White
- 15019.0%Asian
- 13116.6%Hispanic or Latino
- 354.4%Two or more races
- 293.7%American Indian
- 151.9%Some other race
- 81.0%Black
Median household income in 2022:
| Calderwood (Delwood): | $105,551 |
| San Jose: | $133,835 |
Distribution of median household income
![Distribution of median household income]()
- 17Less than $10,000
- 53$10,000 to $19,999
- 20$20,000 to $29,999
- 8$30,000 to $39,999
- 24$40,000 to $49,999
- 8$50,000 to $59,999
- 16$60,000 to $74,999
- 50$75,000 to $99,999
- 54$100,000 to $124,999
- 24$125,000 to $149,999
- 13$150,000 to $199,999
- 87$200,000 or more

Distribution of owner-occupied house/condo value
![Distribution of owner-occupied house/condo value]()
- 56$750,000 to $999,999
- 66$1,000,000 or more

Distribution of rent paid by renters
![Distribution of rent paid by renters]()
- 17$200 to $299
- 22$300 to $399
- 6$400 to $499
- 7$700 to $799
- 15$800 to $899
- 17$1,000 to $1,249
- 37$1,250 to $1,499
- 13$1,500 to $1,999
- 202$2,000 or more

Median rent in 2022:
| Calderwood (Delwood): | $2,211 |
| San Jose: | $2,001 |
| Males: | 372 |
| Females: | 392 |
Males:
| This neighborhood: | 41.9 years |
| Whole city: | 37.6 years |
| This neighborhood: | 39.1 years |
| Whole city: | 39.1 years |
Average household size:
| Calderwood (Delwood): | 2.6 people |
| San Jose: | 2.9 people |
Percentage of family households:
| Calderwood (Delwood): | 22.8% |
| San Jose: | 49.9% |
| Here: | 24.9% |
| San Jose: | 53.0% |
Percentage of married-couple families with children (among all households):
| Calderwood (Delwood): | 33.4% |
| San Jose: | 25.8% |
Percentage of single-mother households (among all households):
| Calderwood (Delwood): | 10.4% |
| San Jose: | 5.2% |
Percentage of never married males 15 years old and over:
Percentage of never married females 15 years old and over:
| Calderwood (Delwood): | 23.0% |
| San Jose: | 20.9% |
Percentage of never married females 15 years old and over:
| Calderwood (Delwood): | 16.6% |
| city: | 16.7% |
Percentage of people that speak English not well or not at all:
| Calderwood (Delwood): | 8.3% |
| San Jose: | 11.4% |
Percentage of people born in this state:
Percentage of people born in another U.S. state:
Percentage of native residents but born outside the U.S.:
Percentage of foreign born residents:
| Here: | 53.0% |
| San Jose: | 46.1% |
Percentage of people born in another U.S. state:
| Calderwood (Delwood): | 15.1% |
| San Jose: | 10.4% |
Percentage of native residents but born outside the U.S.:
| Here: | 1.8% |
| city: | 1.7% |
Percentage of foreign born residents:
| Here: | 30.2% |
| San Jose: | 41.8% |

Owner-occupied
Renter-occupied

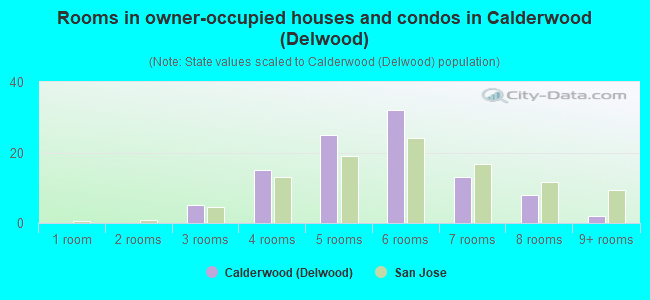
- Rooms in owner-occupied houses and condos in Calderwood <
> - 01 room
- 02 rooms
- 53 rooms
- 154 rooms
- 255 rooms
- 326 rooms
- 137 rooms
- 88 rooms
- 29+ rooms
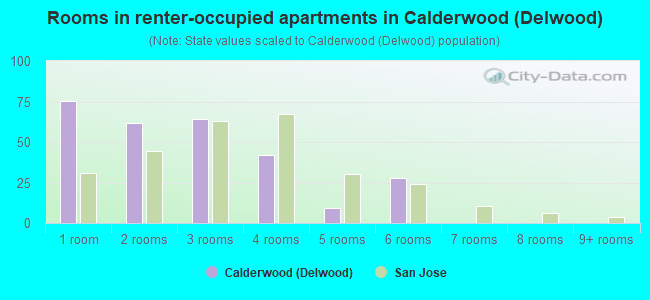
- Rooms in renter-occupied apartments in Calderwood <
> - 751 room
- 622 rooms
- 643 rooms
- 424 rooms
- 95 rooms
- 286 rooms
- 07 rooms
- 08 rooms
- 09+ rooms
Owner-occupied
Renter-occupied
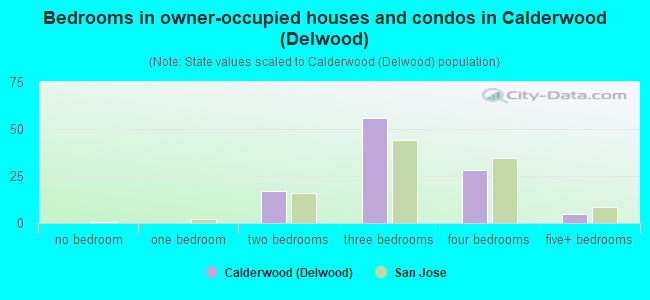
- Bedrooms in owner-occupied houses and condos in Calderwood <
> - 0no bedroom
- 01 bedroom
- 172 bedrooms
- 563 bedrooms
- 284 bedrooms
- 55+ bedrooms
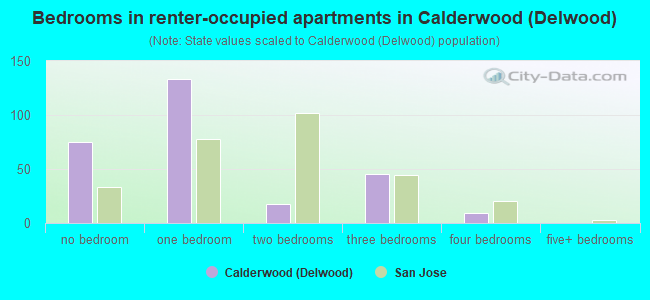
- Bedrooms in renter-occupied apartments in Calderwood <
> - 75no bedroom
- 1331 bedroom
- 182 bedrooms
- 453 bedrooms
- 94 bedrooms
- 05+ bedrooms
Average number of cars or other vehicles available in houses/condos:
Average number of cars or other vehicles available in apartments:
| This neighborhood: | 2.6 |
| San Jose: | 2.3 |
Average number of cars or other vehicles available in apartments:
| Here: | 1.4 |
| city: | 1.6 |
Percentage of units with a mortgage:
| Calderwood (Delwood): | 78.7% |
| San Jose: | 66.9% |
Average estimated value of townhouses or other attached units in 2022 (21.9% of all units):
| This neighborhood: | $937,800 |
| city: | $1,024,857 |
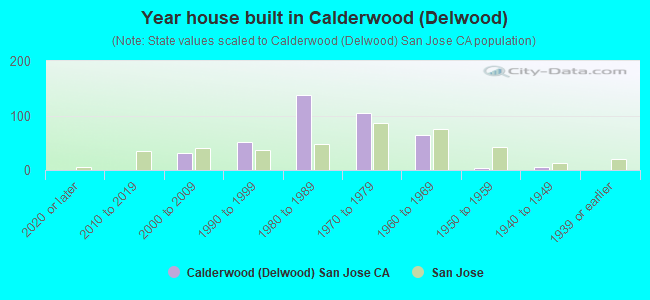
- Year house built in Calderwood <
> - 02020 or later
- 02010 to 2019
- 322000 to 2009
- 511990 to 1999
- 1381980 to 1989
- 1041970 to 1979
- 641960 to 1969
- 31950 to 1959
- 61940 to 1949
- 01939 or earlier
City-data.com crime index for city in 2020 (higher means more crime):
| City: | 268.4 |
| U.S. average: | 219.5 |
Travel time to work (commute)
![Travel time to work (commute)]()
- 36Less than 5 minutes
- 185 to 9 minutes
- 8010 to 14 minutes
- 7715 to 19 minutes
- 6820 to 24 minutes
- 2825 to 29 minutes
- 7430 to 34 minutes
- 935 to 39 minutes
- 1440 to 44 minutes
- 5945 to 59 minutes
- 3160 to 89 minutes
- 1390 or more minutes

Means of transportation to work
![Means of transportation to work]()
- 68.4%305Drove a car alone
- 2.0%9Carpooled
- 1.8%8Bus
- 1.8%8Long-distance train or commuter rail
- 2.0%9Light rail, streetcar or trolley
- 1.6%7Bicycle
- 4.3%19Walked
- 1.1%5Other means
- 17.5%78Worked at home

Time leaving home to go to work
![Time leaving home to go to work]()
- 1712:00 a.m. to 4:59 a.m.
- 45:00 a.m. to 5:29 a.m.
- 405:30 a.m. to 5:59 a.m.
- 86:00 a.m. to 6:29 a.m.
- 146:30 a.m. to 6:59 a.m.
- 947:00 a.m. to 7:29 a.m.
- 697:30 a.m. to 7:59 a.m.
- 818:00 a.m. to 8:29 a.m.
- 528:30 a.m. to 8:59 a.m.
- 459:00 a.m. to 9:59 a.m.
- 2110:00 a.m. to 10:59 a.m.
- 611:00 a.m. to 11:59 a.m.
- 1512:00 p.m. to 3:59 p.m.
- 284:00 p.m. to 11:59 p.m.

Occupations of males:
- Percentage of males in management occupations (except farmers):
Here: 4.5% city: 13.0%
- Percentage of males in business and financial operations occupations:
Here: 8.9% city: 4.6%
- Percentage of males in computer and mathematical occupations:
Here: 21.2% city: 13.6%
- Percentage of males in architecture and engineering occupations:
Here: 9.2% city: 10.2%
- Percentage of males in life, physical, and social science occupations:
Here: 1.4% city: 1.1%
- Percentage of males in education, training, and library occupations:
Here: 1.3% city: 2.8%
- Percentage of males in healthcare practitioners and technical occupations:
Here: 1.6% city: 2.0%
- Percentage of males in service occupations:
Here: 16.0% city: 12.7%
- Percentage of males in sales and office occupations:
Here: 17.3% city: 12.8%
- Percentage of males in construction, extraction, and maintenance occupations:
Here: 1.4% city: 7.8%
- Percentage of males in transportation occupations:
Here: 11.0% city: 3.6%
- Percentage of males in material moving occupations:
Here: 3.9% city: 3.1%
Occupations of females:
- Percentage of females in management occupations (except farmers):
Here: 10.4% city: 11.0%
- Percentage of females in business and financial operations occupations:
Here: 15.9% city: 8.6%
- Percentage of females in computer and mathematical occupations:
Here: 1.2% city: 5.4%
- Percentage of females in community and social services occupations:
Here: 3.4% city: 1.8%
- Percentage of females in education, training, and library occupations:
Here: 7.8% city: 8.1%
- Percentage of females in arts, design, entertainment, sports, and media occupations:
Here: 3.0% city: 2.0%
- Percentage of females in healthcare practitioners and technical occupations:
Here: 20.5% city: 6.8%
- Percentage of females in service occupations:
Here: 24.6% city: 21.7%
- Percentage of females in sales and office occupations:
Here: 16.8% city: 22.0%
Education in this neighborhood (subdivision or community):
- Percentage of people 3 years and older in K-12 schools:
Calderwood (Delwood): 24.8% San Jose: 16.1%
- Percentage of people 3 years and older in undergraduate colleges:
Calderwood (Delwood): 4.1% San Jose: 6.5%
- Percentage of people 3 years and older in grad. or professional schools:
Calderwood (Delwood): 1.7% San Jose: 2.0%
- Percentage of students K-12 enrolled in private schools:
Calderwood (Delwood): 7.5% San Jose: 14.9%
Percentage of population below poverty level:
| Calderwood (Delwood): | 5.6% |
| San Jose: | 9.0% |
Median year owner moved in (as recorded in 2022):
Median year renter moved in (as recorded in 2022):
| Calderwood (Delwood): | 2011 |
| San Jose: | 2008 |
Median year renter moved in (as recorded in 2022):
| Calderwood (Delwood): | 2013 |
| San Jose: | 2020 |
Percentage of married-couple families with both working:
| Calderwood (Delwood): | 89.4% |
| San Jose: | 72.5% |
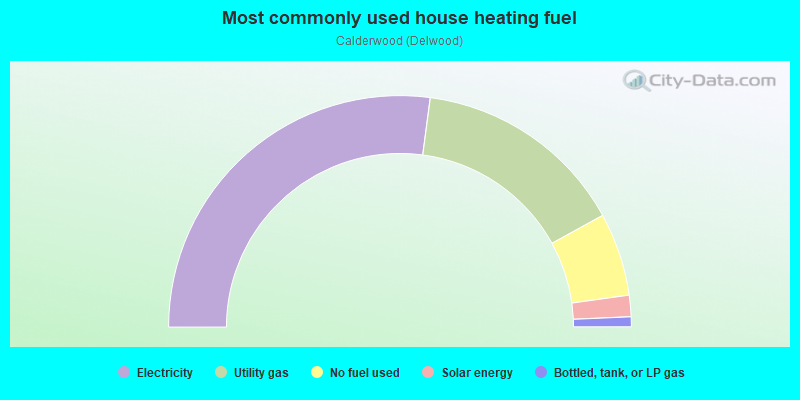
- 54.2%Electricity
- 29.8%Utility gas
- 11.6%No fuel used
- 3.0%Solar energy
- 1.4%Bottled, tank, or LP gas
Roads and streets:
Dentwood Dr
Length: 0.31 miles
Directions: E-W, SW-NE
Address range: 1380 to 1440
Directions: E-W, SW-NE
Address range: 1380 to 1440
Merrywood Dr
Length: 0.30 miles
Directions: E-W, SW-NE
Address range: 1300 to 1499
Directions: E-W, SW-NE
Address range: 1300 to 1499
Melwood Dr
Length: 0.28 miles
Directions: E-W, SW-NE
Address range: 1300 to 1499
Directions: E-W, SW-NE
Address range: 1300 to 1499
Sprucewood Dr
Length: 0.27 miles
Directions: E-W, SW-NE
Address range: 1300 to 1499
Directions: E-W, SW-NE
Address range: 1300 to 1499
Dellwood Way
Length: 0.26 miles
Directions: N-S, SE-NW
Address range: 5200 to 5399
Directions: N-S, SE-NW
Address range: 5200 to 5399
Ridgewood Dr
Length: 0.25 miles
Directions: E-W, SW-NE
Address range: 1350 to 1437
Directions: E-W, SW-NE
Address range: 1350 to 1437
Calderwood Ln
Length: 0.25 miles
Direction: SE-NW
Address range: 5200 to 5399
Direction: SE-NW
Address range: 5200 to 5399
Stanwood Dr
Length: 0.16 miles
Directions: E-W, N-S, SW-NE
Address range: 1300 to 1399
Directions: E-W, N-S, SW-NE
Address range: 1300 to 1399