Bowling Green neighborhood in Norfolk, Virginia (VA), 23504 detailed profile
Settings
X


Business Search - 14 Million verified businesses
Area: 0.050 square miles
Population: 538
Population density:
| Bowling Green: | 10,689 people per square mile |
| Norfolk: | 4,337 people per square mile |

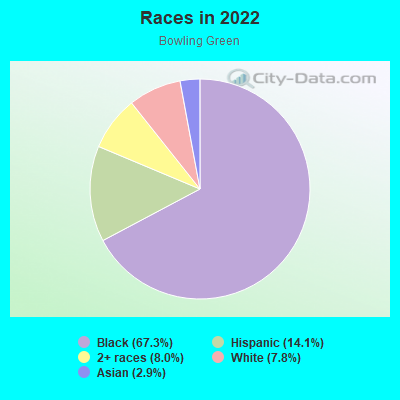
- 37267.3%Black
- 7814.1%Hispanic or Latino
- 448.0%Two or more races
- 437.8%White
- 162.9%Asian
Distribution of median household income
![Distribution of median household income]()
- 23Less than $10,000
- 10$10,000 to $19,999
- 21$20,000 to $29,999
- 16$30,000 to $39,999
- 8$40,000 to $49,999
- 14$50,000 to $59,999
- 47$60,000 to $74,999
- 33$75,000 to $99,999
- 22$100,000 to $124,999
- 6$125,000 to $149,999
- 22$150,000 to $199,999
- 7$200,000 or more

Distribution of owner-occupied house/condo value
![Distribution of owner-occupied house/condo value]()
- 6Less than $50,000
- 6$50,000 to $99,999
- 19$100,000 to $149,999
- 16$150,000 to $199,999
- 49$200,000 to $249,999
- 15$250,000 to $299,999
- 10$300,000 to $399,999
- 9$400,000 to $499,999
- 2$500,000 to $749,999
- 3$750,000 to $999,999

Distribution of rent paid by renters
![Distribution of rent paid by renters]()
- 4Less than $100
- 23$100 to $199
- 17$200 to $299
- 7$300 to $399
- 3$400 to $499
- 8$500 to $599
- 8$600 to $699
- 9$700 to $799
- 2$800 to $899
- 25$900 to $999
- 17$1,250 to $1,499
- 9$1,500 to $1,999

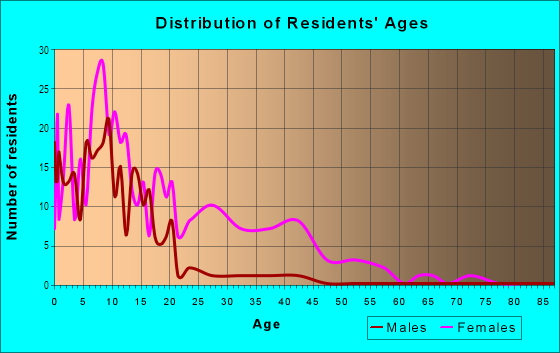
| Males: | 304 |
| Females: | 233 |
Males:
| This neighborhood: | 30.9 years |
| Whole city: | 31.3 years |
| This neighborhood: | 48.9 years |
| Whole city: | 34.4 years |
Average household size:
| Bowling Green: | 2.6 people |
| Norfolk: | 2.3 people |
Percentage of family households:
| Bowling Green: | 43.2% |
| Norfolk: | 41.3% |
| Here: | 26.5% |
| Norfolk: | 31.7% |
Percentage of married-couple families with children (among all households):
| Bowling Green: | 17.7% |
| Norfolk: | 20.2% |
Percentage of single-mother households (among all households):
| Bowling Green: | 13.7% |
| Norfolk: | 16.3% |
Percentage of never married males 15 years old and over:
Percentage of never married females 15 years old and over:
| Bowling Green: | 39.4% |
| Norfolk: | 25.4% |
Percentage of never married females 15 years old and over:
| Bowling Green: | 14.5% |
| city: | 20.5% |
Percentage of people that speak English not well or not at all:
| Bowling Green: | 0.0% |
| Norfolk: | 1.4% |
Percentage of people born in this state:
Percentage of people born in another U.S. state:
Percentage of native residents but born outside the U.S.:
Percentage of foreign born residents:
| Here: | 76.4% |
| Norfolk: | 51.1% |
Percentage of people born in another U.S. state:
| Bowling Green: | 13.6% |
| Norfolk: | 40.8% |
Percentage of native residents but born outside the U.S.:
| Here: | 0.8% |
| city: | 1.6% |
Percentage of foreign born residents:
| Here: | 9.2% |
| Norfolk: | 6.5% |
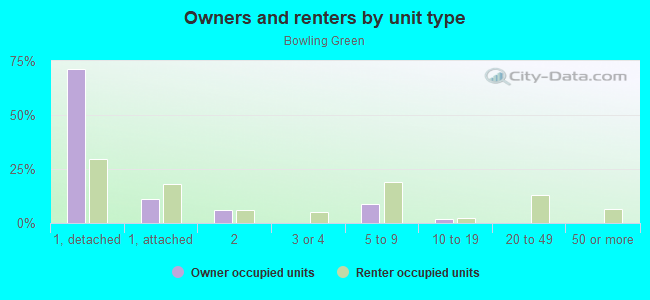
Owner-occupied
Renter-occupied

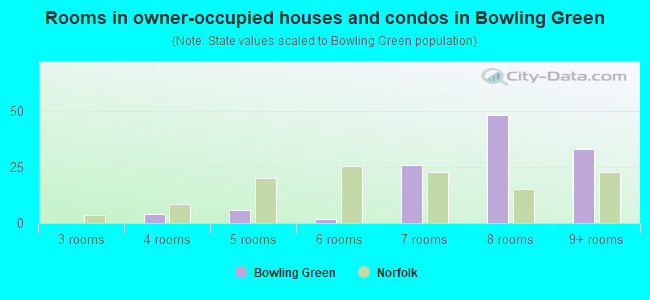
- Rooms in owner-occupied houses and condos in Bowling Green
- 01 room
- 02 rooms
- 03 rooms
- 44 rooms
- 65 rooms
- 26 rooms
- 267 rooms
- 488 rooms
- 339+ rooms
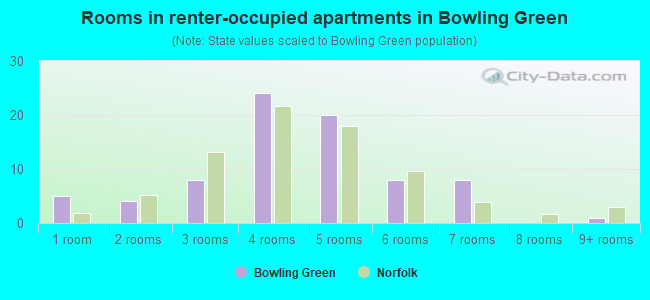
- Rooms in renter-occupied apartments in Bowling Green
- 51 room
- 42 rooms
- 83 rooms
- 244 rooms
- 205 rooms
- 86 rooms
- 87 rooms
- 08 rooms
- 19+ rooms
Owner-occupied
Renter-occupied
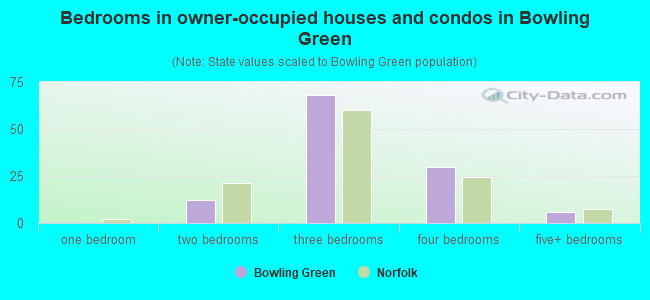
- Bedrooms in owner-occupied houses and condos in Bowling Green
- 0no bedroom
- 01 bedroom
- 122 bedrooms
- 683 bedrooms
- 304 bedrooms
- 65+ bedrooms
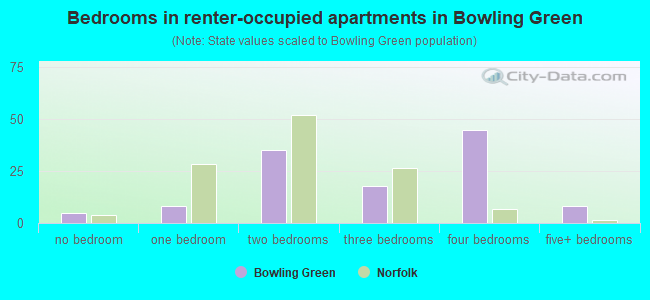
- Bedrooms in renter-occupied apartments in Bowling Green
- 5no bedroom
- 81 bedroom
- 352 bedrooms
- 183 bedrooms
- 454 bedrooms
- 85+ bedrooms
Average number of cars or other vehicles available in houses/condos:
Average number of cars or other vehicles available in apartments:
| This neighborhood: | 1.6 |
| Norfolk: | 2.0 |
Average number of cars or other vehicles available in apartments:
| Here: | 1.4 |
| city: | 1.3 |
Percentage of units with a mortgage:
| Bowling Green: | 83.0% |
| Norfolk: | 70.0% |
Average estimated value of detached houses in 2022 (83.2% of all units):
| Bowling Green: | $213,421 |
| Norfolk: | $337,508 |
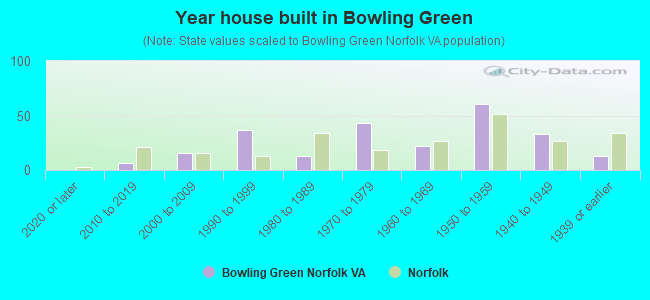
- Year house built in Bowling Green
- 02020 or later
- 62010 to 2019
- 162000 to 2009
- 371990 to 1999
- 131980 to 1989
- 431970 to 1979
- 221960 to 1969
- 611950 to 1959
- 331940 to 1949
- 131939 or earlier
City-data.com crime index for city in 2020 (higher means more crime):
| City: | 327.9 |
| U.S. average: | 219.5 |
Travel time to work (commute)
![Travel time to work (commute)]()
- 5Less than 5 minutes
- 315 to 9 minutes
- 5810 to 14 minutes
- 18715 to 19 minutes
- 10520 to 24 minutes
- 2225 to 29 minutes
- 530 to 34 minutes
- 735 to 39 minutes
- 640 to 44 minutes
- 945 to 59 minutes
- 360 to 89 minutes
- 290 or more minutes

Means of transportation to work
![Means of transportation to work]()
- 83.8%240Drove a car alone
- 10.1%29Carpooled
- 2.8%8Bus
- 0.3%1Taxi
- 0.3%1Other means
- 5.6%16Worked at home

Time leaving home to go to work
![Time leaving home to go to work]()
- 335:00 a.m. to 5:29 a.m.
- 315:30 a.m. to 5:59 a.m.
- 526:00 a.m. to 6:29 a.m.
- 136:30 a.m. to 6:59 a.m.
- 267:00 a.m. to 7:29 a.m.
- 227:30 a.m. to 7:59 a.m.
- 518:00 a.m. to 8:29 a.m.
- 248:30 a.m. to 8:59 a.m.
- 419:00 a.m. to 9:59 a.m.
- 2810:00 a.m. to 10:59 a.m.
- 311:00 a.m. to 11:59 a.m.
- 2112:00 p.m. to 3:59 p.m.
- 904:00 p.m. to 11:59 p.m.

Occupations of males:
- Percentage of males in management occupations (except farmers):
Here: 4.8% city: 8.2%
- Percentage of males in business and financial operations occupations:
Here: 6.7% city: 4.4%
- Percentage of males in computer and mathematical occupations:
Here: 6.4% city: 4.2%
- Percentage of males in service occupations:
Here: 38.0% city: 16.9%
- Percentage of males in sales and office occupations:
Here: 4.8% city: 15.6%
- Percentage of males in construction, extraction, and maintenance occupations:
Here: 7.3% city: 9.8%
- Percentage of males in production occupations:
Here: 24.9% city: 6.5%
- Percentage of males in transportation occupations:
Here: 7.0% city: 5.3%
Occupations of females:
- Percentage of females in business and financial operations occupations:
Here: 3.1% city: 5.2%
- Percentage of females in education, training, and library occupations:
Here: 5.7% city: 9.1%
- Percentage of females in healthcare practitioners and technical occupations:
Here: 4.7% city: 9.6%
- Percentage of females in service occupations:
Here: 6.3% city: 22.3%
- Percentage of females in sales and office occupations:
Here: 32.8% city: 28.7%
- Percentage of females in production occupations:
Here: 27.0% city: 2.7%
- Percentage of females in transportation occupations:
Here: 20.3% city: 1.6%
Percentage of people 16-64 in Armed Forces:
| Bowling Green: | 3.3% |
| Norfolk: | 15.8% |
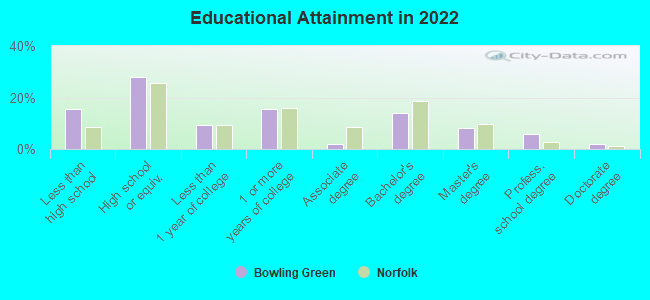
Education in this neighborhood (subdivision or community):
- Percentage of people 3 years and older in K-12 schools:
Bowling Green: 22.5% Norfolk: 14.3%
- Percentage of people 3 years and older in undergraduate colleges:
Bowling Green: 4.1% Norfolk: 8.0%
- Percentage of people 3 years and older in grad. or professional schools:
Bowling Green: 1.1% Norfolk: 2.1%
- Percentage of students K-12 enrolled in private schools:
Bowling Green: 14.9% Norfolk: 16.2%
Percentage of population below poverty level:
| Bowling Green: | 34.3% |
| Norfolk: | 17.7% |
Median year owner moved in (as recorded in 2022):
Median year renter moved in (as recorded in 2022):
| Bowling Green: | 2008 |
| Norfolk: | 2013 |
Median year renter moved in (as recorded in 2022):
| Bowling Green: | 2014 |
| Norfolk: | 2020 |
Percentage of married-couple families with both working:
| Bowling Green: | 67.8% |
| Norfolk: | 65.5% |
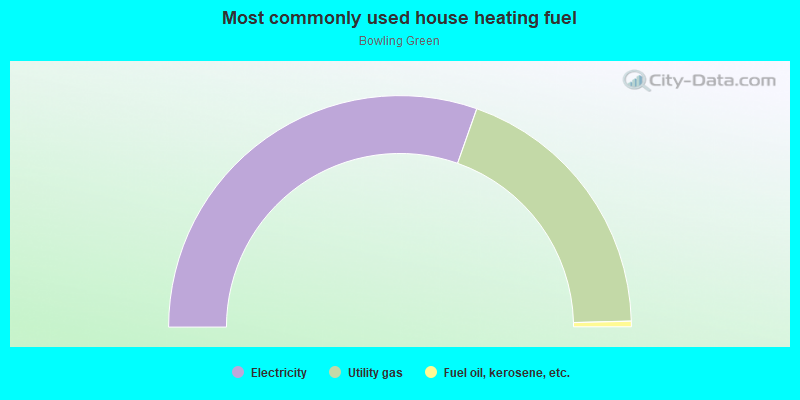
- 60.8%Electricity
- 38.4%Utility gas
- 0.8%Fuel oil, kerosene, etc.
Highways in this neighborhood:
US Hwy 58 (E Virginia Beach Blvd)
Length: 0.04 miles
Direction: E-W
Address range: 3000 to 3009
Direction: E-W
Address range: 3000 to 3009
Roads and streets:
Godfrey Ave
Length: 0.32 miles
Directions: N-S, SW-NE
Address range: 1000 to 1299
Directions: N-S, SW-NE
Address range: 1000 to 1299
Ballentine Blvd
Length: 0.24 miles
Direction: N-S
Address range: 1050 to 1321
Direction: N-S
Address range: 1050 to 1321
Hollister Ave
Length: 0.10 miles
Direction: E-W
Address range: 3000 to 3099
Direction: E-W
Address range: 3000 to 3099
Dogan St
Length: 0.09 miles
Directions: E-W, SW-NE
Address range: 3000 to 3099
Directions: E-W, SW-NE
Address range: 3000 to 3099