Boston (Thurmond) neighborhood in Winston Salem, North Carolina (NC), 27105 detailed profile
Settings
X


Area: 0.198 square miles
Population: 893
Population density: 4,507 people per square mile

- 52857.6%Black
- 23625.8%White
- 11512.6%Hispanic or Latino
- 232.5%Some other race
- 131.4%Two or more races
- 10.1%Asian

Median household income in 2022:
| Boston (Thurmond): | $35,432 |
| North Carolina: | $67,481 |
Distribution of median household income
![Distribution of median household income]()
- 70Less than $10,000
- 100$10,000 to $19,999
- 54$20,000 to $29,999
- 48$30,000 to $39,999
- 35$40,000 to $49,999
- 21$50,000 to $59,999
- 17$60,000 to $74,999
- 29$75,000 to $99,999
- 19$100,000 to $124,999
- 10$125,000 to $149,999
- 27$150,000 to $199,999
- 47$200,000 or more

Distribution of owner-occupied house/condo value
![Distribution of owner-occupied house/condo value]()
- 47Less than $50,000
- 61$50,000 to $99,999
- 34$100,000 to $149,999
- 13$150,000 to $199,999
- 6$200,000 to $249,999
- 6$250,000 to $299,999
- 31$300,000 to $399,999
- 21$400,000 to $499,999
- 27$500,000 to $749,999
- 12$750,000 to $999,999
- 15$1,000,000 or more

Distribution of rent paid by renters
![Distribution of rent paid by renters]()
- 31Less than $100
- 179$100 to $199
- 106$200 to $299
- 33$300 to $399
- 14$400 to $499
- 27$500 to $599
- 22$600 to $699
- 73$700 to $799
- 54$800 to $899
- 2$900 to $999
- 7$1,000 to $1,249
- 8$1,250 to $1,499
- 8$1,500 to $1,999
- 15$2,000 or more

Median rent in 2022:
| Boston (Thurmond): | $494 |
| North Carolina: | $945 |
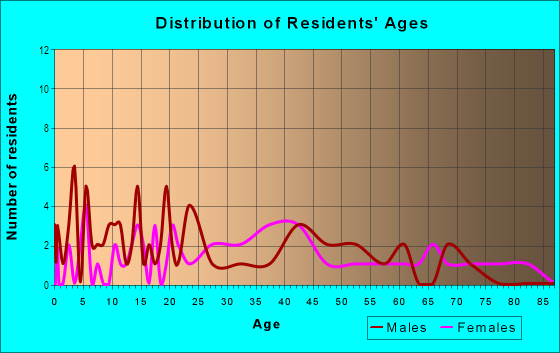
| Males: | 340 |
| Females: | 553 |
| Males: | 36.9 years |
| Females: | 42.1 years |
Average household size:
| Boston (Thurmond): | 9.2 people |
| North Carolina: | 2.4 people |
Percentage of family households:
| Boston (Thurmond): | 37.6% |
| North Carolina: | 46.1% |
| Here: | 25.7% |
| North Carolina: | 47.9% |
Percentage of married-couple families with children (among all households):
| Boston (Thurmond): | 13.7% |
| North Carolina: | 58.9% |
Percentage of single-mother households (among all households):
| Boston (Thurmond): | 34.9% |
| North Carolina: | 10.0% |
Percentage of never married males 15 years old and over:
Percentage of never married females 15 years old and over:
| Boston (Thurmond): | 14.2% |
| North Carolina: | 16.9% |
Percentage of never married females 15 years old and over:
| Boston (Thurmond): | 40.1% |
| North Carolina: | 15.5% |
Percentage of people that speak English not well or not at all:
| Boston (Thurmond): | 1.5% |
| North Carolina: | 2.4% |
Percentage of people born in this state:
Percentage of people born in another U.S. state:
Percentage of native residents but born outside the U.S.:
Percentage of foreign born residents:
| Here: | 69.4% |
| North Carolina: | 53.6% |
Percentage of people born in another U.S. state:
| Boston (Thurmond): | 20.6% |
| North Carolina: | 36.3% |
Percentage of native residents but born outside the U.S.:
| Here: | 0.3% |
| North Carolina: | 1.4% |
Percentage of foreign born residents:
| Here: | 9.9% |
| North Carolina: | 8.6% |

Owner-occupied
Renter-occupied


- Rooms in owner-occupied houses and condos in Boston <
> - 11 room
- 12 rooms
- 233 rooms
- 54 rooms
- 165 rooms
- 336 rooms
- 267 rooms
- 168 rooms
- 619+ rooms

- Rooms in renter-occupied apartments in Boston <
> - 01 room
- 152 rooms
- 733 rooms
- 1034 rooms
- 695 rooms
- 36 rooms
- 27 rooms
- 78 rooms
- 09+ rooms
Owner-occupied
Renter-occupied

- Bedrooms in owner-occupied houses and condos in Boston <
> - 1no bedroom
- 61 bedroom
- 122 bedrooms
- 613 bedrooms
- 374 bedrooms
- 175+ bedrooms

- Bedrooms in renter-occupied apartments in Boston <
> - 0no bedroom
- 1071 bedroom
- 1192 bedrooms
- 393 bedrooms
- 54 bedrooms
- 05+ bedrooms
Average number of cars or other vehicles available in houses/condos:
Average number of cars or other vehicles available in apartments:
| This neighborhood: | 2.1 |
| North Carolina: | 2.2 |
Average number of cars or other vehicles available in apartments:
| Here: | 0.8 |
| North Carolina: | 1.5 |
Percentage of units with a mortgage:
| Boston (Thurmond): | 49.5% |
| North Carolina: | 62.1% |
Average estimated value of detached houses in 2022 (34.3% of all units):
| Boston (Thurmond): | $119,425 |
| North Carolina: | $375,326 |

- Year house built in Boston <
> - 02020 or later
- 392010 to 2019
- 572000 to 2009
- 1261990 to 1999
- 641980 to 1989
- 441970 to 1979
- 141960 to 1969
- 451950 to 1959
- 301940 to 1949
- 401939 or earlier

Travel time to work (commute)
![Travel time to work (commute)]()
- 32Less than 5 minutes
- 175 to 9 minutes
- 5010 to 14 minutes
- 3915 to 19 minutes
- 6720 to 24 minutes
- 625 to 29 minutes
- 430 to 34 minutes
- 435 to 39 minutes
- 240 to 44 minutes
- 145 to 59 minutes
- 360 to 89 minutes

Means of transportation to work
![Means of transportation to work]()
- 70.9%252Drove a car alone
- 16.9%60Carpooled
- 7.6%27Bus
- 0.6%2Bicycle
- 1.4%5Walked
- 3.9%14Other means
- 4.5%16Worked at home

Time leaving home to go to work
![Time leaving home to go to work]()
- 1612:00 a.m. to 4:59 a.m.
- 35:00 a.m. to 5:29 a.m.
- 235:30 a.m. to 5:59 a.m.
- 56:00 a.m. to 6:29 a.m.
- 56:30 a.m. to 6:59 a.m.
- 327:00 a.m. to 7:29 a.m.
- 517:30 a.m. to 7:59 a.m.
- 128:00 a.m. to 8:29 a.m.
- 128:30 a.m. to 8:59 a.m.
- 409:00 a.m. to 9:59 a.m.
- 1110:00 a.m. to 10:59 a.m.
- 311:00 a.m. to 11:59 a.m.
- 612:00 p.m. to 3:59 p.m.
- 64:00 p.m. to 11:59 p.m.

Occupations of males:
- Percentage of males in management occupations (except farmers):
Here: 15.3% North Carolina: 12.7%
- Percentage of males in business and financial operations occupations:
Here: 5.2% North Carolina: 4.9%
- Percentage of males in computer and mathematical occupations:
Here: 1.7% North Carolina: 5.0%
- Percentage of males in architecture and engineering occupations:
Here: 2.4% North Carolina: 3.0%
- Percentage of males in life, physical, and social science occupations:
Here: 1.2% North Carolina: 1.0%
- Percentage of males in education, training, and library occupations:
Here: 1.8% North Carolina: 3.0%
- Percentage of males in healthcare practitioners and technical occupations:
Here: 6.5% North Carolina: 2.8%
- Percentage of males in service occupations:
Here: 2.5% North Carolina: 13.2%
- Percentage of males in sales and office occupations:
Here: 18.0% North Carolina: 14.4%
- Percentage of males in production occupations:
Here: 12.8% North Carolina: 8.3%
- Percentage of males in transportation occupations:
Here: 30.0% North Carolina: 5.9%
- Percentage of males in material moving occupations:
Here: 1.7% North Carolina: 5.9%
Occupations of females:
- Percentage of females in management occupations (except farmers):
Here: 3.5% North Carolina: 9.8%
- Percentage of females in business and financial operations occupations:
Here: 4.4% North Carolina: 6.7%
- Percentage of females in legal occupations:
Here: 1.4% North Carolina: 1.0%
- Percentage of females in education, training, and library occupations:
Here: 3.6% North Carolina: 9.7%
- Percentage of females in healthcare practitioners and technical occupations:
Here: 29.4% North Carolina: 10.3%
- Percentage of females in service occupations:
Here: 14.7% North Carolina: 18.9%
- Percentage of females in sales and office occupations:
Here: 38.8% North Carolina: 26.5%
- Percentage of females in production occupations:
Here: 1.2% North Carolina: 4.7%
- Percentage of females in transportation occupations:
Here: 2.2% North Carolina: 1.1%
Education in this neighborhood (subdivision or community):
- Percentage of people 3 years and older in K-12 schools:
Boston (Thurmond): 21.6% North Carolina: 16.3%
- Percentage of people 3 years and older in undergraduate colleges:
Boston (Thurmond): 7.5% North Carolina: 5.1%
- Percentage of people 3 years and older in grad. or professional schools:
Boston (Thurmond): 0.7% North Carolina: 1.3%
- Percentage of students K-12 enrolled in private schools:
Boston (Thurmond): 8.0% North Carolina: 13.2%
Percentage of population below poverty level:
| Boston (Thurmond): | 42.0% |
| North Carolina: | 12.8% |
Median year owner moved in (as recorded in 2022):
Median year renter moved in (as recorded in 2022):
| Boston (Thurmond): | 2003 |
| North Carolina: | 2011 |
Median year renter moved in (as recorded in 2022):
| Boston (Thurmond): | 2015 |
| North Carolina: | 2020 |
Percentage of married-couple families with both working:
| Boston (Thurmond): | 76.1% |
| North Carolina: | 70.1% |

- 49.0%Electricity
- 36.9%Utility gas
- 6.4%Fuel oil, kerosene, etc.
- 4.7%No fuel used
- 1.9%Bottled, tank, or LP gas
- 1.2%Other fuel
Roads and streets:
W 12th St
Length: 0.43 miles
Directions: E-W, N-S, SW-NE
Address range: 824 to 1099
Directions: E-W, N-S, SW-NE
Address range: 824 to 1099
Haywood St
Length: 0.36 miles
Directions: E-W, N-S, SW-NE
Address range: 700 to 1099
Directions: E-W, N-S, SW-NE
Address range: 700 to 1099
Manly St
Length: 0.33 miles
Direction: N-S
Address range: 900 to 1199
Direction: N-S
Address range: 900 to 1199
Thurmond St
Length: 0.27 miles
Direction: N-S
Address range: 1000 to 1299
Direction: N-S
Address range: 1000 to 1299
W 11th St
Length: 0.25 miles
Directions: E-W, N-S, SE-NW
Address range: 839 to 1199
Directions: E-W, N-S, SE-NW
Address range: 839 to 1199
Row St
Length: 0.24 miles
Direction: E-W
Address range: 2000 to 2099
Direction: E-W
Address range: 2000 to 2099
W 13th St
Length: 0.23 miles
Direction: E-W
Address range: 1000 to 1299
Direction: E-W
Address range: 1000 to 1299
Shrub St
Length: 0.12 miles
Direction: N-S
Address range: 1000 to 1199
Direction: N-S
Address range: 1000 to 1199
Harrison Ave
Length: 0.09 miles
Direction: N-S
Address range: 1200 to 1299
Direction: N-S
Address range: 1200 to 1299
Knox St
Length: 0.08 miles
Directions: E-W, SW-NE
Address range: 1100 to 1199
Directions: E-W, SW-NE
Address range: 1100 to 1199
Tyndall St
Length: 0.07 miles
Directions: N-S, SE-NW
Address range: 1300 to 1335
Directions: N-S, SE-NW
Address range: 1300 to 1335
Woodruff Glen Dr
Length: 0.05 miles
Direction: N-S
Address range: 1300 to 1329
Direction: N-S
Address range: 1300 to 1329
Rundell St
Length: 0.04 miles
Direction: N-S
Address range: 1200 to 1299
Direction: N-S
Address range: 1200 to 1299
Amhurst St
Length: 0.04 miles
Direction: N-S
Direction: N-S
Row St NW
Length: 0.04 miles
Direction: E-W
Direction: E-W
Railroad features:
Southern Rlwy
Length: 0.16 miles
Directions: E-W, SW-NE
Directions: E-W, SW-NE