Queens, New York (NY) income map, earnings map, and wages data
The median household income in Queens, NY in 2022 was $80,557, which was about the same as the median annual income of $79,557 across the entire state of New York. Compared to the median income of $42,439 in 2000 this represents an increase of 47.3%. The per capita income in 2022 was $39,029, which means an increase of 50.7% compared to 2000 when it was $19,222.
Income statistics for all residents
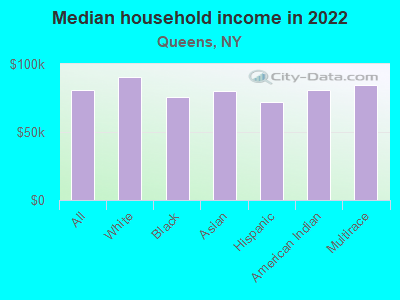
Median household income in Queens, NY in 2022:| Queens: | $80,557 |
| State: | $79,557 |
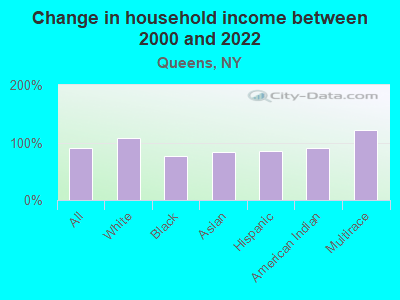
Change in median household income between 2000 and 2022:| Queens, New York: | +89.8% |
| State: | +83.3% |
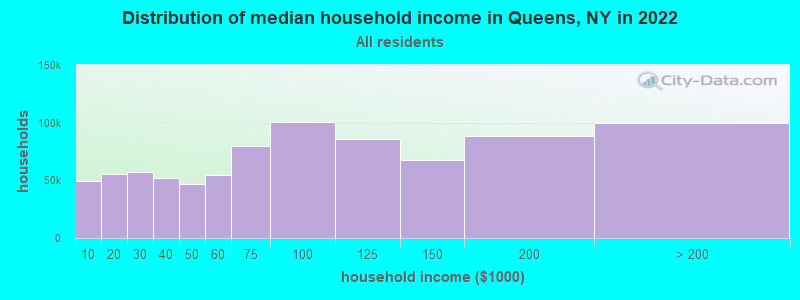
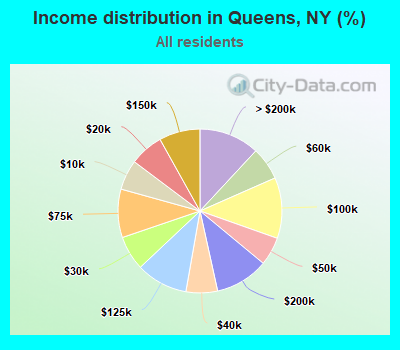
Number of households with income < $10k:| Queens: | 5.9% (49,792) |
| New York: | 6.8% (527,598) |
Number of households with income $10k - 20k:| Queens: | 6.7% (55,945) |
| New York: | 7.4% (574,940) |
Number of households with income $20k - 30k:| Queens: | 6.8% (57,135) |
| State: | 6.7% (517,718) |
Number of households with income $30k - 40k:| Queens: | 6.2% (52,192) |
| State: | 6.5% (506,674) |
Number of households with income $40k - 50k:| Queens: | 5.6% (46,965) |
| New York: | 6.1% (470,439) |
Number of households with income $50k - 60k:| Queens: | 6.5% (54,573) |
| State: | 5.8% (454,042) |
Number of households with income $60k - 75k:| Queens: | 9.5% (80,164) |
| State: | 8.5% (657,508) |
Number of households with income $75k - 100k:| Queens: | 12.0% (100,847) |
| State: | 11.6% (899,824) |
Number of households with income $100k - 125k:| Queens: | 10.2% (85,749) |
| State: | 9.3% (723,825) |
Number of households with income $125k - 150k:| Queens: | 8.1% (67,923) |
| State: | 7.1% (552,420) |
Number of households with income $150k - 200k:| Queens: | 10.5% (88,528) |
| State: | 9.4% (727,051) |
Number of households with income > $200k:| Queens: | 11.9% (100,040) |
| State: | 15.0% (1,162,269) |
Aggregate household income in Queens in 2022: $89,584,624,300
Median family income in Queens in 2022:| Queens: | $89,732 |
| New York: | $99,066 |
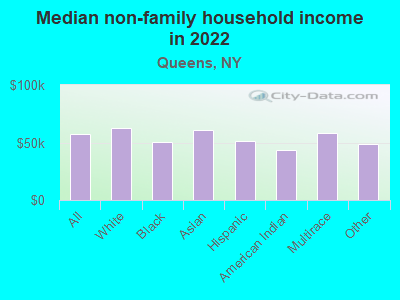
Median non-family income in Queens in 2022:| Queens: | $57,749 |
| New York: | $50,181 |
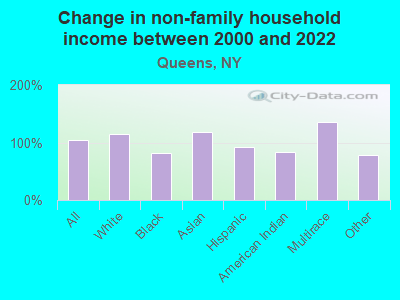
Change in median non-family income between 2000 and 2022:| Queens, New York: | +104.2% |
| New York: | +85.4% |
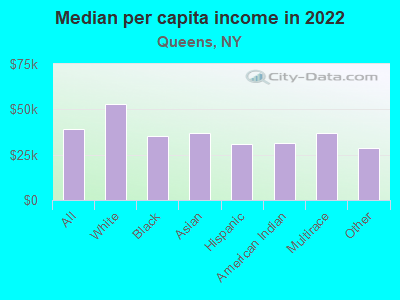
Median per capita income in Queens in 2022:| Queens: | $39,029 |
| State: | $47,421 |
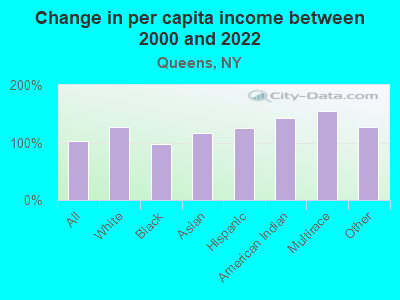
Change in median per capita income between 2000 and 2022:| Queens, New York: | +103.0% |
| State: | +102.7% |
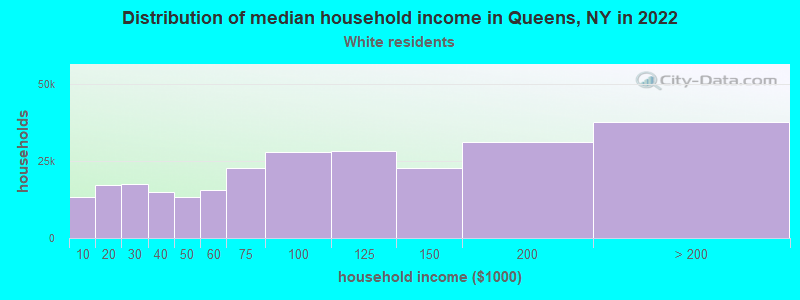
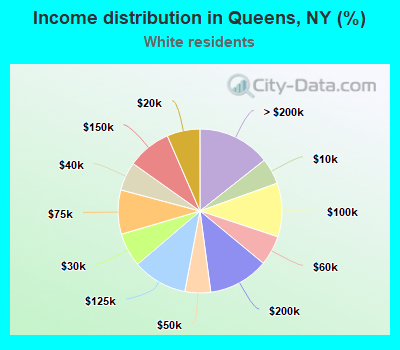
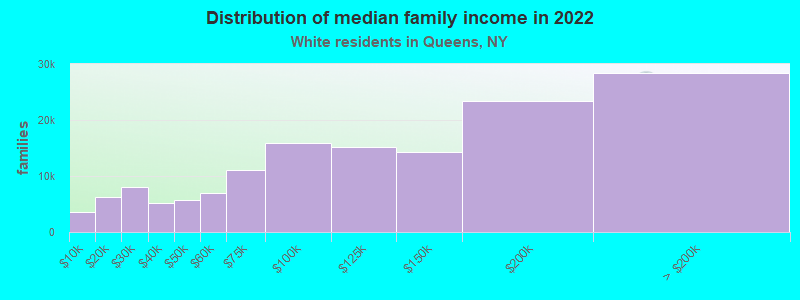
Income statistics for White residents
Median household income in Queens, NY in 2022:| Queens: | $90,749 |
| State: | $89,408 |
Change in median household income between 2000 and 2022:| Queens, New York: | +108.3% |
| State: | +85.5% |
Number of households with income < $10k:| Queens: | 5.1% (13,445) |
| New York: | 4.8% (225,550) |
Number of households with income $10k - 20k:| Queens: | 6.5% (17,057) |
| New York: | 6.1% (289,425) |
Number of households with income $20k - 30k:| Queens: | 6.7% (17,449) |
| State: | 5.9% (280,254) |
Number of households with income $30k - 40k:| Queens: | 5.7% (14,837) |
| State: | 6.1% (288,263) |
Number of households with income $40k - 50k:| Queens: | 5.1% (13,265) |
| New York: | 5.9% (278,079) |
Number of households with income $50k - 60k:| Queens: | 5.9% (15,441) |
| State: | 5.7% (267,554) |
Number of households with income $60k - 75k:| Queens: | 8.7% (22,784) |
| New York: | 8.4% (398,344) |
Number of households with income $75k - 100k:| Queens: | 10.6% (27,722) |
| New York: | 11.8% (554,841) |
Number of households with income $100k - 125k:| Queens: | 10.8% (28,243) |
| State: | 10.0% (469,794) |
Number of households with income $125k - 150k:| Queens: | 8.7% (22,644) |
| New York: | 7.6% (360,467) |
Number of households with income $150k - 200k:| Queens: | 11.9% (31,147) |
| State: | 10.1% (477,078) |
Number of households with income > $200k:| Queens: | 14.4% (37,584) |
| State: | 17.6% (829,233) |
Aggregate household income in Queens in 2022: $30,727,161,300
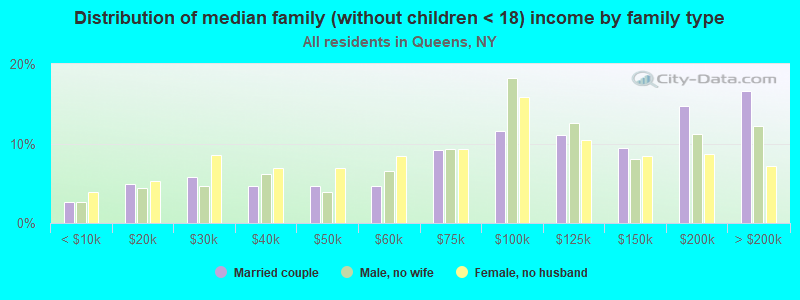
Median family income in Queens in 2022:| Queens: | $112,492 |
| State: | $115,170 |
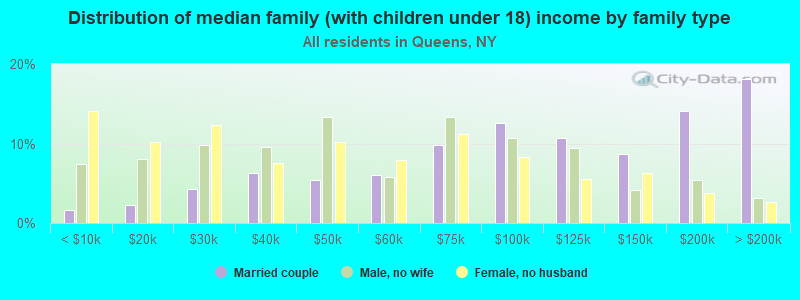
Number of families with income < $10k:| Queens: | 2.4% (3,483) |
| State: | 2.5% (68,851) |
Number of families with income $10k - 20k:| Queens: | 4.3% (6,230) |
| State: | 3.0% (83,127) |
Number of families with income $20k - 30k:| Queens: | 5.6% (8,018) |
| State: | 3.5% (97,578) |
Number of families with income $30k - 40k:| Queens: | 3.6% (5,191) |
| State: | 4.1% (114,108) |
Number of families with income $40k - 50k:| Queens: | 3.9% (5,643) |
| State: | 4.7% (130,902) |
Number of families with income $50k - 60k:| Queens: | 4.9% (7,008) |
| New York: | 4.9% (135,118) |
Number of families with income $60k - 75k:| Queens: | 7.7% (11,106) |
| New York: | 7.8% (216,254) |
Number of families with income $75k - 100k:| Queens: | 11.0% (15,825) |
| State: | 12.4% (342,382) |
Number of families with income $100k - 125k:| Queens: | 10.6% (15,174) |
| State: | 11.4% (314,917) |
Number of families with income $125k - 150k:| Queens: | 9.9% (14,246) |
| State: | 9.4% (260,489) |
Number of families with income $150k - 200k:| Queens: | 16.2% (23,331) |
| State: | 13.2% (365,586) |
Number of families with income > $200k:| Queens: | 19.8% (28,384) |
| New York: | 23.2% (642,319) |
Median non-family income in Queens in 2022:| Queens: | $62,188 |
| State: | $54,783 |
Change in median non-family income between 2000 and 2022:| Queens, New York: | +114.7% |
| State: | +87.9% |
Median per capita income in Queens in 2022:| Queens: | $52,823 |
| New York: | $57,640 |
Change in median per capita income between 2000 and 2022:| Queens, New York: | +126.9% |
| State: | +111.6% |
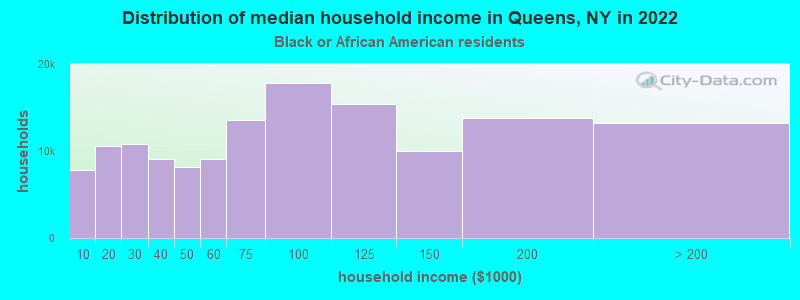
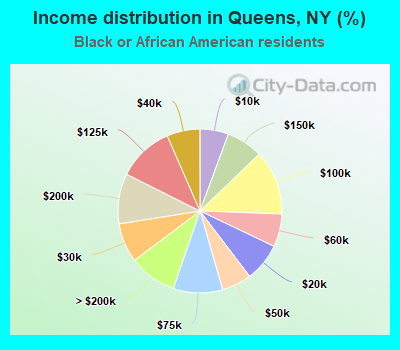
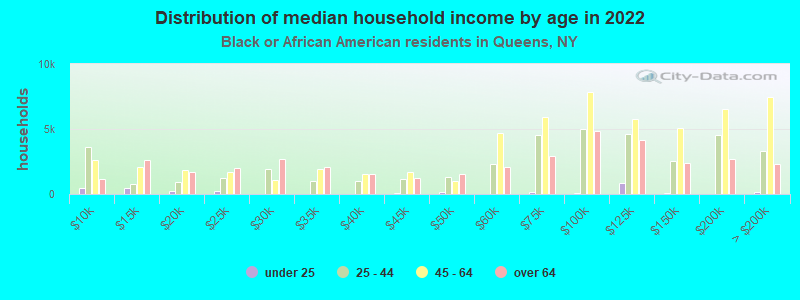
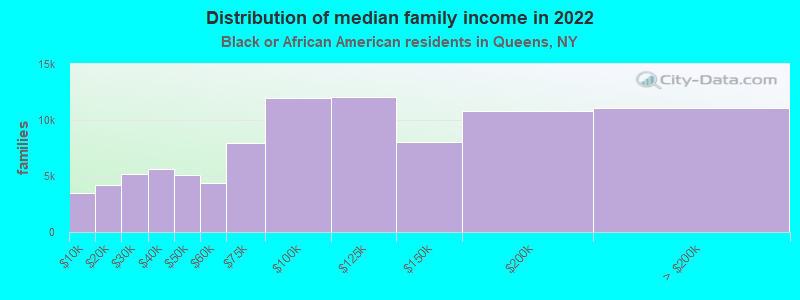
Income statistics for Black or African American residents
Median household income in Queens, NY in 2022:| Queens: | $75,781 |
| New York: | $57,898 |
Change in median household income between 2000 and 2022:| Queens, New York: | +75.8% |
| State: | +84.6% |
Number of households with income < $10k:| Queens: | 5.6% (7,838) |
| New York: | 12.0% (128,500) |
Number of households with income $10k - 20k:| Queens: | 7.6% (10,542) |
| State: | 10.0% (107,541) |
Number of households with income $20k - 30k:| Queens: | 7.8% (10,791) |
| New York: | 8.4% (90,192) |
Number of households with income $30k - 40k:| Queens: | 6.5% (9,085) |
| State: | 7.4% (79,579) |
Number of households with income $40k - 50k:| Queens: | 5.9% (8,194) |
| State: | 6.8% (72,491) |
Number of households with income $50k - 60k:| Queens: | 6.5% (9,058) |
| New York: | 6.7% (71,309) |
Number of households with income $60k - 75k:| Queens: | 9.7% (13,545) |
| State: | 8.9% (95,050) |
Number of households with income $75k - 100k:| Queens: | 12.8% (17,784) |
| New York: | 11.5% (123,569) |
Number of households with income $100k - 125k:| Queens: | 11.1% (15,403) |
| State: | 8.1% (86,632) |
Number of households with income $125k - 150k:| Queens: | 7.2% (9,988) |
| State: | 6.0% (64,788) |
Number of households with income $150k - 200k:| Queens: | 9.9% (13,791) |
| New York: | 7.2% (76,644) |
Number of households with income > $200k:| Queens: | 9.5% (13,170) |
| State: | 7.0% (75,062) |
Aggregate household income in Queens in 2022: $13,410,180,600
Median family income in Queens in 2022:| Queens: | $95,159 |
| State: | $72,528 |
Number of families with income < $10k:| Queens: | 3.9% (3,465) |
| State: | 8.6% (54,100) |
Number of families with income $10k - 20k:| Queens: | 4.7% (4,176) |
| State: | 6.6% (41,506) |
Number of families with income $20k - 30k:| Queens: | 5.7% (5,141) |
| State: | 7.0% (44,139) |
Number of families with income $30k - 40k:| Queens: | 6.3% (5,617) |
| State: | 6.9% (43,353) |
Number of families with income $40k - 50k:| Queens: | 5.7% (5,081) |
| State: | 6.6% (41,419) |
Number of families with income $50k - 60k:| Queens: | 4.9% (4,362) |
| New York: | 6.3% (39,748) |
Number of families with income $60k - 75k:| Queens: | 8.9% (7,960) |
| New York: | 9.2% (57,626) |
Number of families with income $75k - 100k:| Queens: | 13.3% (11,925) |
| State: | 12.6% (78,986) |
Number of families with income $100k - 125k:| Queens: | 13.4% (12,030) |
| New York: | 9.8% (61,670) |
Number of families with income $125k - 150k:| Queens: | 9.0% (8,060) |
| State: | 7.5% (47,050) |
Number of families with income $150k - 200k:| Queens: | 12.0% (10,769) |
| New York: | 9.4% (59,260) |
Number of families with income > $200k:| Queens: | 12.4% (11,115) |
| State: | 9.3% (58,575) |
Median non-family income in Queens in 2022:| Queens: | $50,278 |
| State: | $37,265 |
Change in median non-family income between 2000 and 2022:| Queens, New York: | +80.6% |
| State: | +81.7% |
Median per capita income in Queens in 2022:| Queens: | $35,407 |
| State: | $31,947 |
Change in median per capita income between 2000 and 2022:| Queens, New York: | +98.4% |
| New York: | +106.1% |
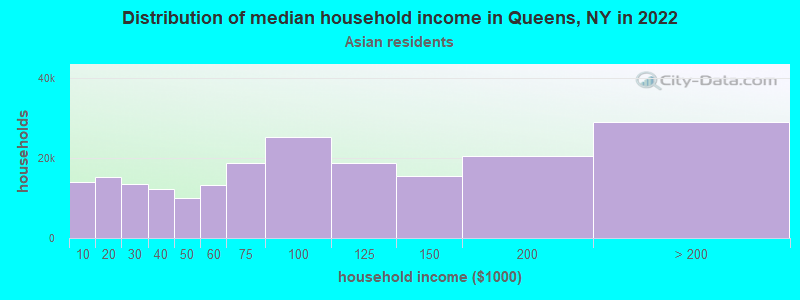
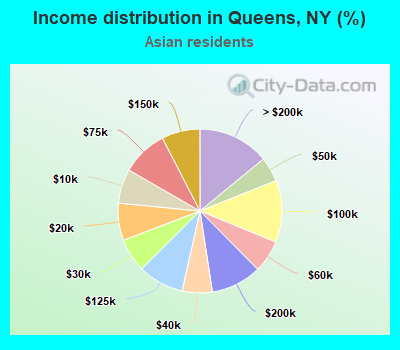
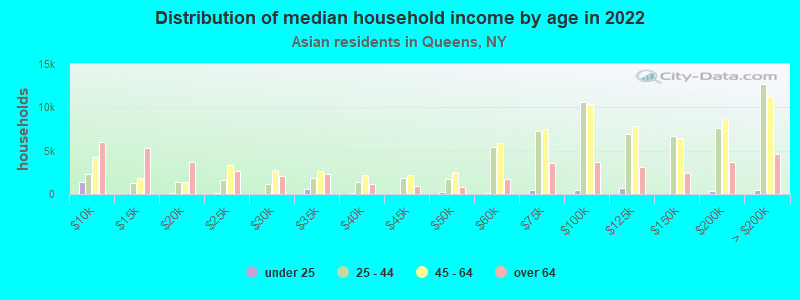
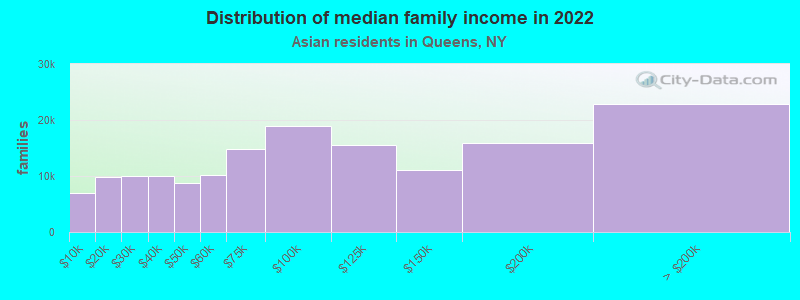
Income statistics for Asian residents
Median household income in Queens, NY in 2022:| Queens: | $80,426 |
| State: | $89,947 |
Change in median household income between 2000 and 2022:| Queens, New York: | +84.4% |
| New York: | +98.1% |
Number of households with income < $10k:| Queens: | 6.8% (13,932) |
| State: | 6.9% (42,537) |
Number of households with income $10k - 20k:| Queens: | 7.4% (15,097) |
| New York: | 7.3% (44,745) |
Number of households with income $20k - 30k:| Queens: | 6.6% (13,575) |
| State: | 6.2% (38,249) |
Number of households with income $30k - 40k:| Queens: | 5.9% (12,195) |
| New York: | 5.5% (33,993) |
Number of households with income $40k - 50k:| Queens: | 4.9% (10,030) |
| State: | 4.8% (29,795) |
Number of households with income $50k - 60k:| Queens: | 6.4% (13,127) |
| New York: | 5.2% (32,100) |
Number of households with income $60k - 75k:| Queens: | 9.1% (18,701) |
| State: | 7.3% (44,615) |
Number of households with income $75k - 100k:| Queens: | 12.2% (25,128) |
| New York: | 10.8% (66,687) |
Number of households with income $100k - 125k:| Queens: | 9.1% (18,593) |
| State: | 8.2% (50,233) |
Number of households with income $125k - 150k:| Queens: | 7.6% (15,525) |
| State: | 7.2% (44,299) |
Number of households with income $150k - 200k:| Queens: | 10.0% (20,497) |
| State: | 10.4% (63,837) |
Number of households with income > $200k:| Queens: | 14.1% (28,926) |
| State: | 20.1% (123,891) |
Aggregate household income in Queens in 2022: $22,724,549,500
Median family income in Queens in 2022:| Queens: | $83,211 |
| State: | $98,136 |
Number of families with income < $10k:| Queens: | 4.5% (6,989) |
| State: | 4.1% (18,020) |
Number of families with income $10k - 20k:| Queens: | 6.3% (9,830) |
| State: | 5.2% (22,725) |
Number of families with income $20k - 30k:| Queens: | 6.4% (9,922) |
| State: | 6.4% (27,990) |
Number of families with income $30k - 40k:| Queens: | 6.5% (10,004) |
| State: | 6.2% (26,994) |
Number of families with income $40k - 50k:| Queens: | 5.7% (8,768) |
| New York: | 5.2% (22,750) |
Number of families with income $50k - 60k:| Queens: | 6.5% (10,120) |
| State: | 5.5% (24,015) |
Number of families with income $60k - 75k:| Queens: | 9.6% (14,835) |
| State: | 7.6% (33,120) |
Number of families with income $75k - 100k:| Queens: | 12.2% (18,955) |
| State: | 10.7% (46,726) |
Number of families with income $100k - 125k:| Queens: | 10.0% (15,460) |
| New York: | 8.6% (37,796) |
Number of families with income $125k - 150k:| Queens: | 7.2% (11,126) |
| State: | 7.3% (31,893) |
Number of families with income $150k - 200k:| Queens: | 10.3% (15,911) |
| State: | 11.0% (48,177) |
Number of families with income > $200k:| Queens: | 14.8% (22,931) |
| New York: | 22.2% (97,322) |
Median non-family income in Queens in 2022:| Queens: | $61,259 |
| State: | $63,573 |
Change in median non-family income between 2000 and 2022:| Queens, New York: | +118.7% |
| State: | +101.1% |
Median per capita income in Queens in 2022:| Queens: | $36,692 |
| New York: | $46,726 |
Change in median per capita income between 2000 and 2022:| Queens, New York: | +117.1% |
| State: | +126.6% |
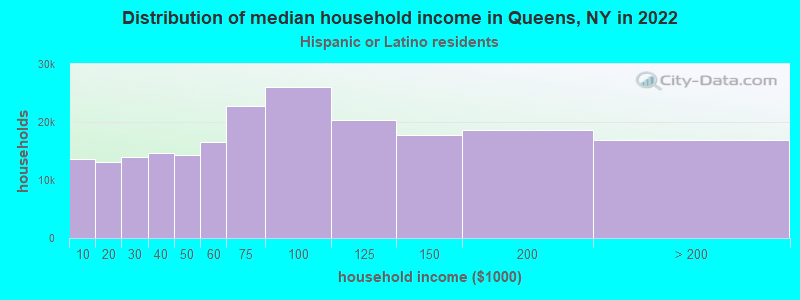
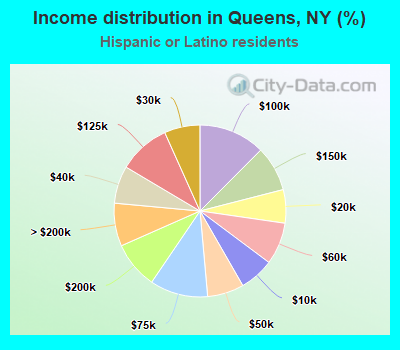
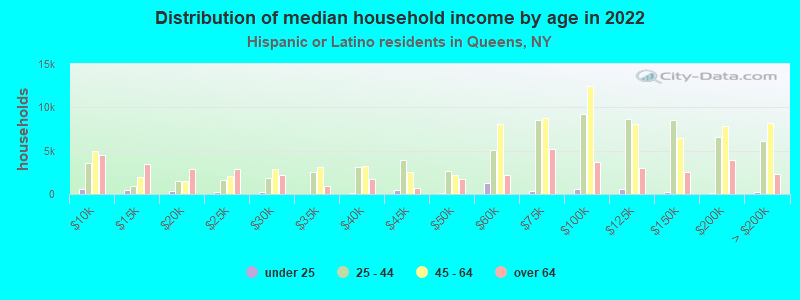
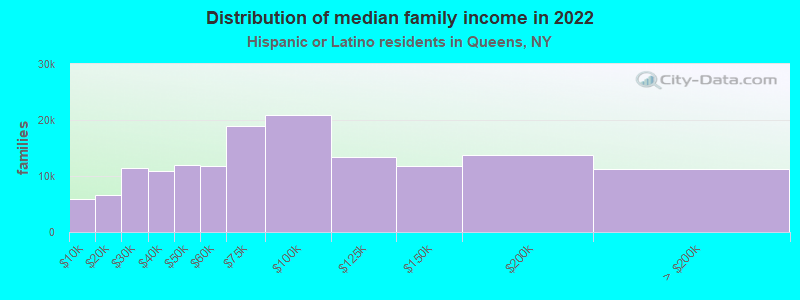
Income statistics for Hispanic or Latino residents
Median household income in Queens, NY in 2022:| Queens: | $71,929 |
| State: | $60,468 |
Change in median household income between 2000 and 2022:| Queens, New York: | +85.8% |
| State: | +98.3% |
Number of households with income < $10k:| Queens: | 6.5% (13,544) |
| State: | 9.9% (127,185) |
Number of households with income $10k - 20k:| Queens: | 6.3% (13,096) |
| State: | 10.7% (136,699) |
Number of households with income $20k - 30k:| Queens: | 6.7% (13,986) |
| New York: | 8.1% (102,991) |
Number of households with income $30k - 40k:| Queens: | 7.1% (14,737) |
| New York: | 7.8% (100,149) |
Number of households with income $40k - 50k:| Queens: | 6.9% (14,351) |
| State: | 6.9% (87,760) |
Number of households with income $50k - 60k:| Queens: | 7.9% (16,566) |
| State: | 6.3% (80,968) |
Number of households with income $60k - 75k:| Queens: | 10.9% (22,775) |
| State: | 8.7% (110,631) |
Number of households with income $75k - 100k:| Queens: | 12.5% (26,070) |
| State: | 11.2% (142,787) |
Number of households with income $100k - 125k:| Queens: | 9.8% (20,389) |
| State: | 8.2% (104,850) |
Number of households with income $125k - 150k:| Queens: | 8.5% (17,783) |
| State: | 6.3% (80,274) |
Number of households with income $150k - 200k:| Queens: | 8.9% (18,543) |
| New York: | 7.4% (95,117) |
Number of households with income > $200k:| Queens: | 8.1% (16,873) |
| State: | 8.6% (109,514) |
Aggregate household income in Queens in 2022: $19,646,772,200
Median family income in Queens in 2022:| Queens: | $72,369 |
| State: | $68,770 |
Number of families with income < $10k:| Queens: | 4.0% (5,937) |
| State: | 6.9% (58,565) |
Number of families with income $10k - 20k:| Queens: | 4.4% (6,587) |
| State: | 7.0% (59,058) |
Number of families with income $20k - 30k:| Queens: | 7.7% (11,466) |
| New York: | 8.0% (68,048) |
Number of families with income $30k - 40k:| Queens: | 7.3% (10,823) |
| State: | 8.4% (70,668) |
Number of families with income $40k - 50k:| Queens: | 8.1% (12,029) |
| State: | 7.4% (62,941) |
Number of families with income $50k - 60k:| Queens: | 7.9% (11,800) |
| New York: | 6.6% (55,592) |
Number of families with income $60k - 75k:| Queens: | 12.7% (18,912) |
| State: | 9.3% (78,564) |
Number of families with income $75k - 100k:| Queens: | 14.1% (20,915) |
| State: | 12.6% (106,685) |
Number of families with income $100k - 125k:| Queens: | 9.1% (13,480) |
| New York: | 9.4% (79,139) |
Number of families with income $125k - 150k:| Queens: | 8.0% (11,873) |
| New York: | 6.9% (58,255) |
Number of families with income $150k - 200k:| Queens: | 9.2% (13,680) |
| New York: | 8.3% (69,877) |
Number of families with income > $200k:| Queens: | 7.6% (11,245) |
| State: | 9.3% (78,555) |
Median non-family income in Queens in 2022:| Queens: | $51,386 |
| New York: | $34,000 |
Change in median non-family income between 2000 and 2022:| Queens, New York: | +92.6% |
| New York: | +93.9% |
Median per capita income in Queens in 2022:| Queens: | $30,739 |
| State: | $29,761 |
Change in median per capita income between 2000 and 2022:| Queens, New York: | +124.5% |
| New York: | +132.7% |
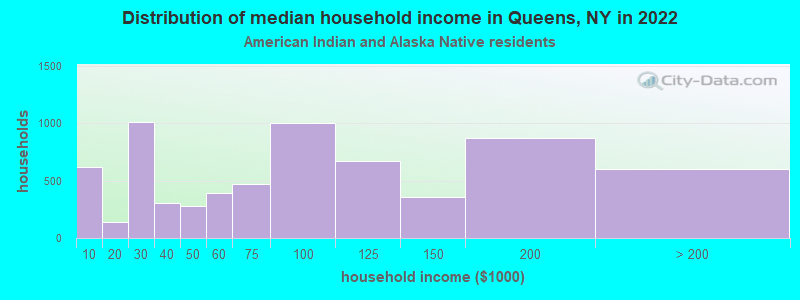
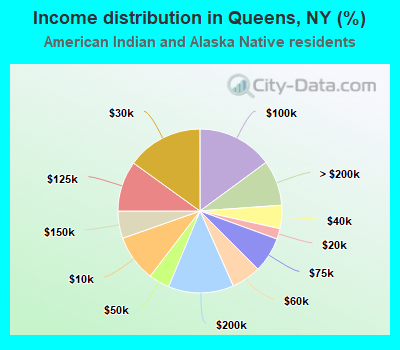
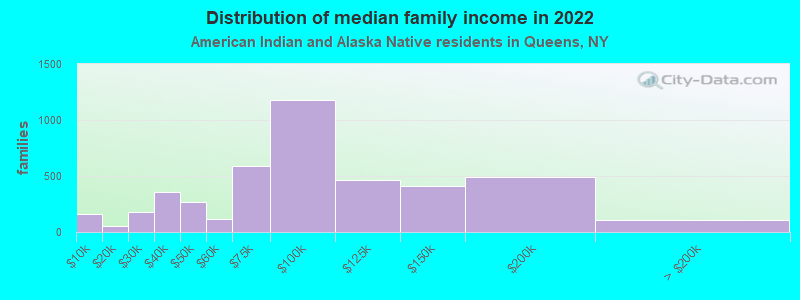
Income statistics for American Indian and Alaska Native residents
Median household income in Queens, NY in 2022:| Queens: | $80,798 |
| New York: | $63,208 |
Change in median household income between 2000 and 2022:| Queens, New York: | +91.5% |
| State: | +110.1% |
Number of households with income < $10k:| Queens: | 9.2% (621) |
| State: | 8.6% (3,559) |
Number of households with income $10k - 20k:| Queens: | 2.1% (141) |
| State: | 5.9% (2,455) |
Number of households with income $20k - 30k:| Queens: | 15.0% (1,013) |
| State: | 8.2% (3,393) |
Number of households with income $30k - 40k:| Queens: | 4.6% (309) |
| New York: | 11.9% (4,918) |
Number of households with income $40k - 50k:| Queens: | 4.1% (277) |
| State: | 6.5% (2,682) |
Number of households with income $50k - 60k:| Queens: | 5.8% (393) |
| State: | 6.1% (2,516) |
Number of households with income $60k - 75k:| Queens: | 7.0% (469) |
| State: | 10.0% (4,125) |
Number of households with income $75k - 100k:| Queens: | 14.9% (1,004) |
| State: | 13.3% (5,517) |
Number of households with income $100k - 125k:| Queens: | 10.0% (671) |
| New York: | 8.4% (3,463) |
Number of households with income $125k - 150k:| Queens: | 5.4% (362) |
| State: | 7.0% (2,887) |
Number of households with income $150k - 200k:| Queens: | 12.9% (869) |
| State: | 9.9% (4,106) |
Number of households with income > $200k:| Queens: | 9.0% (604) |
| New York: | 4.2% (1,744) |
Aggregate household income in Queens in 2022: $601,077,300
Median family income in Queens in 2022:| Queens: | $97,684 |
| State: | $69,721 |
Number of families with income < $10k:| Queens: | 3.6% (157) |
| New York: | 8.3% (2,415) |
Number of families with income $10k - 20k:| Queens: | 1.2% (54) |
| State: | 2.6% (761) |
Number of families with income $20k - 30k:| Queens: | 4.1% (179) |
| State: | 6.2% (1,790) |
Number of families with income $30k - 40k:| Queens: | 8.2% (358) |
| State: | 12.0% (3,480) |
Number of families with income $40k - 50k:| Queens: | 6.2% (272) |
| State: | 8.7% (2,524) |
Number of families with income $50k - 60k:| Queens: | 2.7% (118) |
| State: | 3.4% (985) |
Number of families with income $60k - 75k:| Queens: | 13.5% (592) |
| New York: | 11.8% (3,425) |
Number of families with income $75k - 100k:| Queens: | 26.9% (1,177) |
| State: | 14.9% (4,311) |
Number of families with income $100k - 125k:| Queens: | 10.6% (465) |
| New York: | 10.1% (2,936) |
Number of families with income $125k - 150k:| Queens: | 9.3% (408) |
| State: | 7.6% (2,216) |
Number of families with income $150k - 200k:| Queens: | 11.3% (494) |
| State: | 11.6% (3,365) |
Number of families with income > $200k:| Queens: | 2.5% (108) |
| New York: | 2.8% (822) |
Median non-family income in Queens in 2022:| Queens: | $43,758 |
| State: | $33,910 |
Change in median non-family income between 2000 and 2022:| Queens, New York: | +83.2% |
| State: | +89.9% |
Median per capita income in Queens in 2022:| Queens: | $31,533 |
| State: | $25,837 |
Change in median per capita income between 2000 and 2022:| Queens, New York: | +141.7% |
| State: | +99.6% |
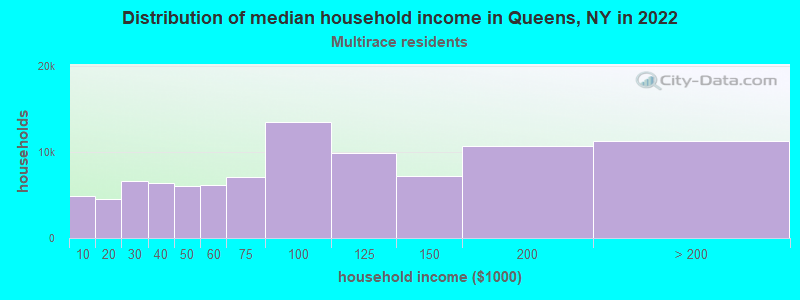
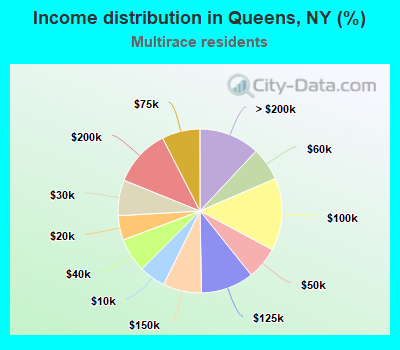
Income statistics for Multirace residents
Median household income in Queens, NY in 2022:| Queens: | $84,442 |
| State: | $73,557 |
Change in median household income between 2000 and 2022:| Queens, New York: | +120.5% |
| New York: | +123.9% |
Number of households with income < $10k:| Queens: | 5.2% (4,876) |
| New York: | 8.9% (57,924) |
Number of households with income $10k - 20k:| Queens: | 4.8% (4,553) |
| New York: | 8.7% (56,590) |
Number of households with income $20k - 30k:| Queens: | 7.0% (6,633) |
| State: | 7.1% (46,287) |
Number of households with income $30k - 40k:| Queens: | 6.8% (6,384) |
| New York: | 6.9% (45,132) |
Number of households with income $40k - 50k:| Queens: | 6.4% (6,067) |
| State: | 5.8% (37,946) |
Number of households with income $50k - 60k:| Queens: | 6.6% (6,198) |
| State: | 5.6% (36,410) |
Number of households with income $60k - 75k:| Queens: | 7.5% (7,110) |
| New York: | 7.8% (50,819) |
Number of households with income $75k - 100k:| Queens: | 14.3% (13,492) |
| State: | 11.7% (76,024) |
Number of households with income $100k - 125k:| Queens: | 10.4% (9,863) |
| State: | 9.3% (60,635) |
Number of households with income $125k - 150k:| Queens: | 7.6% (7,202) |
| State: | 6.2% (40,533) |
Number of households with income $150k - 200k:| Queens: | 11.3% (10,704) |
| State: | 8.6% (56,409) |
Number of households with income > $200k:| Queens: | 12.0% (11,304) |
| State: | 13.4% (87,442) |
Aggregate household income in Queens in 2022: $10,206,276,400
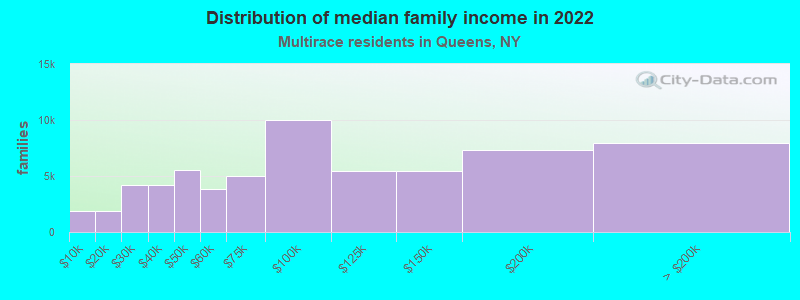
Median family income in Queens in 2022:| Queens: | $85,898 |
| State: | $85,788 |
Number of families with income < $10k:| Queens: | 3.0% (1,916) |
| New York: | 6.2% (24,976) |
Number of families with income $10k - 20k:| Queens: | 3.0% (1,898) |
| New York: | 5.6% (22,512) |
Number of families with income $20k - 30k:| Queens: | 6.7% (4,212) |
| New York: | 6.6% (26,534) |
Number of families with income $30k - 40k:| Queens: | 6.7% (4,202) |
| State: | 6.5% (26,239) |
Number of families with income $40k - 50k:| Queens: | 8.8% (5,532) |
| State: | 6.1% (24,694) |
Number of families with income $50k - 60k:| Queens: | 6.2% (3,875) |
| New York: | 5.5% (22,002) |
Number of families with income $60k - 75k:| Queens: | 8.0% (5,025) |
| New York: | 7.6% (30,653) |
Number of families with income $75k - 100k:| Queens: | 15.9% (9,964) |
| State: | 12.9% (51,995) |
Number of families with income $100k - 125k:| Queens: | 8.6% (5,428) |
| New York: | 10.7% (43,036) |
Number of families with income $125k - 150k:| Queens: | 8.7% (5,479) |
| State: | 7.1% (28,583) |
Number of families with income $150k - 200k:| Queens: | 11.7% (7,358) |
| State: | 9.4% (37,771) |
Number of families with income > $200k:| Queens: | 12.7% (7,959) |
| State: | 15.7% (62,951) |
Median non-family income in Queens in 2022:| Queens: | $58,186 |
| State: | $46,403 |
Change in median non-family income between 2000 and 2022:| Queens, New York: | +135.1% |
| State: | +113.6% |
Median per capita income in Queens in 2022:| Queens: | $36,822 |
| New York: | $36,931 |
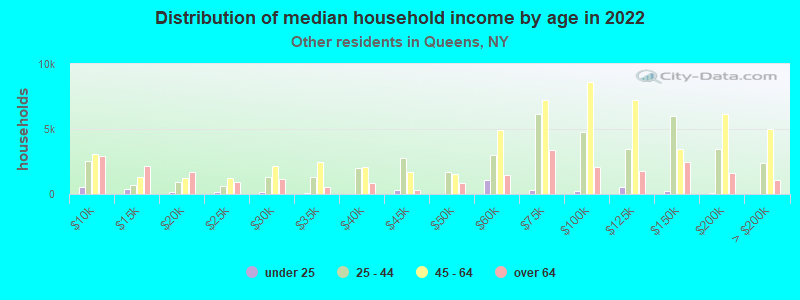
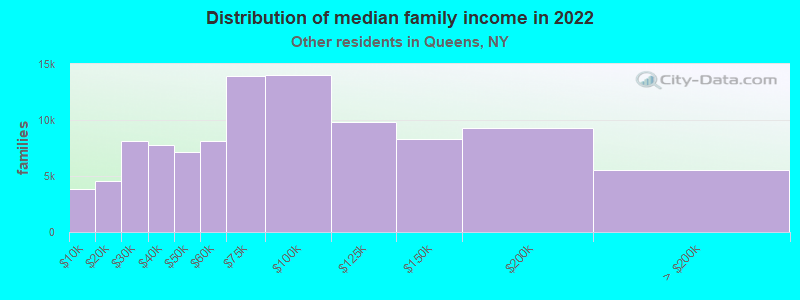
Income statistics for other residents
Number of households with income < $10k:| Queens: | 6.9% (9,080) |
| State: | 10.3% (69,252) |
Number of households with income $10k - 20k:| Queens: | 6.4% (8,405) |
| State: | 11.0% (73,890) |
Number of households with income $20k - 30k:| Queens: | 5.8% (7,674) |
| State: | 8.8% (59,096) |
Number of households with income $30k - 40k:| Queens: | 7.1% (9,382) |
| State: | 8.1% (54,418) |
Number of households with income $40k - 50k:| Queens: | 6.9% (9,132) |
| New York: | 7.3% (49,042) |
Number of households with income $50k - 60k:| Queens: | 7.9% (10,356) |
| New York: | 6.5% (43,945) |
Number of households with income $60k - 75k:| Queens: | 13.0% (17,087) |
| State: | 9.5% (64,087) |
Number of households with income $75k - 100k:| Queens: | 11.9% (15,717) |
| State: | 10.9% (73,094) |
Number of households with income $100k - 125k:| Queens: | 9.9% (12,976) |
| State: | 7.9% (53,055) |
Number of households with income $125k - 150k:| Queens: | 9.3% (12,202) |
| New York: | 5.9% (39,446) |
Number of households with income $150k - 200k:| Queens: | 8.5% (11,237) |
| State: | 7.2% (48,653) |
Number of households with income > $200k:| Queens: | 6.4% (8,452) |
| New York: | 6.6% (44,703) |
Aggregate household income in Queens in 2022: $11,839,699,100
Median family income in Queens in 2022:| Queens: | $71,620 |
| State: | $63,465 |
Number of families with income < $10k:| Queens: | 3.8% (3,813) |
| State: | 6.2% (29,008) |
Number of families with income $10k - 20k:| Queens: | 4.5% (4,535) |
| State: | 7.4% (34,598) |
Number of families with income $20k - 30k:| Queens: | 8.1% (8,108) |
| State: | 9.2% (43,198) |
Number of families with income $30k - 40k:| Queens: | 7.7% (7,725) |
| State: | 9.5% (44,688) |
Number of families with income $40k - 50k:| Queens: | 7.1% (7,148) |
| New York: | 7.8% (36,771) |
Number of families with income $50k - 60k:| Queens: | 8.1% (8,144) |
| State: | 7.1% (33,324) |
Number of families with income $60k - 75k:| Queens: | 13.9% (13,945) |
| State: | 10.1% (47,546) |
Number of families with income $75k - 100k:| Queens: | 14.0% (14,042) |
| State: | 12.5% (58,659) |
Number of families with income $100k - 125k:| Queens: | 9.8% (9,844) |
| State: | 8.6% (40,211) |
Number of families with income $125k - 150k:| Queens: | 8.2% (8,273) |
| New York: | 6.5% (30,363) |
Number of families with income $150k - 200k:| Queens: | 9.3% (9,306) |
| State: | 7.9% (37,167) |
Number of families with income > $200k:| Queens: | 5.5% (5,494) |
| State: | 7.2% (33,950) |
Median non-family income in Queens in 2022:| Queens: | $49,083 |
| State: | $26,983 |
Change in median non-family income between 2000 and 2022:| Queens, New York: | +79.0% |
| State: | +66.4% |
Median per capita income in Queens in 2022:| Queens: | $28,567 |
| New York: | $26,975 |
Change in median per capita income between 2000 and 2022:| Queens, New York: | +127.5% |
| New York: | +144.6% |