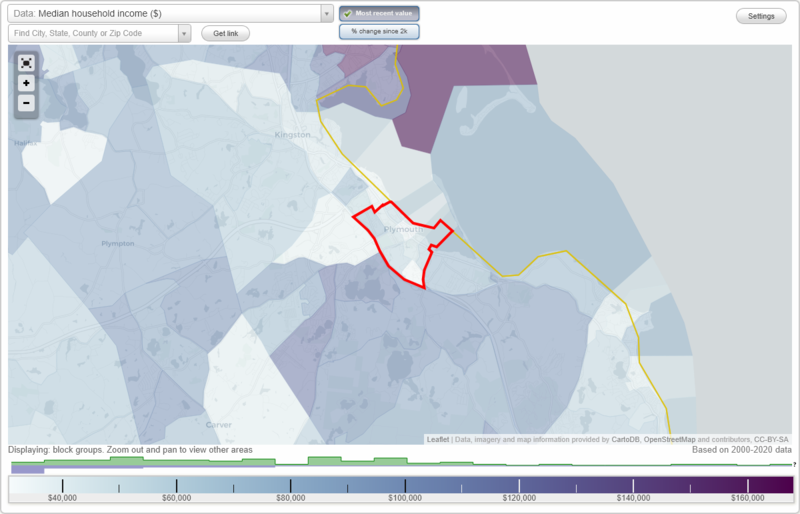
The median household income in Plymouth, MA in 2022 was $72,934, which was 29.6% less than the median annual income of $94,488 across the entire state of Massachusetts. Compared to the median income of $39,759 in 2000 this represents an increase of 45.5%. The per capita income in 2022 was $50,307, which means an increase of 56.9% compared to 2000 when it was $21,693.
Whole page based on the data from 2000 / 2022 when the population of Plymouth, Massachusetts was 7,658 / 7,700
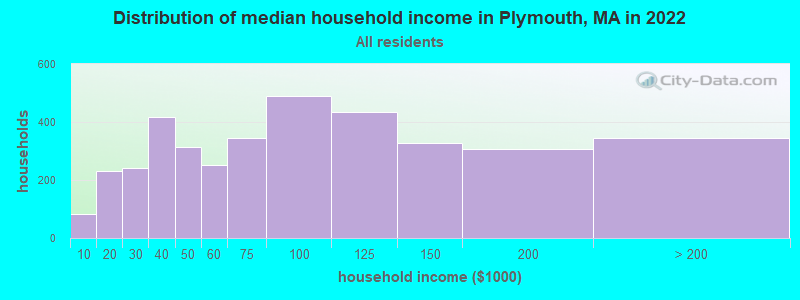
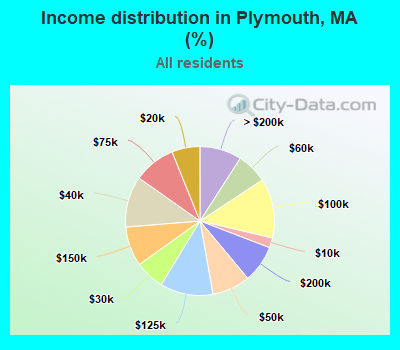
Income statistics for all residents
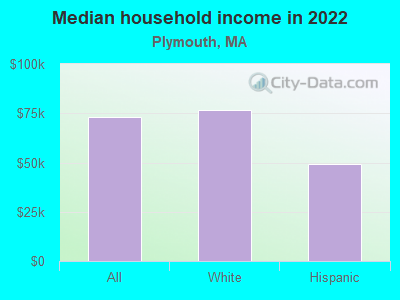
Median household income in Plymouth, MA in 2022:
Plymouth:
$72,935
State:
$94,488
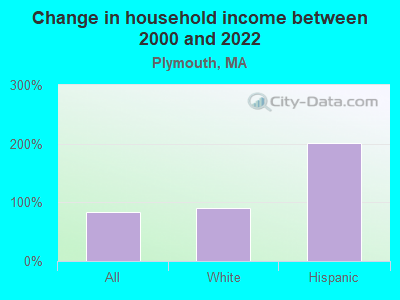
Change in median household income between 2000 and 2022:
Plymouth, Massachusetts:
+83.4%
State:
+87.1%
Number of households with income < $10k:
Plymouth:
2.2% (82)
Massachusetts:
5.2% (146,170)
Number of households with income $10k - 20k:
Plymouth:
6.1% (231)
State:
6.4% (180,001)
Number of households with income $20k - 30k:
Plymouth:
6.4% (242)
State:
5.6% (156,667)
Number of households with income $30k - 40k:
Plymouth:
11.0% (418)
State:
5.6% (157,168)
Number of households with income $40k - 50k:
Plymouth:
8.3% (313)
State:
5.4% (151,455)
Number of households with income $50k - 60k:
Plymouth:
6.7% (252)
Massachusetts:
5.1% (142,726)
Number of households with income $60k - 75k:
Plymouth:
9.1% (345)
Massachusetts:
7.6% (212,203)
Number of households with income $75k - 100k:
Plymouth:
12.9% (489)
State:
11.3% (317,064)
Number of households with income $100k - 125k:
Plymouth:
11.5% (435)
Massachusetts:
9.7% (270,603)
Number of households with income $125k - 150k:
Plymouth:
8.6% (326)
Massachusetts:
8.0% (223,140)
Number of households with income $150k - 200k:
Plymouth:
8.1% (306)
State:
11.0% (308,695)
Number of households with income > $200k:
Plymouth:
9.1% (344)
Massachusetts:
19.0% (531,884)
Aggregate household income in Plymouth in 2022: $381,795,306
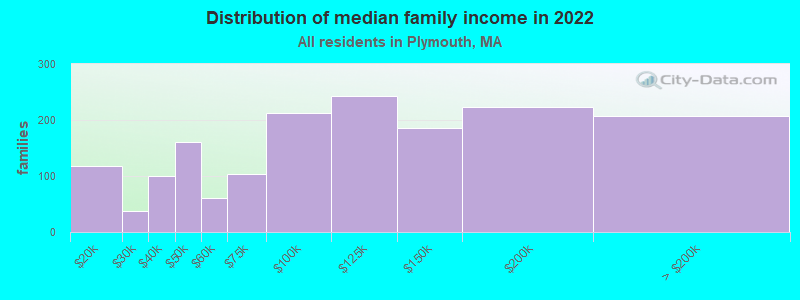
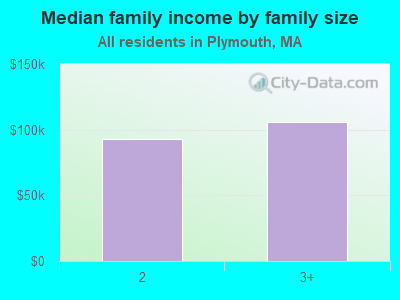
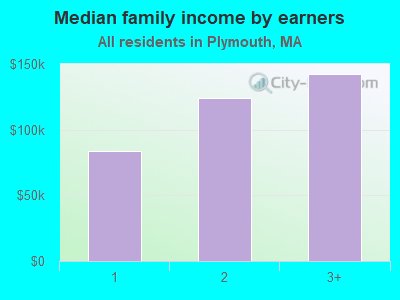
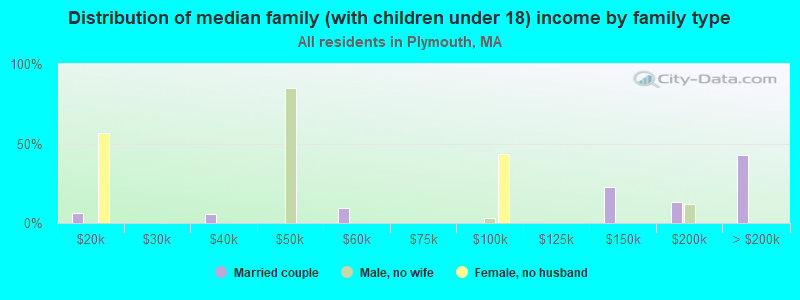
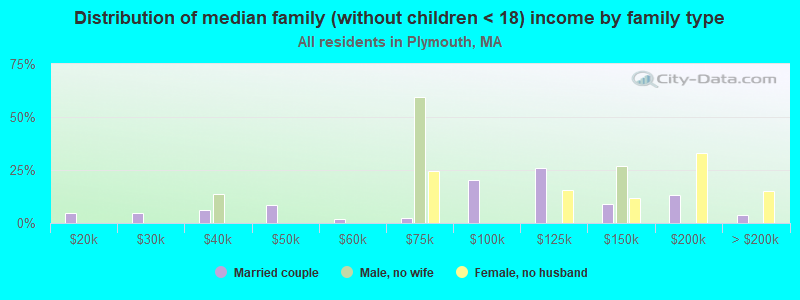
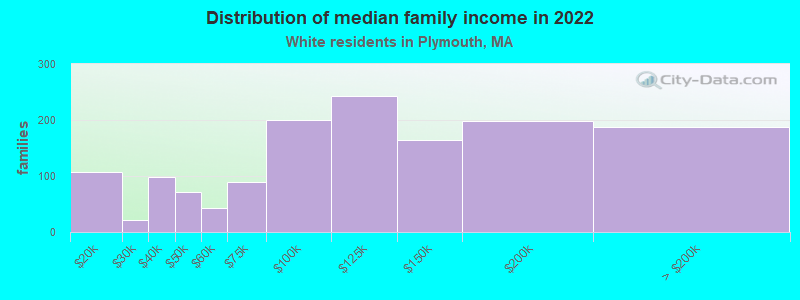
Median family income in Plymouth in 2022:
Plymouth:
$107,807
Massachusetts:
$120,263
Number of families with income $10k - 20k:
Plymouth:
7.2% (118)
State:
2.9% (50,542)
Number of families with income $20k - 30k:
Plymouth:
2.3% (38)
State:
3.9% (66,398)
Number of families with income $30k - 40k:
Plymouth:
6.1% (100)
State:
4.5% (78,234)
Number of families with income $40k - 50k:
Plymouth:
9.7% (160)
Massachusetts:
4.5% (77,656)
Number of families with income $50k - 60k:
Plymouth:
3.7% (61)
Massachusetts:
4.5% (77,928)
Number of families with income $60k - 75k:
Plymouth:
6.2% (103)
State:
7.0% (120,295)
Number of families with income $75k - 100k:
Plymouth:
12.9% (213)
State:
11.1% (192,172)
Number of families with income $100k - 125k:
Plymouth:
14.7% (242)
State:
10.6% (182,105)
Number of families with income $125k - 150k:
Plymouth:
11.2% (185)
Massachusetts:
9.3% (159,566)
Number of families with income $150k - 200k:
Plymouth:
13.5% (223)
State:
13.4% (231,410)
Number of families with income > $200k:
Plymouth:
12.6% (207)
Massachusetts:
25.4% (438,378)
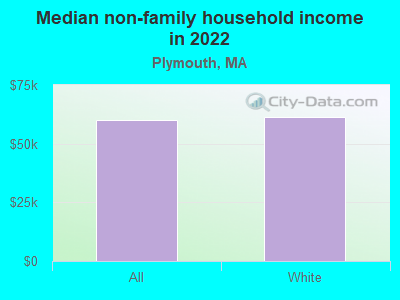
Median non-family income in Plymouth in 2022:
Plymouth:
$59,953
State:
$55,979
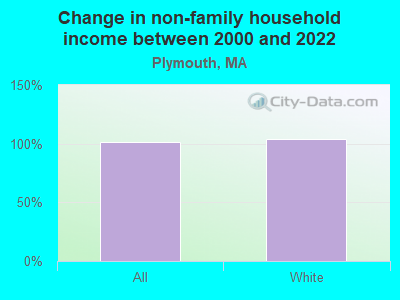
Change in median non-family income between 2000 and 2022:
Plymouth, Massachusetts:
+101.0%
State:
+88.0%
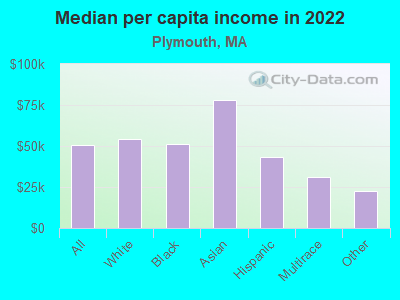
Median per capita income in Plymouth in 2022:
Plymouth:
$50,307
State:
$54,025
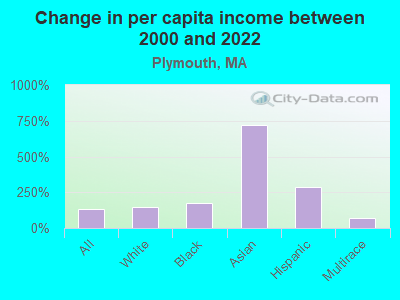
Change in median per capita income between 2000 and 2022:
Plymouth, Massachusetts:
+131.9%
Massachusetts:
+108.2%
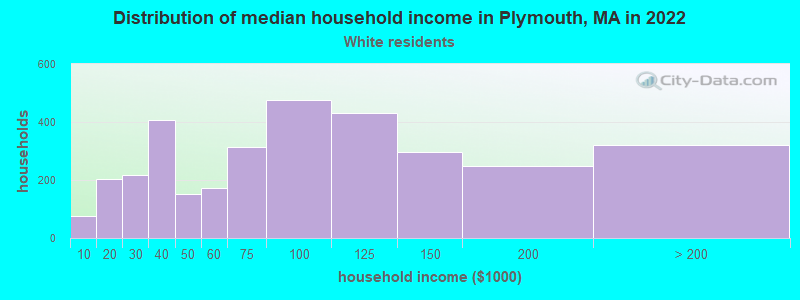
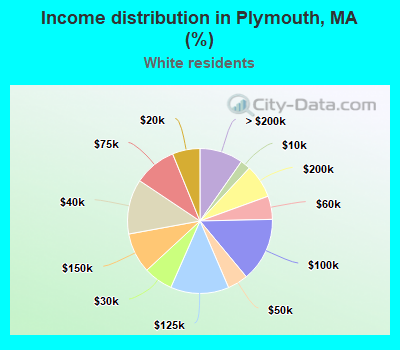
Income statistics for White residents
Median household income in Plymouth, MA in 2022:
Plymouth:
$76,537
Massachusetts:
$101,391
Change in median household income between 2000 and 2022:
Plymouth, Massachusetts:
+90.8%
Massachusetts:
+93.3%
Number of households with income < $10k:
Plymouth:
2.3% (75)
State:
4.4% (91,120)
Number of households with income $10k - 20k:
Plymouth:
6.2% (204)
Massachusetts:
5.9% (122,055)
Number of households with income $20k - 30k:
Plymouth:
6.5% (217)
State:
5.1% (105,311)
Number of households with income $30k - 40k:
Plymouth:
12.2% (406)
State:
5.3% (110,239)
Number of households with income $40k - 50k:
Plymouth:
4.6% (152)
State:
5.0% (104,636)
Number of households with income $50k - 60k:
Plymouth:
5.2% (172)
State:
4.8% (99,486)
Number of households with income $60k - 75k:
Plymouth:
9.5% (314)
Massachusetts:
7.5% (155,124)
Number of households with income $75k - 100k:
Plymouth:
14.3% (475)
Massachusetts:
11.4% (236,252)
Number of households with income $100k - 125k:
Plymouth:
13.0% (432)
State:
9.9% (204,731)
Number of households with income $125k - 150k:
Plymouth:
9.0% (298)
State:
8.5% (175,324)
Number of households with income $150k - 200k:
Plymouth:
7.5% (249)
State:
11.7% (242,980)
Number of households with income > $200k:
Plymouth:
9.7% (321)
Massachusetts:
20.5% (425,966)
Aggregate household income in Plymouth in 2022: $341,428,142
Median family income in Plymouth in 2022:
Plymouth:
$119,821
State:
$133,153
Number of families with income $10k - 20k:
Plymouth:
7.5% (107)
State:
2.1% (26,403)
Number of families with income $20k - 30k:
Plymouth:
1.5% (21)
State:
2.6% (32,525)
Number of families with income $30k - 40k:
Plymouth:
6.9% (98)
Massachusetts:
3.9% (48,079)
Number of families with income $40k - 50k:
Plymouth:
5.0% (71)
Massachusetts:
3.8% (46,908)
Number of families with income $50k - 60k:
Plymouth:
2.9% (42)
State:
3.8% (46,476)
Number of families with income $60k - 75k:
Plymouth:
6.3% (89)
State:
6.4% (79,040)
Number of families with income $75k - 100k:
Plymouth:
14.0% (200)
State:
11.1% (137,395)
Number of families with income $100k - 125k:
Plymouth:
17.1% (243)
State:
11.1% (136,771)
Number of families with income $125k - 150k:
Plymouth:
11.6% (164)
Massachusetts:
10.0% (123,709)
Number of families with income $150k - 200k:
Plymouth:
14.0% (199)
Massachusetts:
14.7% (181,602)
Number of families with income > $200k:
Plymouth:
13.2% (188)
State:
28.5% (351,887)
Median non-family income in Plymouth in 2022:
Plymouth:
$61,482
Massachusetts:
$59,323
Change in median non-family income between 2000 and 2022:
Plymouth, Massachusetts:
+103.6%
State:
+94.3%
Median per capita income in Plymouth in 2022:
Plymouth:
$54,474
Massachusetts:
$60,804
Change in median per capita income between 2000 and 2022:
Plymouth, Massachusetts:
+147.4%
State:
+118.7%
Income statistics for Black or African American residents
Median per capita income in Plymouth in 2022:
Plymouth:
$51,505
Massachusetts:
$33,524
Income statistics for Asian residents
Number of households with income < $10k:
Plymouth:
0.0% (0)
Massachusetts:
6.8% (11,982)
Number of households with income $10k - 20k:
Plymouth:
0.0% (0)
Massachusetts:
4.8% (8,376)
Number of households with income $20k - 30k:
Plymouth:
0.0% (0)
State:
3.7% (6,558)
Number of households with income $30k - 40k:
Plymouth:
0.0% (0)
State:
3.3% (5,748)
Number of households with income $40k - 50k:
Plymouth:
0.0% (0)
State:
4.1% (7,192)
Number of households with income $50k - 60k:
Plymouth:
0.0% (0)
Massachusetts:
5.0% (8,734)
Number of households with income $60k - 75k:
Plymouth:
0.0% (0)
State:
5.8% (10,203)
Number of households with income $75k - 100k:
Plymouth:
0.0% (0)
State:
8.6% (15,154)
Number of households with income $100k - 125k:
Plymouth:
0.0% (0)
Massachusetts:
10.8% (18,942)
Number of households with income $125k - 150k:
Plymouth:
0.0% (0)
Massachusetts:
8.0% (14,037)
Number of households with income $150k - 200k:
Plymouth:
0.0% (0)
State:
12.5% (21,856)
Number of households with income > $200k:
Plymouth:
100.0% (15)
Massachusetts:
26.6% (46,694)
Aggregate household income in Plymouth in 2022: $1,172,072
Median per capita income in Plymouth in 2022:
Plymouth:
$78,240
State:
$58,900
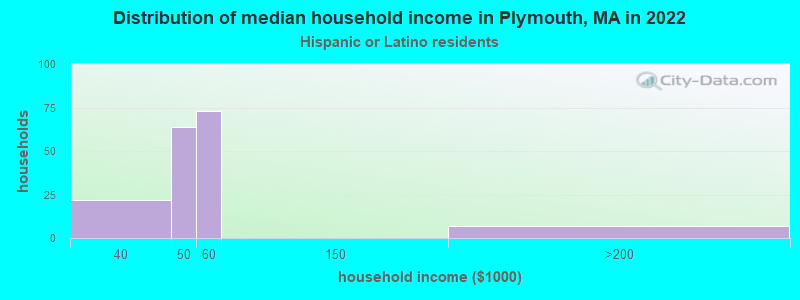
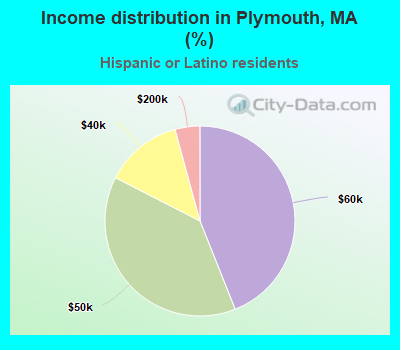
Income statistics for Hispanic or Latino residents
Median household income in Plymouth, MA in 2022:
Plymouth:
$49,437
State:
$61,523
Number of households with income < $10k:
Plymouth:
0.0% (0)
Massachusetts:
8.8% (25,307)
Number of households with income $10k - 20k:
Plymouth:
0.0% (0)
State:
10.0% (28,653)
Number of households with income $20k - 30k:
Plymouth:
0.0% (0)
State:
8.8% (25,189)
Number of households with income $30k - 40k:
Plymouth:
13.3% (22)
State:
7.2% (20,822)
Number of households with income $40k - 50k:
Plymouth:
38.6% (64)
Massachusetts:
7.2% (20,817)
Number of households with income $50k - 60k:
Plymouth:
44.0% (73)
Massachusetts:
6.5% (18,748)
Number of households with income $60k - 75k:
Plymouth:
0.0% (0)
Massachusetts:
8.8% (25,390)
Number of households with income $75k - 100k:
Plymouth:
0.0% (0)
Massachusetts:
12.0% (34,488)
Number of households with income $100k - 125k:
Plymouth:
0.0% (0)
State:
8.6% (24,599)
Number of households with income $125k - 150k:
Plymouth:
0.0% (0)
State:
6.2% (17,743)
Number of households with income $150k - 200k:
Plymouth:
4.2% (7)
Massachusetts:
7.3% (21,017)
Number of households with income > $200k:
Plymouth:
0.0% (0)
Massachusetts:
8.6% (24,606)
Aggregate household income in Plymouth in 2022: $9,002,376
Median per capita income in Plymouth in 2022:
Plymouth:
$43,288
State:
$28,993
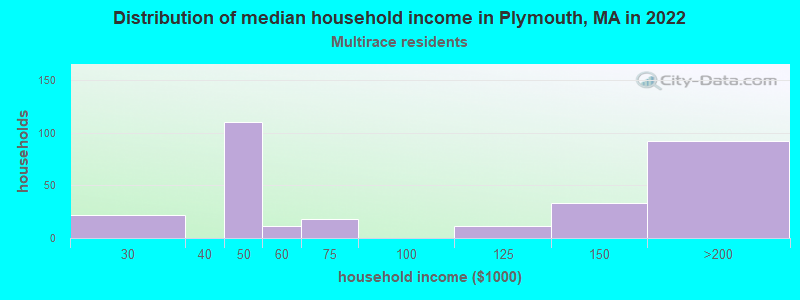
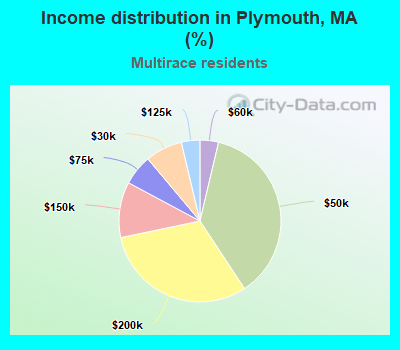
Income statistics for Multirace residents
Number of households with income < $10k:
Plymouth:
0.0% (0)
State:
6.6% (15,127)
Number of households with income $10k - 20k:
Plymouth:
0.0% (0)
State:
9.2% (21,158)
Number of households with income $20k - 30k:
Plymouth:
7.4% (22)
State:
7.8% (18,016)
Number of households with income $30k - 40k:
Plymouth:
0.0% (0)
State:
7.9% (18,260)
Number of households with income $40k - 50k:
Plymouth:
37.0% (110)
Massachusetts:
5.6% (13,027)
Number of households with income $50k - 60k:
Plymouth:
3.7% (11)
Massachusetts:
5.6% (12,909)
Number of households with income $60k - 75k:
Plymouth:
6.1% (18)
Massachusetts:
9.0% (20,800)
Number of households with income $75k - 100k:
Plymouth:
0.0% (0)
State:
12.1% (27,875)
Number of households with income $100k - 125k:
Plymouth:
3.7% (11)
State:
8.1% (18,754)
Number of households with income $125k - 150k:
Plymouth:
11.1% (33)
State:
6.8% (15,621)
Number of households with income $150k - 200k:
Plymouth:
31.0% (92)
State:
9.4% (21,618)
Number of households with income > $200k:
Plymouth:
0.0% (0)
State:
12.0% (27,592)
Aggregate household income in Plymouth in 2022: $24,076,598
Median per capita income in Plymouth in 2022:
Plymouth:
$31,086
State:
$34,029
Change in median per capita income between 2000 and 2022:
Plymouth, Massachusetts:
+69.5%
Massachusetts:
+132.1%
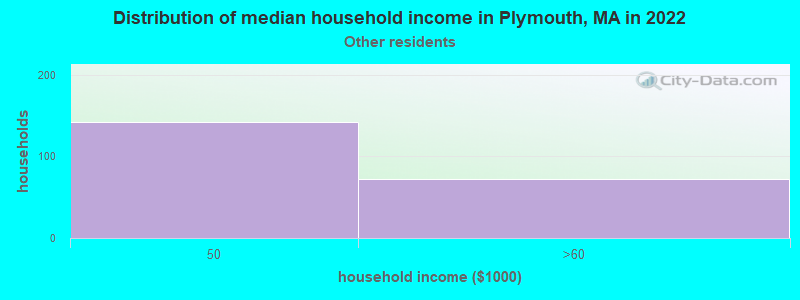
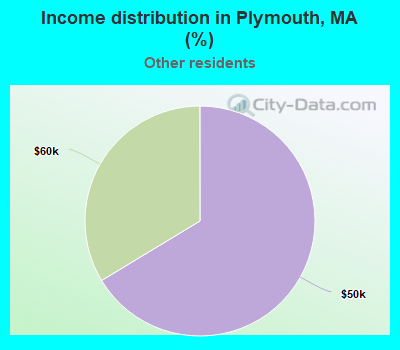
Income statistics for other residents
Number of households with income < $10k:
Plymouth:
0.0% (0)
State:
8.4% (11,559)
Number of households with income $10k - 20k:
Plymouth:
0.0% (0)
Massachusetts:
8.4% (11,499)
Number of households with income $20k - 30k:
Plymouth:
0.0% (0)
State:
9.5% (13,070)
Number of households with income $30k - 40k:
Plymouth:
0.0% (0)
State:
6.0% (8,291)
Number of households with income $40k - 50k:
Plymouth:
66.4% (142)
Massachusetts:
9.2% (12,611)
Number of households with income $50k - 60k:
Plymouth:
33.6% (72)
Massachusetts:
7.9% (10,879)
Number of households with income $60k - 75k:
Plymouth:
0.0% (0)
State:
7.5% (10,239)
Number of households with income $75k - 100k:
Plymouth:
0.0% (0)
State:
13.1% (18,032)
Number of households with income $100k - 125k:
Plymouth:
0.0% (0)
Massachusetts:
9.6% (13,141)
Number of households with income $125k - 150k:
Plymouth:
0.0% (0)
State:
5.0% (6,808)
Number of households with income $150k - 200k:
Plymouth:
0.0% (0)
Massachusetts:
6.4% (8,843)
Number of households with income > $200k:
Plymouth:
0.0% (0)
State:
9.0% (12,396)
Aggregate household income in Plymouth in 2022: $13,388,499
Median per capita income in Plymouth in 2022:
Plymouth:
$22,759
State:
$30,797
Change in median per capita income between 2000 and 2022:: -0.2%
Plymouth, Massachusetts:
-0.2%
State:
+188.5%
Discuss Plymouth, Massachusetts (MA) on our hugely popular Massachusetts forum.