Northeast Wharton, Texas (TX) income map, earnings map, and wages data
The median household income in Northeast Wharton, TX in 2022 was $67,191, which was 7.6% less than the median annual income of $72,284 across the entire state of Texas. Compared to the median income of $36,446 in 2000 this represents an increase of 45.8%. The per capita income in 2022 was $32,831, which means an increase of 48.5% compared to 2000 when it was $16,905.
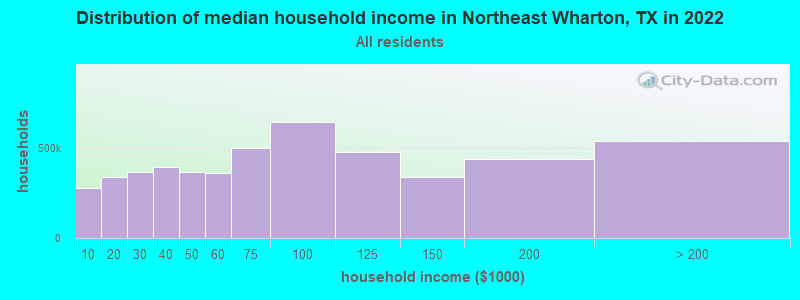
Income statistics for all residents
Median household income in Northeast Wharton, TX in 2022:| Northeast Wharton: | $67,191 |
| Texas: | $72,284 |
Change in median household income between 2000 and 2022:| Northeast Wharton, Texas: | +84.4% |
| State: | +81.0% |
Number of households with income < $10k:| Northeast Wharton: | 5.5% (278,718) |
| State: | 5.5% (611,011) |
Number of households with income $10k - 20k:| Northeast Wharton: | 6.7% (339,173) |
| State: | 6.7% (743,157) |
Number of households with income $20k - 30k:| Northeast Wharton: | 7.2% (366,670) |
| Texas: | 7.2% (803,381) |
Number of households with income $30k - 40k:| Northeast Wharton: | 7.8% (395,242) |
| State: | 7.8% (866,080) |
Number of households with income $40k - 50k:| Northeast Wharton: | 7.3% (369,865) |
| State: | 7.3% (810,440) |
Number of households with income $50k - 60k:| Northeast Wharton: | 7.2% (364,952) |
| State: | 7.2% (799,783) |
Number of households with income $60k - 75k:| Northeast Wharton: | 9.9% (499,865) |
| State: | 9.9% (1,095,384) |
Number of households with income $75k - 100k:| Northeast Wharton: | 12.8% (647,745) |
| State: | 12.8% (1,419,057) |
Number of households with income $100k - 125k:| Northeast Wharton: | 9.5% (481,423) |
| State: | 9.5% (1,054,577) |
Number of households with income $125k - 150k:| Northeast Wharton: | 6.7% (338,593) |
| State: | 6.7% (741,518) |
Number of households with income $150k - 200k:| Northeast Wharton: | 8.7% (438,923) |
| State: | 8.7% (961,776) |
Number of households with income > $200k:| Northeast Wharton: | 10.7% (538,995) |
| Texas: | 10.7% (1,181,544) |
Aggregate household income in Northeast Wharton in 2022: $26,710,556,420
Median family income in Northeast Wharton in 2022:| Northeast Wharton: | $83,329 |
| Texas: | $86,267 |
Median non-family income in Northeast Wharton in 2022:| Northeast Wharton: | $34,939 |
| Texas: | $45,999 |
Change in median non-family income between 2000 and 2022:| Northeast Wharton, Texas: | +85.2% |
| Texas: | +79.5% |
Median per capita income in Northeast Wharton in 2022:| Northeast Wharton: | $32,831 |
| State: | $38,123 |
Change in median per capita income between 2000 and 2022:| Northeast Wharton, Texas: | +94.2% |
| State: | +94.3% |
Income statistics for White residents
Median household income in Northeast Wharton, TX in 2022:| Northeast Wharton: | $82,000 |
| State: | $82,032 |
Change in median household income between 2000 and 2022:| Northeast Wharton, Texas: | +90.4% |
| State: | +91.0% |
Number of households with income < $10k:| Northeast Wharton: | 4.7% (136,844) |
| Texas: | 4.7% (273,716) |
Number of households with income $10k - 20k:| Northeast Wharton: | 5.5% (161,630) |
| State: | 5.5% (322,702) |
Number of households with income $20k - 30k:| Northeast Wharton: | 6.2% (182,388) |
| Texas: | 6.2% (363,947) |
Number of households with income $30k - 40k:| Northeast Wharton: | 6.8% (199,920) |
| Texas: | 6.8% (399,275) |
Number of households with income $40k - 50k:| Northeast Wharton: | 6.5% (191,911) |
| State: | 6.5% (383,417) |
Number of households with income $50k - 60k:| Northeast Wharton: | 6.6% (194,436) |
| Texas: | 6.6% (388,535) |
Number of households with income $60k - 75k:| Northeast Wharton: | 9.6% (283,020) |
| State: | 9.7% (566,295) |
Number of households with income $75k - 100k:| Northeast Wharton: | 13.0% (380,332) |
| State: | 13.0% (760,276) |
Number of households with income $100k - 125k:| Northeast Wharton: | 10.2% (298,956) |
| Texas: | 10.2% (597,596) |
Number of households with income $125k - 150k:| Northeast Wharton: | 7.4% (218,469) |
| State: | 7.4% (436,830) |
Number of households with income $150k - 200k:| Northeast Wharton: | 9.9% (291,374) |
| State: | 9.9% (583,067) |
Number of households with income > $200k:| Northeast Wharton: | 13.5% (395,073) |
| Texas: | 13.5% (792,647) |
Aggregate household income in Northeast Wharton in 2022: $12,123,471,216
Median family income in Northeast Wharton in 2022:| Northeast Wharton: | $98,709 |
| State: | $101,788 |
Number of families with income < $10k:| Northeast Wharton: | 1.9% (20) |
| Texas: | 2.8% (108,142) |
Number of families with income $10k - 20k:| Northeast Wharton: | 2.5% (27) |
| State: | 2.9% (113,421) |
Number of families with income $20k - 30k:| Northeast Wharton: | 4.2% (44) |
| State: | 4.1% (157,688) |
Number of families with income $30k - 40k:| Northeast Wharton: | 4.6% (49) |
| State: | 5.2% (198,847) |
Number of families with income $40k - 50k:| Northeast Wharton: | 10.7% (113) |
| State: | 5.6% (216,490) |
Number of families with income $50k - 60k:| Northeast Wharton: | 5.5% (58) |
| State: | 5.7% (220,689) |
Number of families with income $60k - 75k:| Northeast Wharton: | 12.2% (129) |
| State: | 9.0% (346,106) |
Number of families with income $75k - 100k:| Northeast Wharton: | 13.4% (141) |
| State: | 13.7% (527,363) |
Number of families with income $100k - 125k:| Northeast Wharton: | 20.0% (211) |
| Texas: | 11.6% (448,411) |
Number of families with income $125k - 150k:| Northeast Wharton: | 5.4% (57) |
| Texas: | 9.2% (355,798) |
Number of families with income $150k - 200k:| Northeast Wharton: | 13.2% (139) |
| Texas: | 12.5% (480,185) |
Number of families with income > $200k:| Northeast Wharton: | 6.4% (67) |
| Texas: | 17.6% (677,490) |
Median non-family income in Northeast Wharton in 2022:| Northeast Wharton: | $42,723 |
| Texas: | $50,587 |
Change in median non-family income between 2000 and 2022:| Northeast Wharton, Texas: | +85.8% |
| State: | +87.7% |
Median per capita income in Northeast Wharton in 2022:| Northeast Wharton: | $41,156 |
| Texas: | $47,740 |
Change in median per capita income between 2000 and 2022:| Northeast Wharton, Texas: | +112.1% |
| Texas: | +114.3% |
Income statistics for Black or African American residents
Median household income in Northeast Wharton, TX in 2022:| Northeast Wharton: | $58,632 |
| State: | $55,759 |
Change in median household income between 2000 and 2022:| Northeast Wharton, Texas: | +113.5% |
| Texas: | +90.3% |
Number of households with income < $10k:| Northeast Wharton: | 8.9% (58,987) |
| State: | 8.9% (126,378) |
Number of households with income $10k - 20k:| Northeast Wharton: | 9.9% (65,947) |
| State: | 9.9% (140,369) |
Number of households with income $20k - 30k:| Northeast Wharton: | 8.5% (56,737) |
| State: | 8.5% (120,639) |
Number of households with income $30k - 40k:| Northeast Wharton: | 9.7% (64,148) |
| State: | 9.7% (137,517) |
Number of households with income $40k - 50k:| Northeast Wharton: | 7.9% (52,698) |
| State: | 8.0% (112,973) |
Number of households with income $50k - 60k:| Northeast Wharton: | 8.2% (54,606) |
| Texas: | 8.3% (117,156) |
Number of households with income $60k - 75k:| Northeast Wharton: | 10.4% (68,932) |
| Texas: | 10.4% (147,462) |
Number of households with income $75k - 100k:| Northeast Wharton: | 11.5% (76,112) |
| Texas: | 11.5% (162,718) |
Number of households with income $100k - 125k:| Northeast Wharton: | 8.1% (54,040) |
| Texas: | 8.2% (115,829) |
Number of households with income $125k - 150k:| Northeast Wharton: | 4.9% (32,747) |
| State: | 4.9% (69,556) |
Number of households with income $150k - 200k:| Northeast Wharton: | 6.4% (42,413) |
| Texas: | 6.4% (90,701) |
Number of households with income > $200k:| Northeast Wharton: | 5.5% (36,438) |
| State: | 5.5% (77,988) |
Aggregate household income in Northeast Wharton in 2022: $386,597,452
Median family income in Northeast Wharton in 2022:| Northeast Wharton: | $70,820 |
| State: | $69,134 |
Number of families with income < $10k:| Northeast Wharton: | 1.9% (8) |
| State: | 6.8% (55,625) |
Number of families with income $10k - 20k:| Northeast Wharton: | 9.4% (40) |
| State: | 6.8% (55,300) |
Number of families with income $20k - 30k:| Northeast Wharton: | 12.1% (51) |
| State: | 7.1% (57,877) |
Number of families with income $30k - 40k:| Northeast Wharton: | 6.4% (27) |
| State: | 8.5% (68,776) |
Number of families with income $40k - 50k:| Northeast Wharton: | 15.1% (63) |
| State: | 7.1% (57,907) |
Number of families with income $50k - 60k:| Northeast Wharton: | 8.8% (37) |
| Texas: | 7.3% (59,511) |
Number of families with income $60k - 75k:| Northeast Wharton: | 6.6% (28) |
| State: | 10.1% (81,994) |
Number of families with income $75k - 100k:| Northeast Wharton: | 13.4% (57) |
| Texas: | 12.7% (103,723) |
Number of families with income $150k - 200k:| Northeast Wharton: | 26.2% (110) |
| State: | 9.4% (76,146) |
Median non-family income in Northeast Wharton in 2022:| Northeast Wharton: | $16,154 |
| Texas: | $40,133 |
Change in median non-family income between 2000 and 2022:| Northeast Wharton, Texas: | +133.0% |
| State: | +102.2% |
Median per capita income in Northeast Wharton in 2022:| Northeast Wharton: | $26,614 |
| State: | $30,490 |
Change in median per capita income between 2000 and 2022:| Northeast Wharton, Texas: | +116.3% |
| Texas: | +113.9% |
Income statistics for Asian residents
Number of households with income < $10k:| Northeast Wharton: | 5.2% (9,710) |
| Texas: | 5.2% (29,885) |
Number of households with income $10k - 20k:| Northeast Wharton: | 4.7% (8,786) |
| State: | 4.7% (27,044) |
Number of households with income $20k - 30k:| Northeast Wharton: | 4.1% (7,590) |
| State: | 4.1% (23,363) |
Number of households with income $30k - 40k:| Northeast Wharton: | 4.1% (7,573) |
| Texas: | 4.1% (23,309) |
Number of households with income $40k - 50k:| Northeast Wharton: | 5.2% (9,690) |
| State: | 5.2% (29,826) |
Number of households with income $50k - 60k:| Northeast Wharton: | 4.7% (8,614) |
| State: | 4.7% (26,512) |
Number of households with income $60k - 75k:| Northeast Wharton: | 6.5% (11,990) |
| State: | 6.5% (36,905) |
Number of households with income $75k - 100k:| Northeast Wharton: | 11.3% (20,908) |
| Texas: | 11.3% (64,350) |
Number of households with income $100k - 125k:| Northeast Wharton: | 11.4% (21,026) |
| State: | 11.4% (64,714) |
Number of households with income $125k - 150k:| Northeast Wharton: | 9.3% (17,128) |
| Texas: | 9.3% (52,719) |
Number of households with income $150k - 200k:| Northeast Wharton: | 12.5% (23,053) |
| State: | 12.5% (70,953) |
Number of households with income > $200k:| Northeast Wharton: | 21.1% (39,073) |
| State: | 21.1% (120,260) |
Median per capita income in Northeast Wharton in 2022:| Northeast Wharton: | $30,930 |
| State: | $48,626 |
Change in median per capita income between 2000 and 2022:| Northeast Wharton, Texas: | +127.1% |
| Texas: | +132.0% |
Income statistics for Hispanic or Latino residents
Median household income in Northeast Wharton, TX in 2022:| Northeast Wharton: | $64,250 |
| State: | $60,504 |
Change in median household income between 2000 and 2022:| Northeast Wharton, Texas: | +112.9% |
| State: | +102.5% |
Number of households with income < $10k:| Northeast Wharton: | 5.8% (108,192) |
| Texas: | 5.8% (213,953) |
Number of households with income $10k - 20k:| Northeast Wharton: | 8.0% (150,470) |
| Texas: | 8.0% (297,456) |
Number of households with income $20k - 30k:| Northeast Wharton: | 9.2% (171,921) |
| State: | 9.2% (340,166) |
Number of households with income $30k - 40k:| Northeast Wharton: | 9.5% (179,246) |
| State: | 9.5% (354,336) |
Number of households with income $40k - 50k:| Northeast Wharton: | 8.8% (165,312) |
| State: | 8.8% (327,013) |
Number of households with income $50k - 60k:| Northeast Wharton: | 8.3% (156,022) |
| State: | 8.3% (308,818) |
Number of households with income $60k - 75k:| Northeast Wharton: | 10.9% (204,851) |
| Texas: | 10.9% (405,109) |
Number of households with income $75k - 100k:| Northeast Wharton: | 13.8% (258,835) |
| Texas: | 13.8% (511,639) |
Number of households with income $100k - 125k:| Northeast Wharton: | 8.6% (161,759) |
| State: | 8.6% (319,728) |
Number of households with income $125k - 150k:| Northeast Wharton: | 5.7% (106,808) |
| Texas: | 5.7% (210,932) |
Number of households with income $150k - 200k:| Northeast Wharton: | 6.4% (119,285) |
| State: | 6.4% (236,055) |
Number of households with income > $200k:| Northeast Wharton: | 5.1% (95,769) |
| State: | 5.1% (189,259) |
Aggregate household income in Northeast Wharton in 2022: $635,586,819
Median family income in Northeast Wharton in 2022:| Northeast Wharton: | $71,447 |
| Texas: | $65,080 |
Number of families with income < $10k:| Northeast Wharton: | 5.9% (44) |
| State: | 5.3% (147,493) |
Number of families with income $10k - 20k:| Northeast Wharton: | 6.4% (48) |
| State: | 6.3% (174,531) |
Number of families with income $20k - 30k:| Northeast Wharton: | 10.4% (78) |
| State: | 8.6% (238,528) |
Number of families with income $30k - 40k:| Northeast Wharton: | 7.9% (59) |
| State: | 9.1% (251,999) |
Number of families with income $40k - 50k:| Northeast Wharton: | 14.7% (110) |
| State: | 8.6% (240,188) |
Number of families with income $50k - 60k:| Northeast Wharton: | 6.8% (51) |
| State: | 8.0% (223,566) |
Number of families with income $60k - 75k:| Northeast Wharton: | 11.3% (85) |
| State: | 10.9% (302,688) |
Number of families with income $75k - 100k:| Northeast Wharton: | 12.4% (93) |
| State: | 14.3% (398,554) |
Number of families with income $100k - 125k:| Northeast Wharton: | 13.5% (101) |
| State: | 9.5% (264,007) |
Number of families with income $125k - 150k:| Northeast Wharton: | 3.0% (23) |
| State: | 6.2% (171,274) |
Number of families with income $150k - 200k:| Northeast Wharton: | 5.8% (43) |
| State: | 7.3% (202,259) |
Number of families with income > $200k:| Northeast Wharton: | 1.9% (15) |
| Texas: | 5.9% (165,129) |
Median non-family income in Northeast Wharton in 2022:| Northeast Wharton: | $41,862 |
| State: | $39,934 |
Change in median non-family income between 2000 and 2022:| Northeast Wharton, Texas: | +120.8% |
| Texas: | +109.1% |
Median per capita income in Northeast Wharton in 2022:| Northeast Wharton: | $21,104 |
| State: | $24,862 |
Change in median per capita income between 2000 and 2022:| Northeast Wharton, Texas: | +128.5% |
| Texas: | +130.8% |
Income statistics for Multirace residents
Median household income in Northeast Wharton, TX in 2022:| Northeast Wharton: | $89,897 |
| State: | $62,748 |
Change in median household income between 2000 and 2022:| Northeast Wharton, Texas: | +97.9% |
| State: | +92.3% |
Number of households with income < $10k:| Northeast Wharton: | 5.5% (85,045) |
| State: | 5.5% (122,324) |
Number of households with income $10k - 20k:| Northeast Wharton: | 8.2% (126,698) |
| State: | 8.2% (182,232) |
Number of households with income $20k - 30k:| Northeast Wharton: | 8.5% (131,582) |
| State: | 8.5% (189,456) |
Number of households with income $30k - 40k:| Northeast Wharton: | 8.9% (137,274) |
| State: | 8.9% (197,499) |
Number of households with income $40k - 50k:| Northeast Wharton: | 8.7% (133,339) |
| Texas: | 8.7% (191,735) |
Number of households with income $50k - 60k:| Northeast Wharton: | 8.0% (123,327) |
| State: | 8.0% (177,535) |
Number of households with income $60k - 75k:| Northeast Wharton: | 10.5% (161,646) |
| State: | 10.5% (232,479) |
Number of households with income $75k - 100k:| Northeast Wharton: | 13.1% (201,886) |
| State: | 13.1% (290,448) |
Number of households with income $100k - 125k:| Northeast Wharton: | 8.7% (133,234) |
| State: | 8.6% (191,595) |
Number of households with income $125k - 150k:| Northeast Wharton: | 6.0% (92,801) |
| State: | 6.0% (133,361) |
Number of households with income $150k - 200k:| Northeast Wharton: | 7.2% (110,531) |
| State: | 7.2% (159,195) |
Number of households with income > $200k:| Northeast Wharton: | 6.7% (102,911) |
| Texas: | 6.7% (148,064) |
Aggregate household income in Northeast Wharton in 2022: $323,682,625
Median family income in Northeast Wharton in 2022:| Northeast Wharton: | $56,910 |
| State: | $69,780 |
Number of families with income $10k - 20k:| Northeast Wharton: | 6.8% (47) |
| State: | 5.9% (95,279) |
Number of families with income $20k - 30k:| Northeast Wharton: | 10.6% (74) |
| State: | 7.8% (126,627) |
Number of families with income $75k - 100k:| Northeast Wharton: | 16.4% (114) |
| State: | 14.0% (226,284) |
Number of families with income > $200k:| Northeast Wharton: | 66.2% (459) |
| State: | 7.9% (127,299) |
Median non-family income in Northeast Wharton in 2022:| Northeast Wharton: | $7,243 |
| Texas: | $40,634 |
Change in median non-family income between 2000 and 2022:| Northeast Wharton, Texas: | +93.2% |
| State: | +77.2% |
Median per capita income in Northeast Wharton in 2022:| Northeast Wharton: | $70,446 |
| State: | $26,785 |
Change in median per capita income between 2000 and 2022:| Northeast Wharton, Texas: | +108.4% |
| State: | +110.9% |
Income statistics for other residents
Number of households with income < $10k:| Northeast Wharton: | 5.8% (44) |
| State: | 5.9% (54,162) |
Number of households with income $10k - 20k:| Northeast Wharton: | 6.9% (52) |
| State: | 6.8% (62,891) |
Number of households with income $20k - 30k:| Northeast Wharton: | 10.6% (80) |
| Texas: | 10.6% (97,294) |
Number of households with income $30k - 40k:| Northeast Wharton: | 10.9% (82) |
| Texas: | 10.8% (99,670) |
Number of households with income $40k - 50k:| Northeast Wharton: | 9.4% (71) |
| State: | 9.3% (85,548) |
Number of households with income $50k - 60k:| Northeast Wharton: | 9.0% (68) |
| Texas: | 9.0% (82,757) |
Number of households with income $60k - 75k:| Northeast Wharton: | 10.9% (82) |
| State: | 10.9% (100,326) |
Number of households with income $75k - 100k:| Northeast Wharton: | 14.0% (106) |
| Texas: | 14.0% (128,767) |
Number of households with income $100k - 125k:| Northeast Wharton: | 8.2% (62) |
| State: | 8.2% (75,218) |
Number of households with income $125k - 150k:| Northeast Wharton: | 4.8% (36) |
| State: | 4.8% (44,223) |
Number of households with income $150k - 200k:| Northeast Wharton: | 5.6% (42) |
| State: | 5.6% (51,376) |
Number of households with income > $200k:| Northeast Wharton: | 4.0% (30) |
| Texas: | 4.0% (36,393) |
Aggregate household income in Northeast Wharton in 2022: $55,371,384
Median family income in Northeast Wharton in 2022:| Northeast Wharton: | $55,659 |
| State: | $60,064 |
Number of families with income < $10k:| Northeast Wharton: | 29.2% (28) |
| State: | 6.8% (47,502) |
Number of families with income $10k - 20k:| Northeast Wharton: | 2.4% (2) |
| Texas: | 6.0% (41,763) |
Number of families with income $20k - 30k:| Northeast Wharton: | 20.4% (20) |
| State: | 9.9% (68,761) |
Number of families with income $30k - 40k:| Northeast Wharton: | 29.5% (28) |
| State: | 9.7% (67,685) |
Number of families with income $50k - 60k:| Northeast Wharton: | 9.8% (9) |
| State: | 8.5% (59,321) |
Number of families with income $75k - 100k:| Northeast Wharton: | 8.8% (8) |
| State: | 14.5% (101,032) |
Median non-family income in Northeast Wharton in 2022:| Northeast Wharton: | $45,294 |
| State: | $38,690 |
Change in median non-family income between 2000 and 2022:| Northeast Wharton, Texas: | +123.9% |
| State: | +90.2% |
Median per capita income in Northeast Wharton in 2022:| Northeast Wharton: | $16,419 |
| State: | $23,899 |
Change in median per capita income between 2000 and 2022:| Northeast Wharton, Texas: | +141.8% |
| State: | +135.2% |