North Randall, Texas (TX) income map, earnings map, and wages data
The median household income in North Randall, TX in 2022 was $80,202, which was 9.9% greater than the median annual income of $72,284 across the entire state of Texas. Compared to the median income of $44,637 in 2000 this represents an increase of 44.3%. The per capita income in 2022 was $33,705, which means an increase of 44.7% compared to 2000 when it was $18,634.
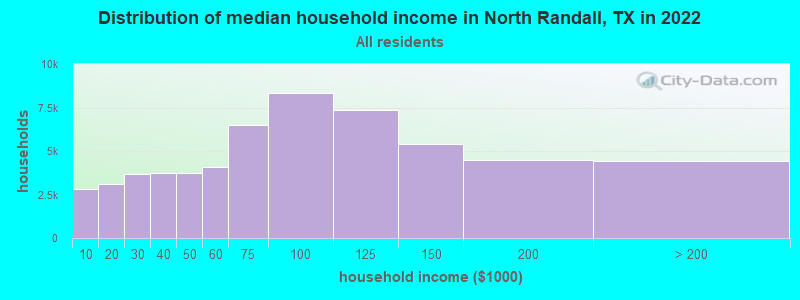
Income statistics for all residents
Median household income in North Randall, TX in 2022:| North Randall: | $80,203 |
| State: | $72,284 |
Change in median household income between 2000 and 2022:| North Randall, Texas: | +79.7% |
| State: | +81.0% |
Number of households with income < $10k:| North Randall: | 4.8% (2,797) |
| State: | 5.5% (611,011) |
Number of households with income $10k - 20k:| North Randall: | 5.4% (3,108) |
| State: | 6.7% (743,157) |
Number of households with income $20k - 30k:| North Randall: | 6.3% (3,659) |
| State: | 7.2% (803,381) |
Number of households with income $30k - 40k:| North Randall: | 6.5% (3,761) |
| Texas: | 7.8% (866,080) |
Number of households with income $40k - 50k:| North Randall: | 6.5% (3,764) |
| State: | 7.3% (810,440) |
Number of households with income $50k - 60k:| North Randall: | 7.1% (4,108) |
| State: | 7.2% (799,783) |
Number of households with income $60k - 75k:| North Randall: | 11.3% (6,503) |
| State: | 9.9% (1,095,384) |
Number of households with income $75k - 100k:| North Randall: | 14.4% (8,310) |
| State: | 12.8% (1,419,057) |
Number of households with income $100k - 125k:| North Randall: | 12.8% (7,375) |
| State: | 9.5% (1,054,577) |
Number of households with income $125k - 150k:| North Randall: | 9.3% (5,386) |
| State: | 6.7% (741,518) |
Number of households with income $150k - 200k:| North Randall: | 7.8% (4,504) |
| State: | 8.7% (961,776) |
Number of households with income > $200k:| North Randall: | 7.6% (4,398) |
| State: | 10.7% (1,181,544) |
Aggregate household income in North Randall in 2022: $652,647,446
Median family income in North Randall in 2022:| North Randall: | $91,276 |
| State: | $86,267 |
Median non-family income in North Randall in 2022:| North Randall: | $58,295 |
| State: | $45,999 |
Change in median non-family income between 2000 and 2022:| North Randall, Texas: | +101.2% |
| State: | +79.5% |
Median per capita income in North Randall in 2022:| North Randall: | $33,706 |
| Texas: | $38,123 |
Change in median per capita income between 2000 and 2022:| North Randall, Texas: | +80.9% |
| State: | +94.3% |
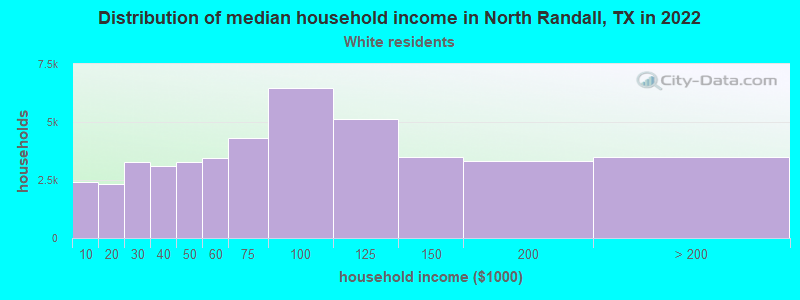
Income statistics for White residents
Median household income in North Randall, TX in 2022:| North Randall: | $74,879 |
| Texas: | $82,032 |
Change in median household income between 2000 and 2022:| North Randall, Texas: | +68.6% |
| State: | +91.0% |
Number of households with income < $10k:| North Randall: | 5.5% (2,420) |
| State: | 4.7% (273,716) |
Number of households with income $10k - 20k:| North Randall: | 5.3% (2,322) |
| State: | 5.5% (322,702) |
Number of households with income $20k - 30k:| North Randall: | 7.4% (3,259) |
| State: | 6.2% (363,947) |
Number of households with income $30k - 40k:| North Randall: | 7.1% (3,111) |
| State: | 6.8% (399,275) |
Number of households with income $40k - 50k:| North Randall: | 7.5% (3,295) |
| State: | 6.5% (383,417) |
Number of households with income $50k - 60k:| North Randall: | 7.9% (3,460) |
| State: | 6.6% (388,535) |
Number of households with income $60k - 75k:| North Randall: | 9.8% (4,306) |
| State: | 9.7% (566,295) |
Number of households with income $75k - 100k:| North Randall: | 14.7% (6,461) |
| State: | 13.0% (760,276) |
Number of households with income $100k - 125k:| North Randall: | 11.6% (5,121) |
| State: | 10.2% (597,596) |
Number of households with income $125k - 150k:| North Randall: | 7.9% (3,480) |
| State: | 7.4% (436,830) |
Number of households with income $150k - 200k:| North Randall: | 7.5% (3,313) |
| State: | 9.9% (583,067) |
Number of households with income > $200k:| North Randall: | 7.9% (3,492) |
| State: | 13.5% (792,647) |
Aggregate household income in North Randall in 2022: $479,168,095
Median family income in North Randall in 2022:| North Randall: | $84,476 |
| Texas: | $101,788 |
Number of families with income < $10k:| North Randall: | 4.4% (153) |
| State: | 2.8% (108,142) |
Number of families with income $10k - 20k:| North Randall: | 3.3% (117) |
| Texas: | 2.9% (113,421) |
Number of families with income $20k - 30k:| North Randall: | 8.0% (281) |
| State: | 4.1% (157,688) |
Number of families with income $30k - 40k:| North Randall: | 6.8% (238) |
| State: | 5.2% (198,847) |
Number of families with income $40k - 50k:| North Randall: | 6.3% (221) |
| Texas: | 5.6% (216,490) |
Number of families with income $50k - 60k:| North Randall: | 7.8% (273) |
| State: | 5.7% (220,689) |
Number of families with income $60k - 75k:| North Randall: | 9.5% (334) |
| State: | 9.0% (346,106) |
Number of families with income $75k - 100k:| North Randall: | 13.0% (455) |
| State: | 13.7% (527,363) |
Number of families with income $100k - 125k:| North Randall: | 10.3% (360) |
| State: | 11.6% (448,411) |
Number of families with income $125k - 150k:| North Randall: | 10.2% (358) |
| State: | 9.2% (355,798) |
Number of families with income $150k - 200k:| North Randall: | 11.1% (390) |
| Texas: | 12.5% (480,185) |
Number of families with income > $200k:| North Randall: | 9.1% (320) |
| Texas: | 17.6% (677,490) |
Median non-family income in North Randall in 2022:| North Randall: | $57,916 |
| State: | $50,587 |
Change in median non-family income between 2000 and 2022:| North Randall, Texas: | +94.0% |
| Texas: | +87.7% |
Median per capita income in North Randall in 2022:| North Randall: | $35,717 |
| Texas: | $47,740 |
Change in median per capita income between 2000 and 2022:| North Randall, Texas: | +88.8% |
| State: | +114.3% |
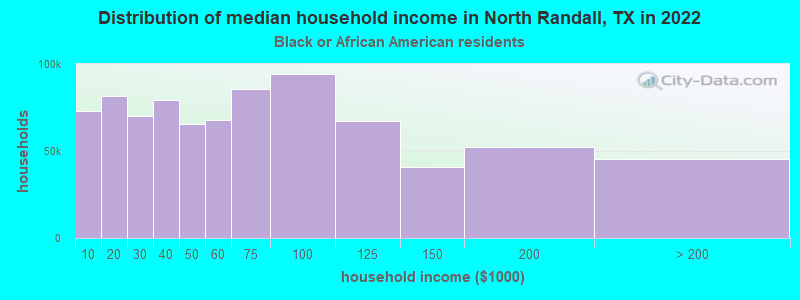
Income statistics for Black or African American residents
Median household income in North Randall, TX in 2022:| North Randall: | $81,910 |
| State: | $55,759 |
Change in median household income between 2000 and 2022:| North Randall, Texas: | +140.7% |
| Texas: | +90.3% |
Number of households with income < $10k:| North Randall: | 8.9% (73,104) |
| State: | 8.9% (126,378) |
Number of households with income $10k - 20k:| North Randall: | 9.9% (81,730) |
| State: | 9.9% (140,369) |
Number of households with income $20k - 30k:| North Randall: | 8.5% (70,316) |
| State: | 8.5% (120,639) |
Number of households with income $30k - 40k:| North Randall: | 9.7% (79,500) |
| State: | 9.7% (137,517) |
Number of households with income $40k - 50k:| North Randall: | 7.9% (65,311) |
| State: | 8.0% (112,973) |
Number of households with income $50k - 60k:| North Randall: | 8.2% (67,674) |
| Texas: | 8.3% (117,156) |
Number of households with income $60k - 75k:| North Randall: | 10.4% (85,429) |
| State: | 10.4% (147,462) |
Number of households with income $75k - 100k:| North Randall: | 11.5% (94,327) |
| State: | 11.5% (162,718) |
Number of households with income $100k - 125k:| North Randall: | 8.1% (66,973) |
| State: | 8.2% (115,829) |
Number of households with income $125k - 150k:| North Randall: | 4.9% (40,584) |
| State: | 4.9% (69,556) |
Number of households with income $150k - 200k:| North Randall: | 6.4% (52,564) |
| State: | 6.4% (90,701) |
Number of households with income > $200k:| North Randall: | 5.5% (45,159) |
| State: | 5.5% (77,988) |
Aggregate household income in North Randall in 2022: $1,921,766
Median family income in North Randall in 2022:| North Randall: | $62,917 |
| State: | $69,134 |
Median per capita income in North Randall in 2022:| North Randall: | $18,079 |
| State: | $30,490 |
Change in median per capita income between 2000 and 2022:| North Randall, Texas: | +84.0% |
| State: | +113.9% |
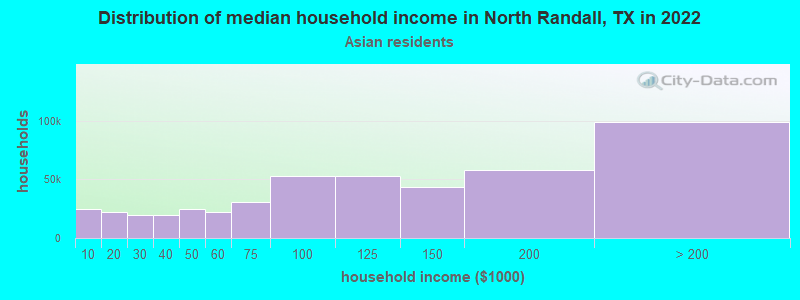
Income statistics for Asian residents
Median household income in North Randall, TX in 2022:| North Randall: | $281,335 |
| State: | $107,673 |
Number of households with income < $10k:| North Randall: | 5.3% (24,621) |
| Texas: | 5.2% (29,885) |
Number of households with income $10k - 20k:| North Randall: | 4.8% (22,278) |
| State: | 4.7% (27,044) |
Number of households with income $20k - 30k:| North Randall: | 4.1% (19,200) |
| Texas: | 4.1% (23,363) |
Number of households with income $30k - 40k:| North Randall: | 4.1% (19,194) |
| State: | 4.1% (23,309) |
Number of households with income $40k - 50k:| North Randall: | 5.2% (24,538) |
| State: | 5.2% (29,826) |
Number of households with income $50k - 60k:| North Randall: | 4.6% (21,766) |
| State: | 4.7% (26,512) |
Number of households with income $60k - 75k:| North Randall: | 6.5% (30,399) |
| State: | 6.5% (36,905) |
Number of households with income $75k - 100k:| North Randall: | 11.3% (52,862) |
| Texas: | 11.3% (64,350) |
Number of households with income $100k - 125k:| North Randall: | 11.3% (53,199) |
| State: | 11.4% (64,714) |
Number of households with income $125k - 150k:| North Randall: | 9.3% (43,370) |
| State: | 9.3% (52,719) |
Number of households with income $150k - 200k:| North Randall: | 12.5% (58,381) |
| State: | 12.5% (70,953) |
Number of households with income > $200k:| North Randall: | 21.1% (98,944) |
| Texas: | 21.1% (120,260) |
Aggregate household income in North Randall in 2022: $11,137,891
Median family income in North Randall in 2022:| North Randall: | $475,681 |
| State: | $123,328 |
Number of families with income < $10k:| North Randall: | 3.0% (4) |
| Texas: | 3.1% (13,567) |
Number of families with income $75k - 100k:| North Randall: | 5.9% (7) |
| State: | 10.7% (46,626) |
Number of families with income $150k - 200k:| North Randall: | 91.1% (116) |
| State: | 14.7% (64,203) |
Median per capita income in North Randall in 2022:| North Randall: | $76,373 |
| State: | $48,626 |
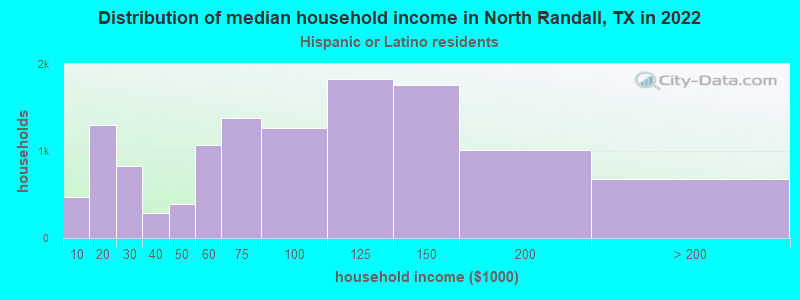
Income statistics for Hispanic or Latino residents
Median household income in North Randall, TX in 2022:| North Randall: | $100,332 |
| State: | $60,504 |
Change in median household income between 2000 and 2022:| North Randall, Texas: | +138.4% |
| State: | +102.5% |
Number of households with income < $10k:| North Randall: | 3.9% (474) |
| Texas: | 5.8% (213,953) |
Number of households with income $10k - 20k:| North Randall: | 10.6% (1,295) |
| State: | 8.0% (297,456) |
Number of households with income $20k - 30k:| North Randall: | 6.8% (829) |
| Texas: | 9.2% (340,166) |
Number of households with income $30k - 40k:| North Randall: | 2.4% (288) |
| State: | 9.5% (354,336) |
Number of households with income $40k - 50k:| North Randall: | 3.2% (391) |
| State: | 8.8% (327,013) |
Number of households with income $50k - 60k:| North Randall: | 8.7% (1,067) |
| State: | 8.3% (308,818) |
Number of households with income $60k - 75k:| North Randall: | 11.3% (1,382) |
| Texas: | 10.9% (405,109) |
Number of households with income $75k - 100k:| North Randall: | 10.3% (1,261) |
| State: | 13.8% (511,639) |
Number of households with income $100k - 125k:| North Randall: | 14.9% (1,827) |
| State: | 8.6% (319,728) |
Number of households with income $125k - 150k:| North Randall: | 14.3% (1,754) |
| Texas: | 5.7% (210,932) |
Number of households with income $150k - 200k:| North Randall: | 8.2% (1,009) |
| State: | 6.4% (236,055) |
Number of households with income > $200k:| North Randall: | 5.5% (675) |
| State: | 5.1% (189,259) |
Aggregate household income in North Randall in 2022: $92,420,042
Median family income in North Randall in 2022:| North Randall: | $146,836 |
| State: | $65,080 |
Number of families with income < $10k:| North Randall: | 2.3% (22) |
| State: | 5.3% (147,493) |
Number of families with income $10k - 20k:| North Randall: | 14.5% (140) |
| State: | 6.3% (174,531) |
Number of families with income $20k - 30k:| North Randall: | 8.2% (80) |
| State: | 8.6% (238,528) |
Number of families with income $30k - 40k:| North Randall: | 0.8% (8) |
| Texas: | 9.1% (251,999) |
Number of families with income $40k - 50k:| North Randall: | 4.2% (41) |
| Texas: | 8.6% (240,188) |
Number of families with income $50k - 60k:| North Randall: | 9.3% (90) |
| State: | 8.0% (223,566) |
Number of families with income $60k - 75k:| North Randall: | 2.9% (28) |
| State: | 10.9% (302,688) |
Number of families with income $75k - 100k:| North Randall: | 14.8% (143) |
| Texas: | 14.3% (398,554) |
Number of families with income $100k - 125k:| North Randall: | 12.9% (125) |
| State: | 9.5% (264,007) |
Number of families with income $125k - 150k:| North Randall: | 16.5% (159) |
| Texas: | 6.2% (171,274) |
Number of families with income $150k - 200k:| North Randall: | 7.9% (77) |
| State: | 7.3% (202,259) |
Number of families with income > $200k:| North Randall: | 5.7% (55) |
| Texas: | 5.9% (165,129) |
Median non-family income in North Randall in 2022:| North Randall: | $27,775 |
| State: | $39,934 |
Median per capita income in North Randall in 2022:| North Randall: | $26,262 |
| State: | $24,862 |
Change in median per capita income between 2000 and 2022:| North Randall, Texas: | +128.6% |
| Texas: | +130.8% |
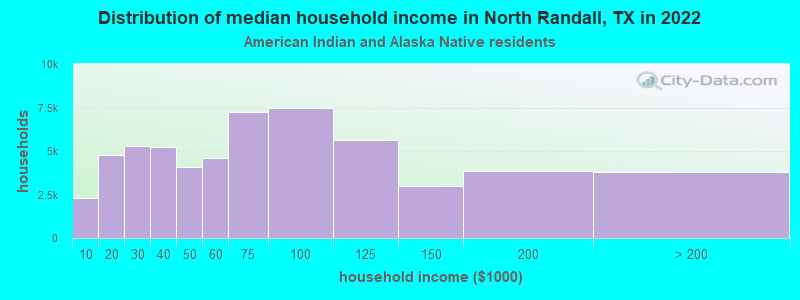
Income statistics for American Indian and Alaska Native residents
Median household income in North Randall, TX in 2022:| North Randall: | $83,983 |
| State: | $65,765 |
Change in median household income between 2000 and 2022:| North Randall, Texas: | +76.2% |
| Texas: | +88.3% |
Number of households with income < $10k:| North Randall: | 4.1% (2,323) |
| State: | 4.1% (3,398) |
Number of households with income $10k - 20k:| North Randall: | 8.3% (4,749) |
| State: | 8.3% (6,949) |
Number of households with income $20k - 30k:| North Randall: | 9.3% (5,293) |
| Texas: | 9.3% (7,742) |
Number of households with income $30k - 40k:| North Randall: | 9.1% (5,208) |
| State: | 9.1% (7,627) |
Number of households with income $40k - 50k:| North Randall: | 7.1% (4,052) |
| State: | 7.1% (5,922) |
Number of households with income $50k - 60k:| North Randall: | 8.1% (4,623) |
| State: | 8.1% (6,761) |
Number of households with income $60k - 75k:| North Randall: | 12.7% (7,235) |
| State: | 12.7% (10,588) |
Number of households with income $75k - 100k:| North Randall: | 13.0% (7,455) |
| Texas: | 13.0% (10,903) |
Number of households with income $100k - 125k:| North Randall: | 9.9% (5,644) |
| Texas: | 9.9% (8,256) |
Number of households with income $125k - 150k:| North Randall: | 5.2% (2,975) |
| Texas: | 5.2% (4,355) |
Number of households with income $150k - 200k:| North Randall: | 6.7% (3,840) |
| State: | 6.7% (5,623) |
Number of households with income > $200k:| North Randall: | 6.6% (3,770) |
| Texas: | 6.6% (5,522) |
Aggregate household income in North Randall in 2022: $6,186,061
Median family income in North Randall in 2022:| North Randall: | $92,166 |
| Texas: | $72,369 |
Number of families with income < $10k:| North Randall: | 13.4% (3) |
| State: | 2.7% (1,671) |
Number of families with income $40k - 50k:| North Randall: | 16.2% (4) |
| Texas: | 7.9% (4,855) |
Number of families with income $75k - 100k:| North Randall: | 70.3% (17) |
| Texas: | 14.4% (8,852) |
Median per capita income in North Randall in 2022:| North Randall: | $25,086 |
| State: | $28,166 |
Change in median per capita income between 2000 and 2022:| North Randall, Texas: | +95.5% |
| State: | +77.2% |
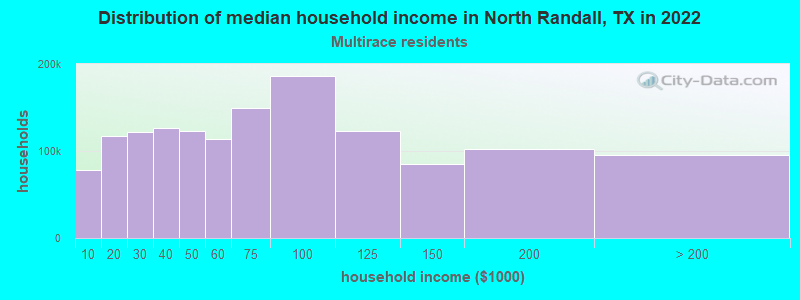
Income statistics for Multirace residents
Median household income in North Randall, TX in 2022:| North Randall: | $153,577 |
| State: | $62,748 |
Number of households with income < $10k:| North Randall: | 5.5% (78,412) |
| State: | 5.5% (122,324) |
Number of households with income $10k - 20k:| North Randall: | 8.2% (116,816) |
| State: | 8.2% (182,232) |
Number of households with income $20k - 30k:| North Randall: | 8.5% (121,321) |
| Texas: | 8.5% (189,456) |
Number of households with income $30k - 40k:| North Randall: | 8.9% (126,569) |
| Texas: | 8.9% (197,499) |
Number of households with income $40k - 50k:| North Randall: | 8.7% (122,940) |
| State: | 8.7% (191,735) |
Number of households with income $50k - 60k:| North Randall: | 8.0% (113,709) |
| State: | 8.0% (177,535) |
Number of households with income $60k - 75k:| North Randall: | 10.5% (149,039) |
| State: | 10.5% (232,479) |
Number of households with income $75k - 100k:| North Randall: | 13.1% (186,141) |
| State: | 13.1% (290,448) |
Number of households with income $100k - 125k:| North Randall: | 8.7% (122,843) |
| State: | 8.6% (191,595) |
Number of households with income $125k - 150k:| North Randall: | 6.0% (85,564) |
| State: | 6.0% (133,361) |
Number of households with income $150k - 200k:| North Randall: | 7.2% (101,911) |
| State: | 7.2% (159,195) |
Number of households with income > $200k:| North Randall: | 6.7% (94,885) |
| State: | 6.7% (148,064) |
Aggregate household income in North Randall in 2022: $110,975,680
Median family income in North Randall in 2022:| North Randall: | $109,611 |
| State: | $69,780 |
Number of families with income $20k - 30k:| North Randall: | 4.7% (51) |
| State: | 7.8% (126,627) |
Number of families with income $40k - 50k:| North Randall: | 20.3% (222) |
| State: | 8.4% (135,809) |
Number of families with income $60k - 75k:| North Randall: | 14.2% (156) |
| Texas: | 10.5% (169,549) |
Number of families with income $100k - 125k:| North Randall: | 46.1% (506) |
| Texas: | 9.5% (153,597) |
Number of families with income $150k - 200k:| North Randall: | 14.7% (161) |
| State: | 8.5% (137,607) |
Median non-family income in North Randall in 2022:| North Randall: | $76,063 |
| Texas: | $40,634 |
Median per capita income in North Randall in 2022:| North Randall: | $30,354 |
| Texas: | $26,785 |
Income statistics for other residents
Number of households with income < $10k:| North Randall: | 5.9% (106) |
| State: | 5.9% (54,162) |
Number of households with income $10k - 20k:| North Randall: | 6.9% (124) |
| State: | 6.8% (62,891) |
Number of households with income $20k - 30k:| North Randall: | 10.6% (191) |
| Texas: | 10.6% (97,294) |
Number of households with income $30k - 40k:| North Randall: | 10.9% (196) |
| State: | 10.8% (99,670) |
Number of households with income $40k - 50k:| North Randall: | 9.3% (168) |
| State: | 9.3% (85,548) |
Number of households with income $50k - 60k:| North Randall: | 9.0% (163) |
| Texas: | 9.0% (82,757) |
Number of households with income $60k - 75k:| North Randall: | 10.9% (197) |
| State: | 10.9% (100,326) |
Number of households with income $75k - 100k:| North Randall: | 14.0% (253) |
| State: | 14.0% (128,767) |
Number of households with income $100k - 125k:| North Randall: | 8.2% (148) |
| State: | 8.2% (75,218) |
Number of households with income $125k - 150k:| North Randall: | 4.8% (87) |
| Texas: | 4.8% (44,223) |
Number of households with income $150k - 200k:| North Randall: | 5.6% (101) |
| State: | 5.6% (51,376) |
Number of households with income > $200k:| North Randall: | 4.0% (72) |
| State: | 4.0% (36,393) |
Aggregate household income in North Randall in 2022: $34,394,370
Median family income in North Randall in 2022:| North Randall: | $286,829 |
| Texas: | $60,064 |
Number of families with income $10k - 20k:| North Randall: | 1.1% (4) |
| State: | 6.0% (41,763) |
Number of families with income $20k - 30k:| North Randall: | 0.3% (1) |
| State: | 9.9% (68,761) |
Number of families with income $40k - 50k:| North Randall: | 3.0% (12) |
| Texas: | 9.0% (62,441) |
Number of families with income $60k - 75k:| North Randall: | 11.5% (47) |
| Texas: | 11.2% (77,588) |
Number of families with income $75k - 100k:| North Randall: | 57.1% (232) |
| State: | 14.5% (101,032) |
Number of families with income $125k - 150k:| North Randall: | 27.0% (109) |
| Texas: | 5.1% (35,727) |
Median non-family income in North Randall in 2022:| North Randall: | $30,129 |
| Texas: | $38,690 |
Median per capita income in North Randall in 2022:| North Randall: | $42,135 |
| Texas: | $23,899 |