North Coastal, California (CA) income map, earnings map, and wages data
The median household income in North Coastal, CA in 2022 was $69,025, which was 32.6% less than the median annual income of $91,551 across the entire state of California. Compared to the median income of $37,237 in 2000 this represents an increase of 46.1%. The per capita income in 2022 was $39,118, which means an increase of 52.1% compared to 2000 when it was $18,754.
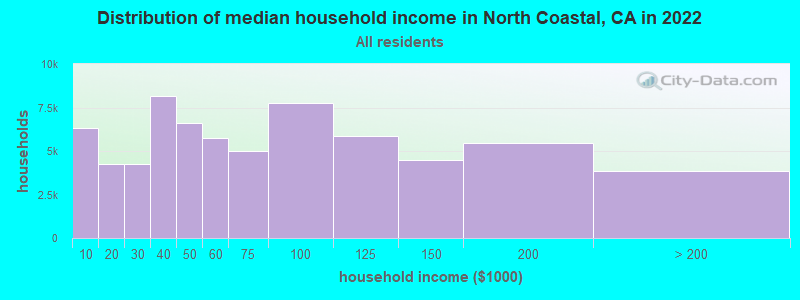
Income statistics for all residents
Median household income in North Coastal, CA in 2022:| North Coastal: | $69,025 |
| State: | $91,551 |
Change in median household income between 2000 and 2022:| North Coastal, California: | +85.4% |
| State: | +92.8% |
Number of households with income < $10k:| North Coastal: | 9.4% (6,348) |
| State: | 4.8% (654,370) |
Number of households with income $10k - 20k:| North Coastal: | 6.3% (4,240) |
| California: | 5.8% (789,493) |
Number of households with income $20k - 30k:| North Coastal: | 6.3% (4,241) |
| State: | 5.7% (778,318) |
Number of households with income $30k - 40k:| North Coastal: | 12.1% (8,162) |
| State: | 5.8% (783,170) |
Number of households with income $40k - 50k:| North Coastal: | 9.8% (6,636) |
| State: | 5.8% (781,352) |
Number of households with income $50k - 60k:| North Coastal: | 8.5% (5,765) |
| State: | 5.6% (760,175) |
Number of households with income $60k - 75k:| North Coastal: | 7.4% (4,986) |
| State: | 8.2% (1,104,699) |
Number of households with income $75k - 100k:| North Coastal: | 11.4% (7,732) |
| State: | 12.0% (1,627,633) |
Number of households with income $100k - 125k:| North Coastal: | 8.6% (5,846) |
| State: | 10.0% (1,358,619) |
Number of households with income $125k - 150k:| North Coastal: | 6.6% (4,487) |
| State: | 7.6% (1,027,455) |
Number of households with income $150k - 200k:| North Coastal: | 8.0% (5,434) |
| State: | 10.6% (1,439,811) |
Number of households with income > $200k:| North Coastal: | 5.7% (3,841) |
| State: | 18.0% (2,445,491) |
Aggregate household income in North Coastal in 2022: $831,981,370
Median family income in North Coastal in 2022:| North Coastal: | $90,538 |
| State: | $104,823 |
Median non-family income in North Coastal in 2022:| North Coastal: | $43,144 |
| State: | $59,348 |
Change in median non-family income between 2000 and 2022:| North Coastal, California: | +92.1% |
| California: | +85.3% |
Median per capita income in North Coastal in 2022:| North Coastal: | $39,118 |
| State: | $46,661 |
Change in median per capita income between 2000 and 2022:| North Coastal, California: | +108.6% |
| State: | +105.5% |
Income statistics for White residents
Median household income in North Coastal, CA in 2022:| North Coastal: | $68,144 |
| State: | $100,917 |
Change in median household income between 2000 and 2022:| North Coastal, California: | +81.5% |
| California: | +96.8% |
Number of households with income < $10k:| North Coastal: | 9.7% (5,242) |
| State: | 4.4% (284,109) |
Number of households with income $10k - 20k:| North Coastal: | 5.8% (3,104) |
| State: | 5.3% (340,330) |
Number of households with income $20k - 30k:| North Coastal: | 6.5% (3,484) |
| State: | 5.3% (343,145) |
Number of households with income $30k - 40k:| North Coastal: | 12.6% (6,812) |
| State: | 5.1% (330,146) |
Number of households with income $40k - 50k:| North Coastal: | 8.7% (4,720) |
| State: | 5.2% (335,310) |
Number of households with income $50k - 60k:| North Coastal: | 9.1% (4,928) |
| State: | 5.1% (326,299) |
Number of households with income $60k - 75k:| North Coastal: | 7.3% (3,967) |
| State: | 7.6% (487,640) |
Number of households with income $75k - 100k:| North Coastal: | 11.7% (6,320) |
| State: | 11.5% (736,578) |
Number of households with income $100k - 125k:| North Coastal: | 7.8% (4,211) |
| California: | 10.1% (648,782) |
Number of households with income $125k - 150k:| North Coastal: | 7.5% (4,060) |
| California: | 7.8% (499,671) |
Number of households with income $150k - 200k:| North Coastal: | 7.6% (4,120) |
| State: | 11.4% (729,603) |
Number of households with income > $200k:| North Coastal: | 5.6% (3,009) |
| California: | 21.2% (1,364,246) |
Aggregate household income in North Coastal in 2022: $664,219,167
Median family income in North Coastal in 2022:| North Coastal: | $88,055 |
| State: | $125,379 |
Number of families with income < $10k:| North Coastal: | 3.8% (170) |
| State: | 2.2% (87,079) |
Number of families with income $10k - 20k:| North Coastal: | 2.7% (122) |
| State: | 2.5% (97,716) |
Number of families with income $20k - 30k:| North Coastal: | 3.3% (146) |
| State: | 3.5% (137,295) |
Number of families with income $30k - 40k:| North Coastal: | 7.8% (349) |
| California: | 3.9% (152,947) |
Number of families with income $40k - 50k:| North Coastal: | 8.7% (391) |
| State: | 4.3% (169,197) |
Number of families with income $50k - 60k:| North Coastal: | 10.7% (478) |
| State: | 4.5% (176,192) |
Number of families with income $60k - 75k:| North Coastal: | 7.5% (338) |
| State: | 7.0% (274,752) |
Number of families with income $75k - 100k:| North Coastal: | 14.3% (639) |
| State: | 11.3% (445,632) |
Number of families with income $100k - 125k:| North Coastal: | 13.0% (584) |
| California: | 10.7% (423,630) |
Number of families with income $125k - 150k:| North Coastal: | 9.6% (431) |
| State: | 9.1% (357,408) |
Number of families with income $150k - 200k:| North Coastal: | 10.2% (458) |
| State: | 13.5% (532,693) |
Number of families with income > $200k:| North Coastal: | 8.4% (376) |
| California: | 27.6% (1,086,948) |
Median non-family income in North Coastal in 2022:| North Coastal: | $42,526 |
| State: | $62,819 |
Change in median non-family income between 2000 and 2022:| North Coastal, California: | +87.1% |
| California: | +84.4% |
Median per capita income in North Coastal in 2022:| North Coastal: | $40,140 |
| State: | $61,706 |
Change in median per capita income between 2000 and 2022:| North Coastal, California: | +107.7% |
| State: | +122.7% |
Income statistics for Black or African American residents
Median household income in North Coastal, CA in 2022:| North Coastal: | $95,305 |
| California: | $63,268 |
Number of households with income < $10k:| North Coastal: | 9.0% (17,883) |
| State: | 9.0% (73,219) |
Number of households with income $10k - 20k:| North Coastal: | 10.6% (21,167) |
| California: | 10.6% (86,666) |
Number of households with income $20k - 30k:| North Coastal: | 7.1% (14,094) |
| State: | 7.1% (57,719) |
Number of households with income $30k - 40k:| North Coastal: | 7.2% (14,351) |
| State: | 7.2% (58,714) |
Number of households with income $40k - 50k:| North Coastal: | 7.1% (14,176) |
| State: | 7.1% (58,075) |
Number of households with income $50k - 60k:| North Coastal: | 6.8% (13,502) |
| State: | 6.8% (55,229) |
Number of households with income $60k - 75k:| North Coastal: | 8.8% (17,546) |
| State: | 8.8% (71,895) |
Number of households with income $75k - 100k:| North Coastal: | 11.9% (23,662) |
| State: | 11.9% (96,893) |
Number of households with income $100k - 125k:| North Coastal: | 8.7% (17,258) |
| California: | 8.7% (70,729) |
Number of households with income $125k - 150k:| North Coastal: | 6.3% (12,513) |
| California: | 6.3% (51,211) |
Number of households with income $150k - 200k:| North Coastal: | 7.2% (14,334) |
| State: | 7.2% (58,687) |
Number of households with income > $200k:| North Coastal: | 9.3% (18,423) |
| State: | 9.3% (75,487) |
Aggregate household income in North Coastal in 2022: $2,305,802
Median non-family income in North Coastal in 2022:| North Coastal: | $65,809 |
| California: | $41,942 |
Median per capita income in North Coastal in 2022:| North Coastal: | $50,103 |
| California: | $36,708 |
Income statistics for Asian residents
Median household income in North Coastal, CA in 2022:| North Coastal: | $86,944 |
| California: | $119,861 |
Change in median household income between 2000 and 2022:| North Coastal, California: | +119.6% |
| State: | +116.5% |
Number of households with income < $10k:| North Coastal: | 5.1% (37,979) |
| California: | 5.1% (106,273) |
Number of households with income $10k - 20k:| North Coastal: | 4.9% (36,403) |
| California: | 4.9% (101,815) |
Number of households with income $20k - 30k:| North Coastal: | 4.6% (33,742) |
| State: | 4.6% (94,414) |
Number of households with income $30k - 40k:| North Coastal: | 4.1% (30,203) |
| State: | 4.1% (84,491) |
Number of households with income $40k - 50k:| North Coastal: | 4.0% (29,221) |
| State: | 4.0% (81,758) |
Number of households with income $50k - 60k:| North Coastal: | 3.9% (28,927) |
| California: | 3.9% (80,971) |
Number of households with income $60k - 75k:| North Coastal: | 6.0% (44,381) |
| State: | 6.0% (124,194) |
Number of households with income $75k - 100k:| North Coastal: | 9.7% (71,627) |
| State: | 9.7% (200,337) |
Number of households with income $100k - 125k:| North Coastal: | 9.4% (69,148) |
| State: | 9.4% (193,488) |
Number of households with income $125k - 150k:| North Coastal: | 7.7% (56,569) |
| State: | 7.7% (158,253) |
Number of households with income $150k - 200k:| North Coastal: | 12.2% (90,103) |
| State: | 12.2% (252,139) |
Number of households with income > $200k:| North Coastal: | 28.4% (209,625) |
| State: | 28.4% (586,641) |
Aggregate household income in North Coastal in 2022: $34,136,808
Median family income in North Coastal in 2022:| North Coastal: | $303,779 |
| State: | $136,040 |
Number of families with income $20k - 30k:| North Coastal: | 10.0% (4) |
| State: | 4.1% (61,519) |
Number of families with income $30k - 40k:| North Coastal: | 9.2% (4) |
| California: | 3.7% (55,234) |
Number of families with income $40k - 50k:| North Coastal: | 22.0% (10) |
| California: | 3.9% (58,471) |
Number of families with income $50k - 60k:| North Coastal: | 21.7% (9) |
| California: | 3.9% (58,911) |
Number of families with income $60k - 75k:| North Coastal: | 27.2% (12) |
| California: | 5.9% (88,675) |
Number of families with income $75k - 100k:| North Coastal: | 9.9% (4) |
| State: | 9.5% (143,103) |
Median non-family income in North Coastal in 2022:| North Coastal: | $16,780 |
| State: | $74,216 |
Change in median non-family income between 2000 and 2022:| North Coastal, California: | +79.9% |
| State: | +136.3% |
Median per capita income in North Coastal in 2022:| North Coastal: | $32,988 |
| State: | $58,824 |
Change in median per capita income between 2000 and 2022:| North Coastal, California: | +135.2% |
| California: | +166.8% |
Income statistics for Hispanic or Latino residents
Median household income in North Coastal, CA in 2022:| North Coastal: | $82,752 |
| State: | $75,698 |
Change in median household income between 2000 and 2022:| North Coastal, California: | +138.8% |
| California: | +107.2% |
Number of households with income < $10k:| North Coastal: | 4.3% (87,192) |
| California: | 4.3% (183,294) |
Number of households with income $10k - 20k:| North Coastal: | 6.0% (120,657) |
| State: | 6.0% (253,903) |
Number of households with income $20k - 30k:| North Coastal: | 6.8% (136,141) |
| California: | 6.8% (286,386) |
Number of households with income $30k - 40k:| North Coastal: | 7.4% (149,106) |
| State: | 7.4% (313,728) |
Number of households with income $40k - 50k:| North Coastal: | 7.4% (148,895) |
| State: | 7.4% (313,199) |
Number of households with income $50k - 60k:| North Coastal: | 7.2% (145,156) |
| California: | 7.2% (305,366) |
Number of households with income $60k - 75k:| North Coastal: | 10.3% (206,643) |
| State: | 10.3% (434,937) |
Number of households with income $75k - 100k:| North Coastal: | 14.4% (288,248) |
| State: | 14.4% (607,302) |
Number of households with income $100k - 125k:| North Coastal: | 10.6% (212,529) |
| California: | 10.6% (447,424) |
Number of households with income $125k - 150k:| North Coastal: | 7.5% (149,926) |
| State: | 7.5% (316,022) |
Number of households with income $150k - 200k:| North Coastal: | 9.1% (183,422) |
| California: | 9.2% (386,269) |
Number of households with income > $200k:| North Coastal: | 8.8% (177,111) |
| State: | 8.8% (372,651) |
Aggregate household income in North Coastal in 2022: $67,898,181
Median family income in North Coastal in 2022:| North Coastal: | $71,101 |
| State: | $77,589 |
Number of families with income < $10k:| North Coastal: | 7.9% (196) |
| State: | 3.9% (129,468) |
Number of families with income $10k - 20k:| North Coastal: | 10.2% (252) |
| State: | 4.6% (151,997) |
Number of families with income $20k - 30k:| North Coastal: | 11.7% (290) |
| State: | 6.6% (216,764) |
Number of families with income $30k - 40k:| North Coastal: | 11.8% (292) |
| State: | 7.6% (249,849) |
Number of families with income $40k - 50k:| North Coastal: | 12.4% (308) |
| State: | 7.7% (254,822) |
Number of families with income $50k - 60k:| North Coastal: | 10.4% (258) |
| California: | 7.4% (244,815) |
Number of families with income $60k - 75k:| North Coastal: | 12.4% (307) |
| California: | 10.5% (345,838) |
Number of families with income $75k - 100k:| North Coastal: | 10.6% (261) |
| California: | 14.9% (491,589) |
Number of families with income $100k - 125k:| North Coastal: | 4.7% (117) |
| California: | 10.7% (355,400) |
Number of families with income $125k - 150k:| North Coastal: | 2.0% (49) |
| California: | 7.8% (259,317) |
Number of families with income $150k - 200k:| North Coastal: | 2.4% (60) |
| State: | 9.3% (306,566) |
Number of families with income > $200k:| North Coastal: | 3.5% (87) |
| California: | 9.1% (299,984) |
Median non-family income in North Coastal in 2022:| North Coastal: | $113,952 |
| California: | $49,746 |
Median per capita income in North Coastal in 2022:| North Coastal: | $40,044 |
| State: | $27,240 |
Change in median per capita income between 2000 and 2022:| North Coastal, California: | +89.1% |
| California: | +133.3% |
Income statistics for American Indian and Alaska Native residents
Median household income in North Coastal, CA in 2022:| North Coastal: | $95,899 |
| State: | $76,752 |
Change in median household income between 2000 and 2022:| North Coastal, California: | +134.6% |
| State: | +110.0% |
Number of households with income < $10k:| North Coastal: | 5.4% (4,717) |
| State: | 5.4% (8,471) |
Number of households with income $10k - 20k:| North Coastal: | 6.0% (5,205) |
| State: | 6.0% (9,381) |
Number of households with income $20k - 30k:| North Coastal: | 5.6% (4,890) |
| State: | 5.5% (8,668) |
Number of households with income $30k - 40k:| North Coastal: | 8.2% (7,173) |
| California: | 8.3% (13,030) |
Number of households with income $40k - 50k:| North Coastal: | 7.0% (6,070) |
| California: | 6.9% (10,908) |
Number of households with income $50k - 60k:| North Coastal: | 7.1% (6,204) |
| California: | 7.1% (11,198) |
Number of households with income $60k - 75k:| North Coastal: | 9.6% (8,380) |
| California: | 9.6% (15,190) |
Number of households with income $75k - 100k:| North Coastal: | 14.0% (12,240) |
| State: | 14.1% (22,274) |
Number of households with income $100k - 125k:| North Coastal: | 11.3% (9,834) |
| California: | 11.2% (17,643) |
Number of households with income $125k - 150k:| North Coastal: | 8.3% (7,205) |
| State: | 8.3% (13,117) |
Number of households with income $150k - 200k:| North Coastal: | 8.8% (7,657) |
| State: | 8.8% (13,853) |
Number of households with income > $200k:| North Coastal: | 8.8% (7,689) |
| State: | 8.8% (13,925) |
Aggregate household income in North Coastal in 2022: $20,324,086
Median family income in North Coastal in 2022:| North Coastal: | $144,432 |
| State: | $81,108 |
Number of families with income < $10k:| North Coastal: | 8.2% (21) |
| State: | 5.0% (5,711) |
Number of families with income $10k - 20k:| North Coastal: | 3.1% (8) |
| State: | 3.7% (4,148) |
Number of families with income $20k - 30k:| North Coastal: | 2.8% (7) |
| State: | 4.3% (4,876) |
Number of families with income $30k - 40k:| North Coastal: | 5.2% (13) |
| California: | 8.8% (9,994) |
Number of families with income $40k - 50k:| North Coastal: | 22.6% (57) |
| State: | 7.8% (8,776) |
Number of families with income $50k - 60k:| North Coastal: | 12.9% (33) |
| California: | 6.9% (7,834) |
Number of families with income $60k - 75k:| North Coastal: | 17.8% (45) |
| State: | 9.1% (10,247) |
Number of families with income $75k - 100k:| North Coastal: | 1.6% (4) |
| California: | 14.8% (16,731) |
Number of families with income $150k - 200k:| North Coastal: | 25.8% (65) |
| State: | 9.5% (10,721) |
Median non-family income in North Coastal in 2022:| North Coastal: | $46,510 |
| State: | $51,296 |
Change in median non-family income between 2000 and 2022:| North Coastal, California: | +80.0% |
| California: | +114.0% |
Median per capita income in North Coastal in 2022:| North Coastal: | $28,923 |
| California: | $30,289 |
Change in median per capita income between 2000 and 2022:| North Coastal, California: | +127.6% |
| State: | +98.9% |
Income statistics for Multirace residents
Median household income in North Coastal, CA in 2022:| North Coastal: | $81,992 |
| State: | $83,153 |
Number of households with income < $10k:| North Coastal: | 3.8% (229) |
| California: | 4.2% (85,299) |
Number of households with income $10k - 20k:| North Coastal: | 13.2% (791) |
| State: | 6.1% (122,966) |
Number of households with income $20k - 30k:| North Coastal: | 2.7% (160) |
| State: | 6.4% (129,328) |
Number of households with income $30k - 40k:| North Coastal: | 8.4% (502) |
| State: | 6.4% (130,070) |
Number of households with income $40k - 50k:| North Coastal: | 15.8% (943) |
| California: | 6.5% (131,254) |
Number of households with income $50k - 60k:| North Coastal: | 4.4% (265) |
| State: | 6.5% (132,382) |
Number of households with income $60k - 75k:| North Coastal: | 14.3% (856) |
| California: | 9.4% (191,472) |
Number of households with income $75k - 100k:| North Coastal: | 17.1% (1,021) |
| State: | 13.3% (269,691) |
Number of households with income $100k - 125k:| North Coastal: | 9.2% (548) |
| State: | 10.2% (207,286) |
Number of households with income $125k - 150k:| North Coastal: | 2.0% (117) |
| State: | 7.8% (158,259) |
Number of households with income $150k - 200k:| North Coastal: | 6.1% (364) |
| California: | 10.3% (209,227) |
Number of households with income > $200k:| North Coastal: | 3.1% (185) |
| State: | 13.0% (263,210) |
Aggregate household income in North Coastal in 2022: $68,365,566
Median family income in North Coastal in 2022:| North Coastal: | $73,616 |
| State: | $87,642 |
Number of families with income < $10k:| North Coastal: | 11.6% (106) |
| California: | 3.2% (48,017) |
Number of families with income $10k - 20k:| North Coastal: | 11.8% (107) |
| California: | 4.1% (60,419) |
Number of families with income $20k - 30k:| North Coastal: | 10.8% (99) |
| State: | 6.1% (89,742) |
Number of families with income $30k - 40k:| North Coastal: | 4.8% (44) |
| State: | 6.2% (91,415) |
Number of families with income $40k - 50k:| North Coastal: | 12.9% (118) |
| State: | 6.8% (100,085) |
Number of families with income $50k - 60k:| North Coastal: | 2.1% (19) |
| State: | 6.7% (98,298) |
Number of families with income $60k - 75k:| North Coastal: | 4.3% (39) |
| California: | 9.5% (140,131) |
Number of families with income $75k - 100k:| North Coastal: | 9.0% (82) |
| California: | 13.8% (203,439) |
Number of families with income $100k - 125k:| North Coastal: | 26.0% (237) |
| State: | 10.4% (153,515) |
Number of families with income $125k - 150k:| North Coastal: | 6.7% (61) |
| California: | 8.4% (124,115) |
Median non-family income in North Coastal in 2022:| North Coastal: | $65,458 |
| State: | $56,558 |
Median per capita income in North Coastal in 2022:| North Coastal: | $30,644 |
| State: | $32,124 |
Change in median per capita income between 2000 and 2022:| North Coastal, California: | +118.0% |
| California: | +120.4% |
Income statistics for other residents
Number of households with income < $10k:| North Coastal: | 4.7% (127) |
| State: | 4.6% (93,035) |
Number of households with income $10k - 20k:| North Coastal: | 6.3% (171) |
| State: | 6.3% (126,222) |
Number of households with income $20k - 30k:| North Coastal: | 7.1% (193) |
| State: | 7.1% (142,656) |
Number of households with income $30k - 40k:| North Coastal: | 8.2% (224) |
| State: | 8.2% (165,018) |
Number of households with income $40k - 50k:| North Coastal: | 8.1% (220) |
| State: | 8.0% (161,732) |
Number of households with income $50k - 60k:| North Coastal: | 7.6% (207) |
| State: | 7.6% (152,152) |
Number of households with income $60k - 75k:| North Coastal: | 10.4% (285) |
| State: | 10.4% (209,951) |
Number of households with income $75k - 100k:| North Coastal: | 14.7% (401) |
| State: | 14.7% (296,102) |
Number of households with income $100k - 125k:| North Coastal: | 10.7% (291) |
| State: | 10.7% (214,281) |
Number of households with income $125k - 150k:| North Coastal: | 7.1% (194) |
| State: | 7.1% (143,092) |
Number of households with income $150k - 200k:| North Coastal: | 8.6% (234) |
| State: | 8.6% (172,215) |
Number of households with income > $200k:| North Coastal: | 6.7% (182) |
| California: | 6.7% (134,102) |
Aggregate household income in North Coastal in 2022: $36,081,426
Median family income in North Coastal in 2022:| North Coastal: | $64,713 |
| State: | $72,756 |
Number of families with income < $10k:| North Coastal: | 16.1% (16) |
| California: | 4.3% (69,090) |
Number of families with income $10k - 20k:| North Coastal: | 1.6% (2) |
| State: | 5.1% (82,116) |
Number of families with income $20k - 30k:| North Coastal: | 7.1% (7) |
| California: | 7.0% (112,854) |
Number of families with income $30k - 40k:| North Coastal: | 2.3% (2) |
| State: | 8.4% (135,938) |
Number of families with income $40k - 50k:| North Coastal: | 5.5% (5) |
| State: | 8.4% (135,353) |
Number of families with income $50k - 60k:| North Coastal: | 21.1% (21) |
| State: | 7.7% (124,826) |
Number of families with income $60k - 75k:| North Coastal: | 16.6% (16) |
| State: | 10.7% (173,628) |
Number of families with income $75k - 100k:| North Coastal: | 3.4% (3) |
| State: | 15.2% (245,724) |
Number of families with income > $200k:| North Coastal: | 26.2% (25) |
| State: | 6.6% (106,346) |
Median non-family income in North Coastal in 2022:| North Coastal: | $144,741 |
| California: | $43,881 |
Change in median non-family income between 2000 and 2022:| North Coastal, California: | +99.3% |
| State: | +84.6% |
Median per capita income in North Coastal in 2022:| North Coastal: | $43,219 |
| State: | $25,164 |
Change in median per capita income between 2000 and 2022:| North Coastal, California: | +97.9% |
| State: | +137.9% |