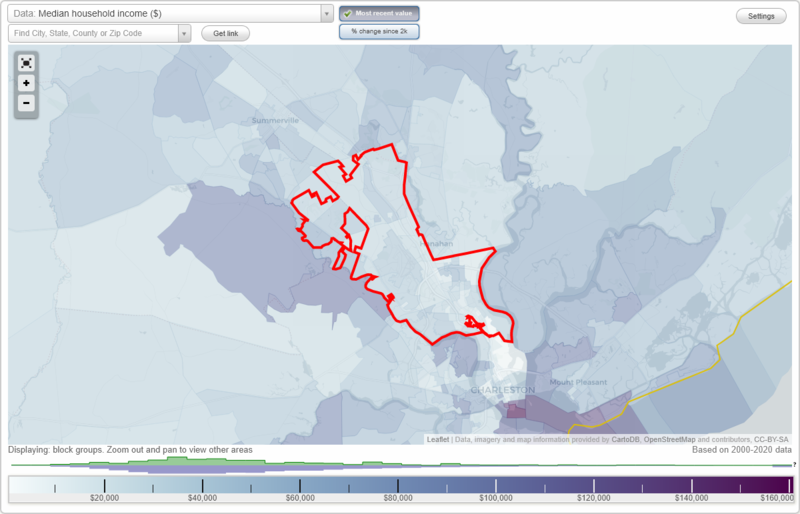
The median household income in North Charleston, SC in 2022 was $62,091, which was 3.3% less than the median annual income of $64,115 across the entire state of South Carolina. Compared to the median income of $29,307 in 2000 this represents an increase of 52.8%. The per capita income in 2022 was $32,705, which means an increase of 56.1% compared to 2000 when it was $14,361.
Whole page based on the data from 2000 / 2022 when the population of North Charleston, South Carolina was 79,641 / 118,604
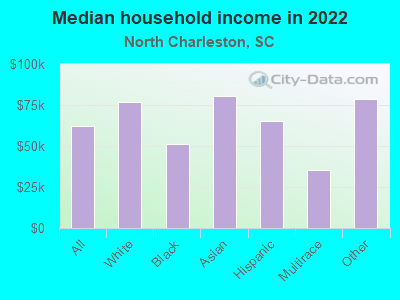
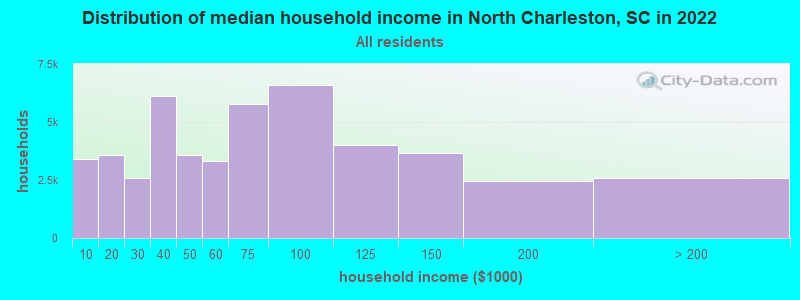
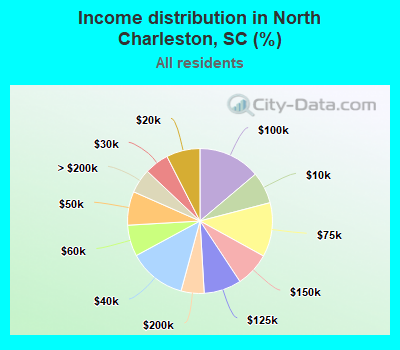
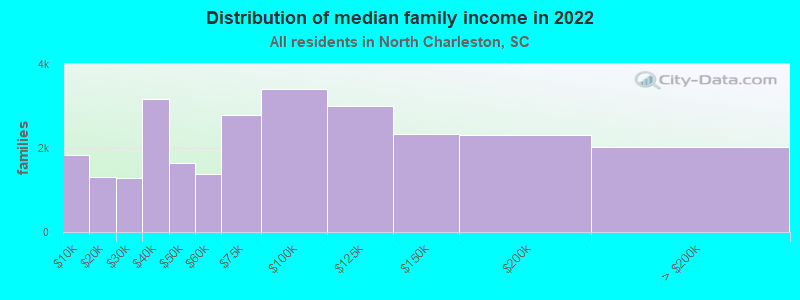
Income statistics for all residents
Median household income in North Charleston, SC in 2022:
North Charleston:
$62,091
State:
$64,115
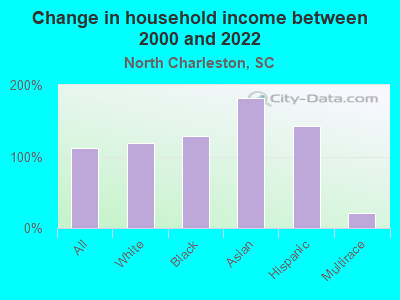
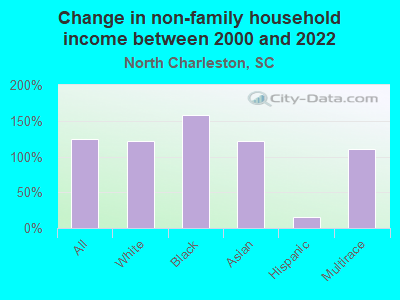
Change in median household income between 2000 and 2022:
North Charleston, South Carolina:
+111.9%
State:
+72.9%
Number of households with income < $10k:
North Charleston:
7.1% (3,385)
State:
6.1% (130,922)
Number of households with income $10k - 20k:
North Charleston:
7.5% (3,588)
South Carolina:
7.9% (168,918)
Number of households with income $20k - 30k:
North Charleston:
5.4% (2,586)
State:
8.0% (171,564)
Number of households with income $30k - 40k:
North Charleston:
12.9% (6,138)
State:
9.2% (195,662)
Number of households with income $40k - 50k:
North Charleston:
7.5% (3,590)
South Carolina:
8.2% (176,179)
Number of households with income $50k - 60k:
North Charleston:
7.0% (3,335)
State:
7.5% (159,159)
Number of households with income $60k - 75k:
North Charleston:
12.1% (5,768)
State:
9.9% (211,862)
Number of households with income $75k - 100k:
North Charleston:
13.8% (6,598)
South Carolina:
13.5% (287,601)
Number of households with income $100k - 125k:
North Charleston:
8.4% (3,988)
State:
9.3% (199,068)
Number of households with income $125k - 150k:
North Charleston:
7.7% (3,666)
South Carolina:
6.2% (133,330)
Number of households with income $150k - 200k:
North Charleston:
5.1% (2,449)
State:
6.6% (141,363)
Number of households with income > $200k:
North Charleston:
5.4% (2,592)
South Carolina:
7.5% (160,452)
Aggregate household income in North Charleston in 2022: $3,738,232,800
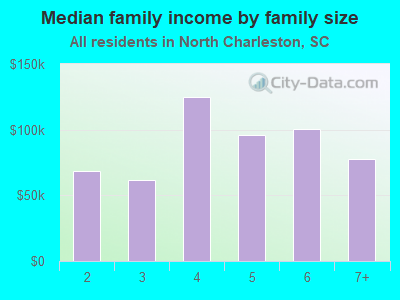
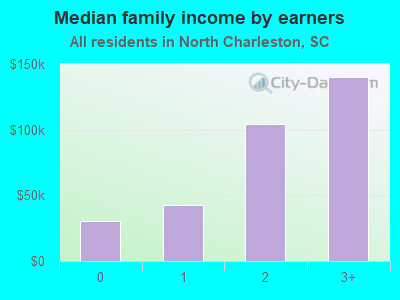
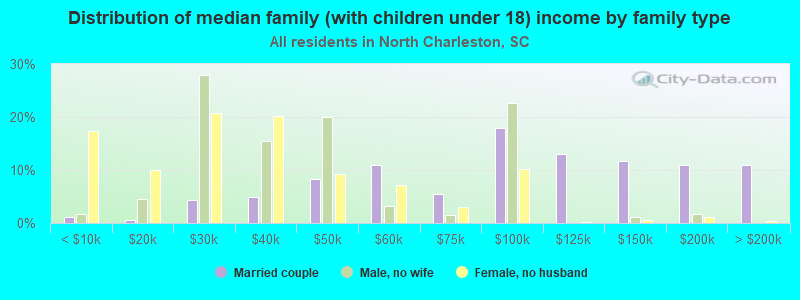
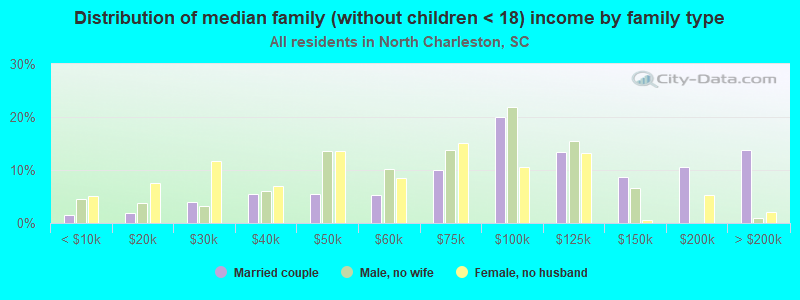
Median family income in North Charleston in 2022:
North Charleston:
$74,168
State:
$79,886
Number of families with income < $10k:
North Charleston:
7.0% (1,841)
South Carolina:
3.7% (51,214)
Number of families with income $10k - 20k:
North Charleston:
4.9% (1,302)
State:
4.5% (63,460)
Number of families with income $20k - 30k:
North Charleston:
4.8% (1,282)
State:
5.9% (82,415)
Number of families with income $30k - 40k:
North Charleston:
12.0% (3,166)
South Carolina:
7.5% (105,475)
Number of families with income $40k - 50k:
North Charleston:
6.2% (1,643)
State:
7.7% (107,666)
Number of families with income $50k - 60k:
North Charleston:
5.2% (1,379)
State:
7.1% (98,803)
Number of families with income $60k - 75k:
North Charleston:
10.6% (2,796)
South Carolina:
9.9% (138,412)
Number of families with income $75k - 100k:
North Charleston:
12.9% (3,416)
South Carolina:
15.4% (214,716)
Number of families with income $100k - 125k:
North Charleston:
11.3% (2,992)
State:
11.4% (159,999)
Number of families with income $125k - 150k:
North Charleston:
8.8% (2,322)
State:
8.0% (112,152)
Number of families with income $150k - 200k:
North Charleston:
8.7% (2,298)
South Carolina:
8.8% (123,525)
Number of families with income > $200k:
North Charleston:
7.6% (2,017)
South Carolina:
10.1% (140,575)
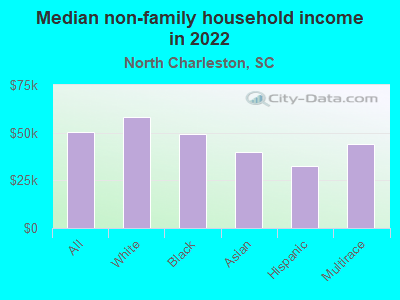
Median non-family income in North Charleston in 2022:
North Charleston:
$50,580
State:
$38,426
Change in median non-family income between 2000 and 2022:
North Charleston, South Carolina:
+124.5%
South Carolina:
+78.7%
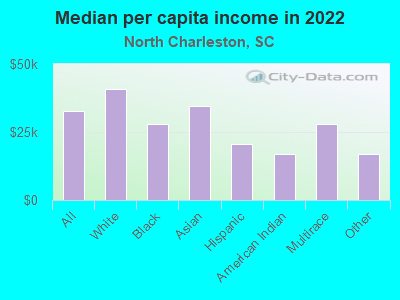
Median per capita income in North Charleston in 2022:
North Charleston:
$32,705
South Carolina:
$36,675
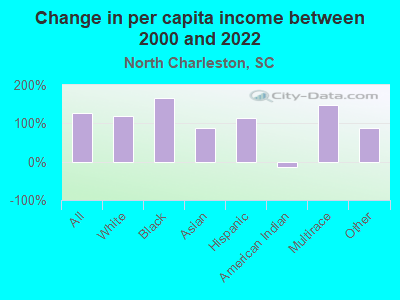
Change in median per capita income between 2000 and 2022:
North Charleston, South Carolina:
+127.7%
State:
+95.1%
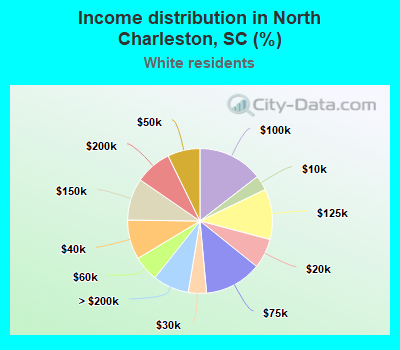
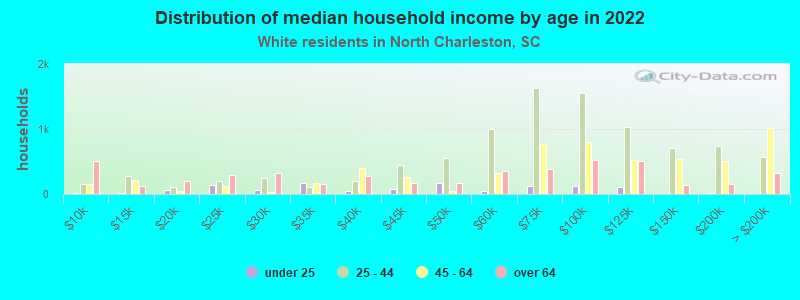
Income statistics for White residents
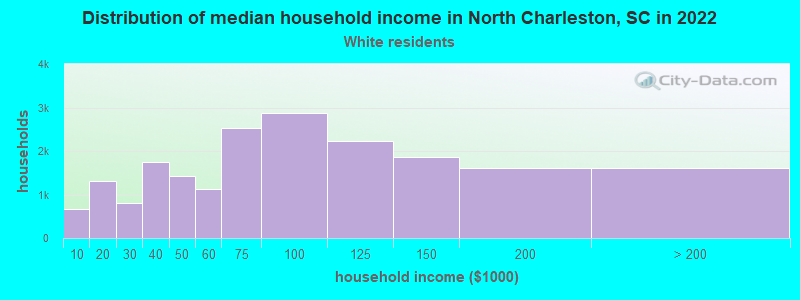
Median household income in North Charleston, SC in 2022:
North Charleston:
$76,799
State:
$73,516
Change in median household income between 2000 and 2022:
North Charleston, South Carolina:
+119.4%
State:
+74.8%
Number of households with income < $10k:
North Charleston:
3.3% (656)
State:
4.8% (68,379)
Number of households with income $10k - 20k:
North Charleston:
6.7% (1,318)
South Carolina:
5.9% (85,105)
Number of households with income $20k - 30k:
North Charleston:
4.1% (803)
South Carolina:
7.1% (101,178)
Number of households with income $30k - 40k:
North Charleston:
8.8% (1,747)
State:
8.0% (114,877)
Number of households with income $40k - 50k:
North Charleston:
7.2% (1,429)
South Carolina:
7.9% (112,749)
Number of households with income $50k - 60k:
North Charleston:
5.7% (1,123)
State:
7.1% (101,835)
Number of households with income $60k - 75k:
North Charleston:
12.8% (2,524)
South Carolina:
10.2% (145,879)
Number of households with income $75k - 100k:
North Charleston:
14.5% (2,872)
South Carolina:
14.0% (200,068)
Number of households with income $100k - 125k:
North Charleston:
11.3% (2,227)
State:
10.4% (148,542)
Number of households with income $125k - 150k:
North Charleston:
9.4% (1,856)
South Carolina:
7.3% (105,118)
Number of households with income $150k - 200k:
North Charleston:
8.2% (1,614)
South Carolina:
8.0% (114,506)
Number of households with income > $200k:
North Charleston:
8.1% (1,598)
South Carolina:
9.3% (133,550)
Aggregate household income in North Charleston in 2022: $1,857,986,500
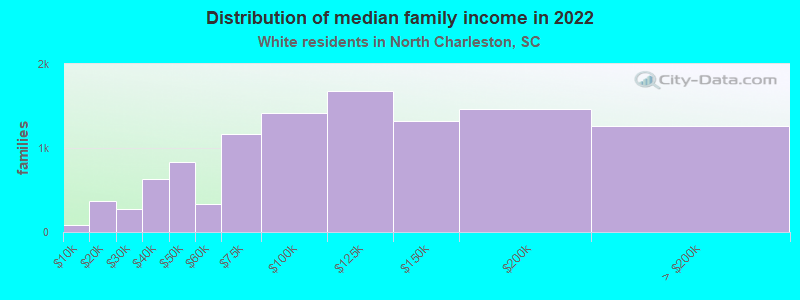
Median family income in North Charleston in 2022:
North Charleston:
$102,751
South Carolina:
$90,709
Number of families with income < $10k:
North Charleston:
0.7% (79)
South Carolina:
2.4% (22,376)
Number of families with income $10k - 20k:
North Charleston:
3.4% (372)
South Carolina:
3.0% (28,325)
Number of families with income $20k - 30k:
North Charleston:
2.6% (277)
State:
4.4% (42,131)
Number of families with income $30k - 40k:
North Charleston:
5.8% (626)
State:
6.1% (57,510)
Number of families with income $40k - 50k:
North Charleston:
7.7% (838)
State:
7.0% (66,712)
Number of families with income $50k - 60k:
North Charleston:
3.1% (339)
State:
6.6% (62,489)
Number of families with income $60k - 75k:
North Charleston:
10.8% (1,169)
State:
10.0% (94,724)
Number of families with income $75k - 100k:
North Charleston:
13.1% (1,414)
State:
15.5% (147,207)
Number of families with income $100k - 125k:
North Charleston:
15.5% (1,675)
State:
12.5% (118,160)
Number of families with income $125k - 150k:
North Charleston:
12.2% (1,317)
South Carolina:
9.5% (90,395)
Number of families with income $150k - 200k:
North Charleston:
13.5% (1,467)
State:
10.6% (100,043)
Number of families with income > $200k:
North Charleston:
11.6% (1,259)
State:
12.4% (117,500)
Median non-family income in North Charleston in 2022:
North Charleston:
$58,265
State:
$42,596
Change in median non-family income between 2000 and 2022:
North Charleston, South Carolina:
+122.3%
State:
+74.9%
Median per capita income in North Charleston in 2022:
North Charleston:
$40,888
State:
$42,728
Change in median per capita income between 2000 and 2022:
North Charleston, South Carolina:
+119.5%
State:
+93.4%
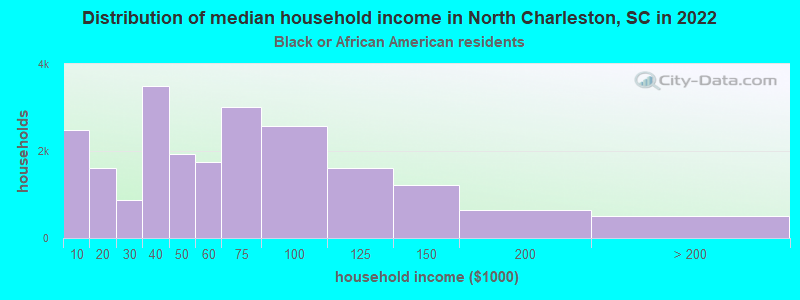
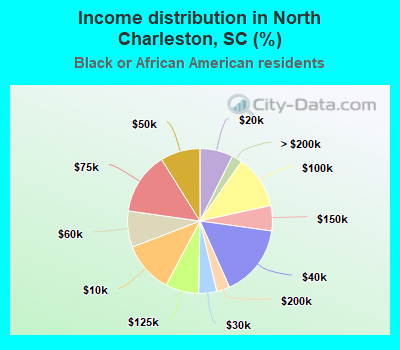
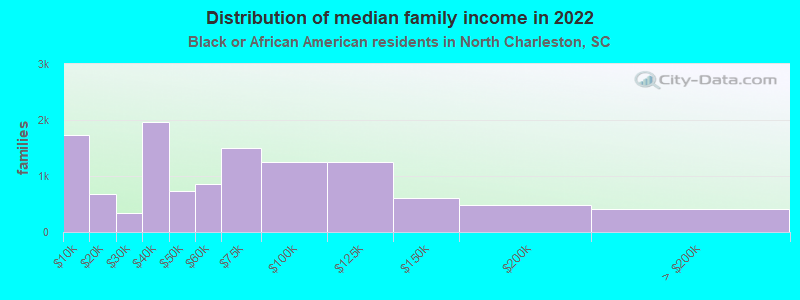
Income statistics for Black or African American residents
Median household income in North Charleston, SC in 2022:
North Charleston:
$51,129
State:
$44,187
Change in median household income between 2000 and 2022:
North Charleston, South Carolina:
+129.1%
State:
+76.5%
Number of households with income < $10k:
North Charleston:
11.4% (2,482)
South Carolina:
10.0% (52,303)
Number of households with income $10k - 20k:
North Charleston:
7.4% (1,608)
State:
13.4% (69,913)
Number of households with income $20k - 30k:
North Charleston:
4.0% (878)
State:
10.4% (54,216)
Number of households with income $30k - 40k:
North Charleston:
16.1% (3,504)
South Carolina:
12.0% (62,722)
Number of households with income $40k - 50k:
North Charleston:
8.9% (1,927)
State:
9.2% (47,773)
Number of households with income $50k - 60k:
North Charleston:
8.1% (1,752)
South Carolina:
8.3% (43,083)
Number of households with income $60k - 75k:
North Charleston:
13.9% (3,020)
State:
9.3% (48,640)
Number of households with income $75k - 100k:
North Charleston:
11.9% (2,584)
South Carolina:
12.2% (63,723)
Number of households with income $100k - 125k:
North Charleston:
7.4% (1,614)
State:
6.4% (33,117)
Number of households with income $125k - 150k:
North Charleston:
5.6% (1,224)
State:
3.2% (16,465)
Number of households with income $150k - 200k:
North Charleston:
2.9% (641)
State:
3.2% (16,672)
Number of households with income > $200k:
North Charleston:
2.3% (497)
South Carolina:
2.3% (12,213)
Aggregate household income in North Charleston in 2022: $1,415,216,000
Median family income in North Charleston in 2022:
North Charleston:
$53,399
State:
$54,267
Number of families with income < $10k:
North Charleston:
14.7% (1,740)
State:
7.3% (23,752)
Number of families with income $10k - 20k:
North Charleston:
5.8% (687)
State:
8.5% (27,789)
Number of families with income $20k - 30k:
North Charleston:
2.8% (331)
South Carolina:
9.4% (30,766)
Number of families with income $30k - 40k:
North Charleston:
16.6% (1,968)
State:
11.6% (37,651)
Number of families with income $40k - 50k:
North Charleston:
6.2% (737)
State:
9.5% (30,858)
Number of families with income $50k - 60k:
North Charleston:
7.3% (865)
State:
8.7% (28,419)
Number of families with income $60k - 75k:
North Charleston:
12.7% (1,505)
South Carolina:
9.6% (31,402)
Number of families with income $75k - 100k:
North Charleston:
10.6% (1,254)
State:
15.2% (49,441)
Number of families with income $100k - 125k:
North Charleston:
10.5% (1,243)
State:
8.6% (27,974)
Number of families with income $125k - 150k:
North Charleston:
5.1% (609)
State:
3.9% (12,743)
Number of families with income $150k - 200k:
North Charleston:
4.1% (488)
South Carolina:
4.5% (14,809)
Number of families with income > $200k:
North Charleston:
3.5% (410)
State:
3.2% (10,269)
Median non-family income in North Charleston in 2022:
North Charleston:
$49,361
State:
$28,585
Median per capita income in North Charleston in 2022:
North Charleston:
$28,087
State:
$24,863
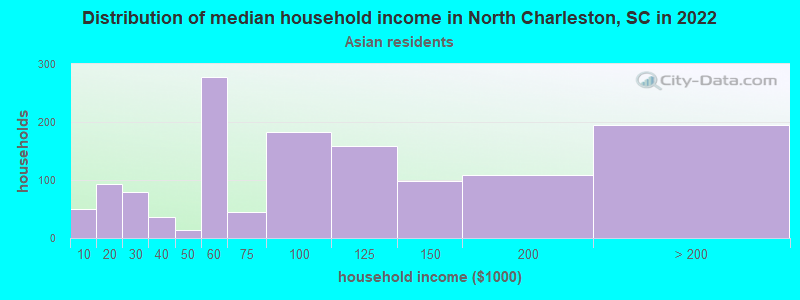
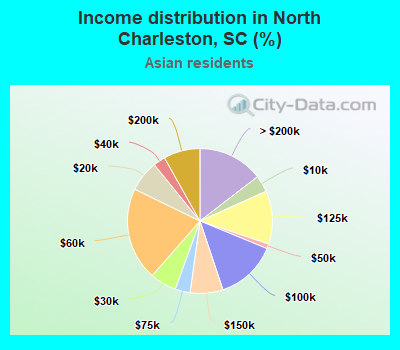
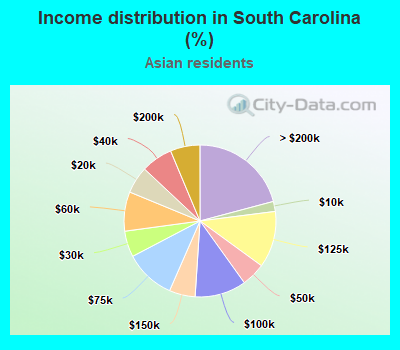
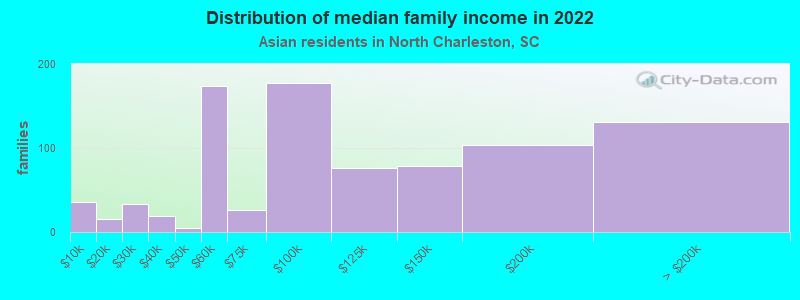
Income statistics for Asian residents
Median household income in North Charleston, SC in 2022:
North Charleston:
$80,385
State:
$87,807
Number of households with income < $10k:
North Charleston:
3.7% (50)
South Carolina:
2.1% (676)
Number of households with income $10k - 20k:
North Charleston:
6.9% (93)
South Carolina:
5.8% (1,818)
Number of households with income $20k - 30k:
North Charleston:
5.9% (79)
South Carolina:
5.5% (1,750)
Number of households with income $30k - 40k:
North Charleston:
2.7% (36)
State:
6.7% (2,113)
Number of households with income $40k - 50k:
North Charleston:
1.0% (14)
South Carolina:
5.1% (1,605)
Number of households with income $50k - 60k:
North Charleston:
20.8% (278)
State:
8.4% (2,643)
Number of households with income $60k - 75k:
North Charleston:
3.4% (45)
South Carolina:
10.8% (3,393)
Number of households with income $75k - 100k:
North Charleston:
13.7% (183)
South Carolina:
10.9% (3,450)
Number of households with income $100k - 125k:
North Charleston:
11.9% (159)
South Carolina:
12.0% (3,796)
Number of households with income $125k - 150k:
North Charleston:
7.3% (98)
State:
5.5% (1,742)
Number of households with income $150k - 200k:
North Charleston:
8.1% (109)
South Carolina:
6.3% (1,990)
Number of households with income > $200k:
North Charleston:
14.6% (195)
State:
20.9% (6,581)
Aggregate household income in North Charleston in 2022: $131,487,300
Median family income in North Charleston in 2022:
North Charleston:
$83,283
South Carolina:
$110,614
Number of families with income < $10k:
North Charleston:
4.1% (36)
State:
1.1% (230)
Number of families with income $10k - 20k:
North Charleston:
1.7% (15)
South Carolina:
4.4% (930)
Number of families with income $20k - 30k:
North Charleston:
3.8% (33)
South Carolina:
3.9% (834)
Number of families with income $30k - 40k:
North Charleston:
2.1% (19)
State:
3.6% (766)
Number of families with income $40k - 50k:
North Charleston:
0.6% (5)
South Carolina:
3.9% (833)
Number of families with income $50k - 60k:
North Charleston:
19.9% (174)
State:
5.6% (1,197)
Number of families with income $60k - 75k:
North Charleston:
3.0% (26)
State:
8.2% (1,750)
Number of families with income $75k - 100k:
North Charleston:
20.3% (177)
South Carolina:
12.4% (2,645)
Number of families with income $100k - 125k:
North Charleston:
8.7% (76)
State:
13.1% (2,801)
Number of families with income $125k - 150k:
North Charleston:
8.9% (78)
State:
6.5% (1,394)
Number of families with income $150k - 200k:
North Charleston:
11.8% (103)
State:
7.3% (1,562)
Number of families with income > $200k:
North Charleston:
15.0% (131)
South Carolina:
30.1% (6,428)
Median non-family income in North Charleston in 2022:
North Charleston:
$39,684
State:
$53,931
Change in median non-family income between 2000 and 2022:
North Charleston, South Carolina:
+121.5%
South Carolina:
+134.6%
Median per capita income in North Charleston in 2022:
North Charleston:
$34,663
State:
$48,909
Change in median per capita income between 2000 and 2022:
North Charleston, South Carolina:
+86.6%
State:
+138.1%
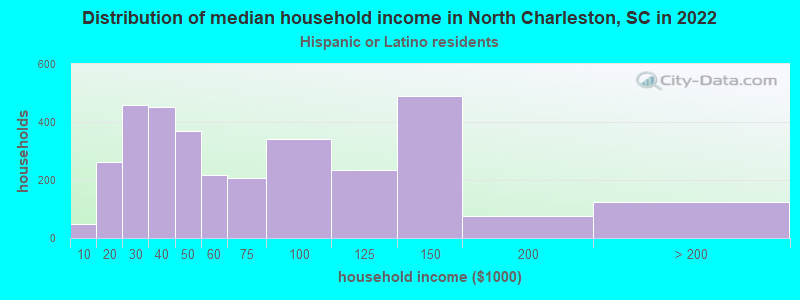
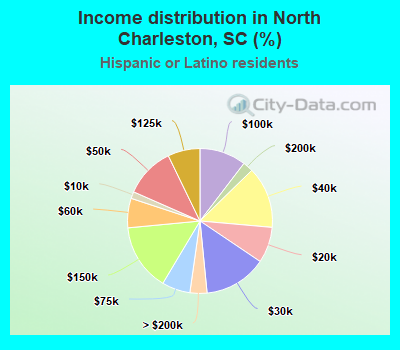
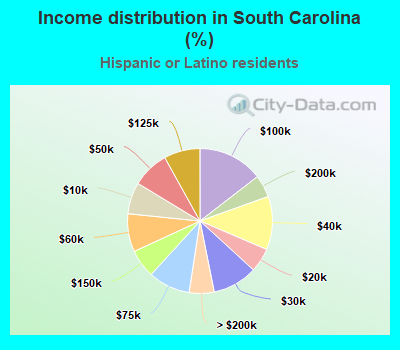
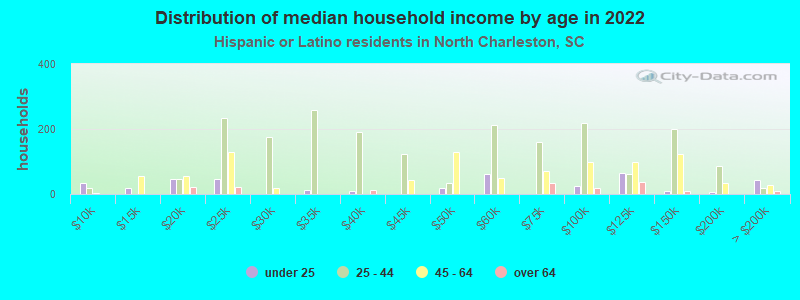
Income statistics for Hispanic or Latino residents
Median household income in North Charleston, SC in 2022:
North Charleston:
$65,503
South Carolina:
$58,486
Change in median household income between 2000 and 2022:
North Charleston, South Carolina:
+142.3%
State:
+84.8%
Number of households with income < $10k:
North Charleston:
1.5% (50)
State:
7.1% (7,036)
Number of households with income $10k - 20k:
North Charleston:
8.0% (263)
South Carolina:
5.4% (5,379)
Number of households with income $20k - 30k:
North Charleston:
14.0% (460)
State:
10.0% (9,993)
Number of households with income $30k - 40k:
North Charleston:
13.7% (451)
South Carolina:
11.9% (11,872)
Number of households with income $40k - 50k:
North Charleston:
11.2% (368)
State:
8.3% (8,239)
Number of households with income $50k - 60k:
North Charleston:
6.6% (216)
State:
8.5% (8,475)
Number of households with income $60k - 75k:
North Charleston:
6.3% (207)
South Carolina:
9.4% (9,330)
Number of households with income $75k - 100k:
North Charleston:
10.4% (341)
South Carolina:
14.5% (14,491)
Number of households with income $100k - 125k:
North Charleston:
7.2% (236)
State:
8.1% (8,026)
Number of households with income $125k - 150k:
North Charleston:
14.9% (490)
South Carolina:
6.3% (6,313)
Number of households with income $150k - 200k:
North Charleston:
2.3% (75)
State:
5.0% (4,963)
Number of households with income > $200k:
North Charleston:
3.8% (125)
State:
5.6% (5,548)
Aggregate household income in North Charleston in 2022: $192,996,900
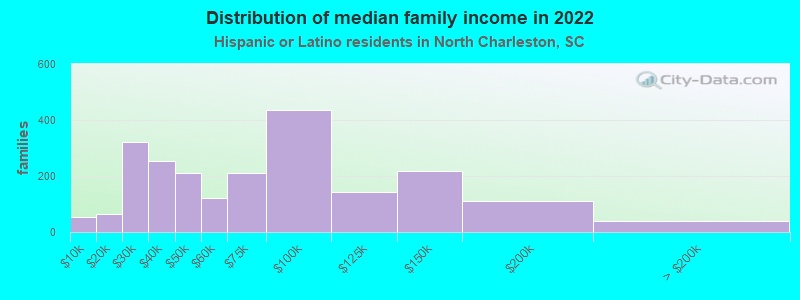
Median family income in North Charleston in 2022:
North Charleston:
$80,325
State:
$62,837
Number of families with income < $10k:
North Charleston:
2.5% (55)
South Carolina:
6.1% (4,418)
Number of families with income $10k - 20k:
North Charleston:
2.9% (64)
State:
4.8% (3,459)
Number of families with income $20k - 30k:
North Charleston:
14.8% (322)
State:
8.4% (6,079)
Number of families with income $30k - 40k:
North Charleston:
11.6% (254)
State:
12.3% (8,946)
Number of families with income $40k - 50k:
North Charleston:
9.6% (209)
South Carolina:
8.9% (6,476)
Number of families with income $50k - 60k:
North Charleston:
5.5% (120)
State:
7.1% (5,144)
Number of families with income $60k - 75k:
North Charleston:
9.7% (212)
State:
9.5% (6,918)
Number of families with income $75k - 100k:
North Charleston:
20.0% (437)
South Carolina:
15.0% (10,886)
Number of families with income $100k - 125k:
North Charleston:
6.5% (143)
State:
9.5% (6,862)
Number of families with income $125k - 150k:
North Charleston:
10.0% (218)
State:
6.7% (4,870)
Number of families with income $150k - 200k:
North Charleston:
5.1% (112)
State:
6.0% (4,384)
Number of families with income > $200k:
North Charleston:
1.8% (39)
State:
5.6% (4,034)
Median non-family income in North Charleston in 2022:
North Charleston:
$32,511
State:
$37,846
Change in median non-family income between 2000 and 2022:
North Charleston, South Carolina:
+14.7%
State:
+47.6%
Median per capita income in North Charleston in 2022:
North Charleston:
$20,489
State:
$23,692
Change in median per capita income between 2000 and 2022:
North Charleston, South Carolina:
+113.0%
State:
+95.1%
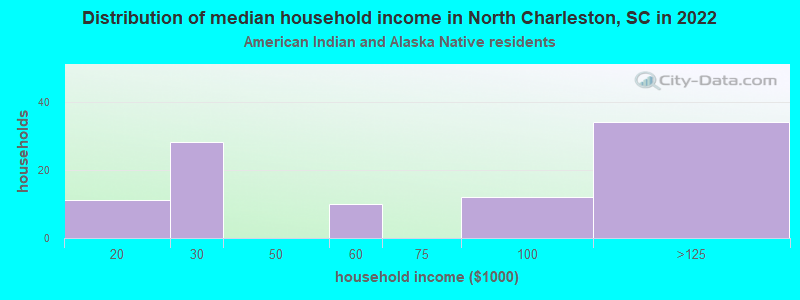
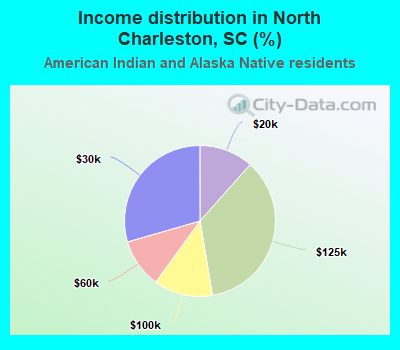
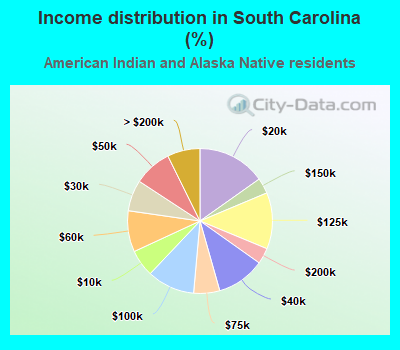
Income statistics for American Indian and Alaska Native residents
Number of households with income < $10k:
North Charleston:
0.0% (0)
South Carolina:
6.0% (394)
Number of households with income $10k - 20k:
North Charleston:
11.6% (11)
State:
15.2% (994)
Number of households with income $20k - 30k:
North Charleston:
29.5% (28)
State:
6.9% (454)
Number of households with income $30k - 40k:
North Charleston:
0.0% (0)
South Carolina:
10.8% (705)
Number of households with income $40k - 50k:
North Charleston:
0.0% (0)
State:
8.5% (555)
Number of households with income $50k - 60k:
North Charleston:
10.5% (10)
State:
9.2% (601)
Number of households with income $60k - 75k:
North Charleston:
0.0% (0)
State:
5.8% (380)
Number of households with income $75k - 100k:
North Charleston:
12.6% (12)
State:
10.7% (697)
Number of households with income $100k - 125k:
North Charleston:
35.8% (34)
State:
12.6% (822)
Number of households with income $125k - 150k:
North Charleston:
0.0% (0)
State:
3.5% (228)
Number of households with income $150k - 200k:
North Charleston:
0.0% (0)
South Carolina:
3.6% (234)
Number of households with income > $200k:
North Charleston:
0.0% (0)
South Carolina:
7.3% (477)
Aggregate household income in North Charleston in 2022: $3,394,752
Median per capita income in North Charleston in 2022:
North Charleston:
$16,983
State:
$26,654
Change in median per capita income between 2000 and 2022:: -15.2%
North Charleston, South Carolina:
-15.2%
State:
+73.9%
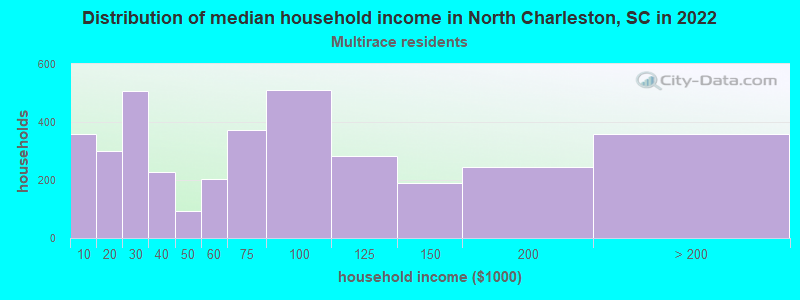
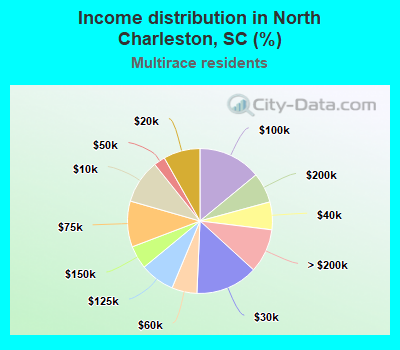
Income statistics for Multirace residents
Median household income in North Charleston, SC in 2022:
North Charleston:
$35,349
South Carolina:
$61,314
Change in median household income between 2000 and 2022:
North Charleston, South Carolina:
+20.5%
South Carolina:
+94.4%
Number of households with income < $10k:
North Charleston:
9.8% (358)
State:
6.9% (6,974)
Number of households with income $10k - 20k:
North Charleston:
8.2% (299)
State:
8.0% (8,052)
Number of households with income $20k - 30k:
North Charleston:
13.9% (507)
State:
9.9% (9,972)
Number of households with income $30k - 40k:
North Charleston:
6.2% (226)
State:
10.0% (10,121)
Number of households with income $40k - 50k:
North Charleston:
2.5% (93)
State:
8.1% (8,188)
Number of households with income $50k - 60k:
North Charleston:
5.6% (205)
State:
6.5% (6,530)
Number of households with income $60k - 75k:
North Charleston:
10.2% (374)
State:
8.9% (9,021)
Number of households with income $75k - 100k:
North Charleston:
14.0% (512)
State:
13.4% (13,544)
Number of households with income $100k - 125k:
North Charleston:
7.7% (282)
South Carolina:
9.8% (9,916)
Number of households with income $125k - 150k:
North Charleston:
5.2% (189)
State:
6.6% (6,657)
Number of households with income $150k - 200k:
North Charleston:
6.7% (246)
State:
5.9% (5,979)
Number of households with income > $200k:
North Charleston:
9.8% (359)
State:
6.2% (6,266)
Aggregate household income in North Charleston in 2022: $242,193,300
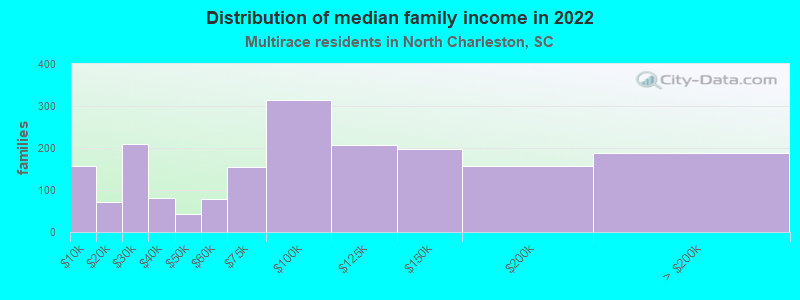
Median family income in North Charleston in 2022:
North Charleston:
$98,280
South Carolina:
$72,647
Number of families with income < $10k:
North Charleston:
8.5% (157)
State:
4.6% (3,104)
Number of families with income $10k - 20k:
North Charleston:
3.8% (71)
State:
5.7% (3,829)
Number of families with income $20k - 30k:
North Charleston:
11.2% (209)
South Carolina:
8.6% (5,823)
Number of families with income $30k - 40k:
North Charleston:
4.4% (82)
South Carolina:
8.1% (5,448)
Number of families with income $40k - 50k:
North Charleston:
2.3% (42)
State:
8.5% (5,751)
Number of families with income $50k - 60k:
North Charleston:
4.2% (78)
South Carolina:
5.7% (3,867)
Number of families with income $60k - 75k:
North Charleston:
8.3% (154)
State:
9.9% (6,674)
Number of families with income $75k - 100k:
North Charleston:
16.9% (314)
South Carolina:
15.0% (10,101)
Number of families with income $100k - 125k:
North Charleston:
11.1% (207)
South Carolina:
11.6% (7,846)
Number of families with income $125k - 150k:
North Charleston:
10.6% (197)
State:
7.0% (4,709)
Number of families with income $150k - 200k:
North Charleston:
8.5% (158)
South Carolina:
8.3% (5,590)
Number of families with income > $200k:
North Charleston:
10.1% (188)
State:
7.0% (4,727)
Median non-family income in North Charleston in 2022:
North Charleston:
$43,801
South Carolina:
$38,033
Change in median non-family income between 2000 and 2022:
North Charleston, South Carolina:
+111.5%
State:
+80.3%
Median per capita income in North Charleston in 2022:
North Charleston:
$27,852
South Carolina:
$26,391
Change in median per capita income between 2000 and 2022:
North Charleston, South Carolina:
+147.2%
State:
+120.8%
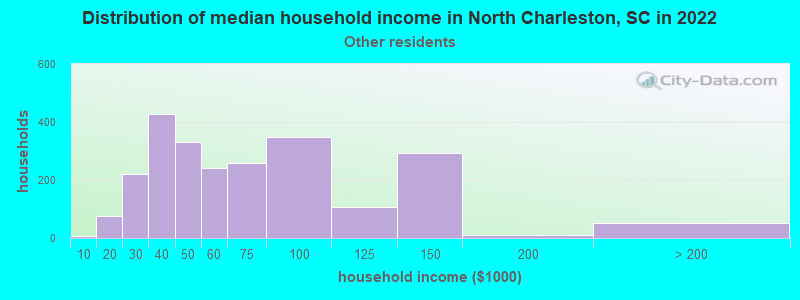
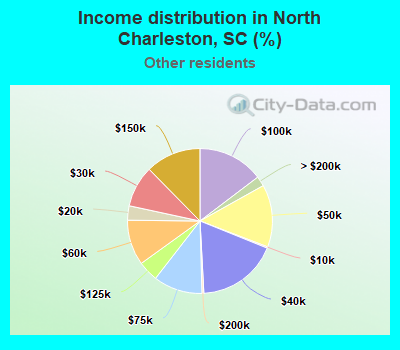
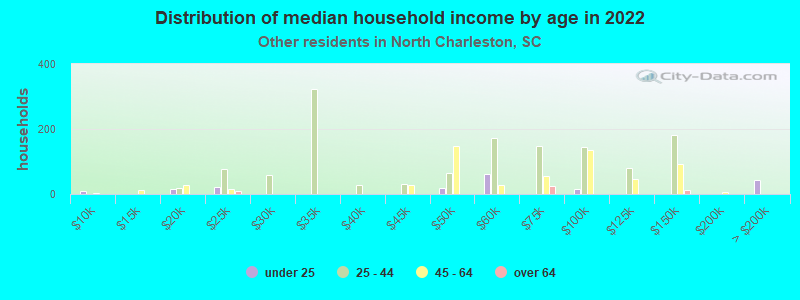
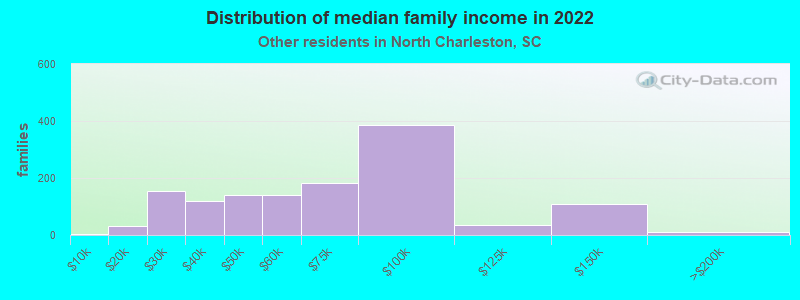
Income statistics for other residents
Median household income in North Charleston, SC in 2022:
North Charleston:
$78,797
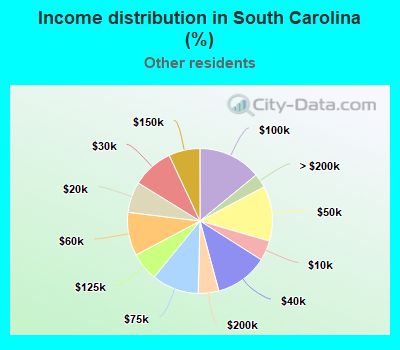
South Carolina:
$54,421
Number of households with income < $10k:
North Charleston:
0.3% (7)
State:
4.5% (1,945)
Number of households with income $10k - 20k:
North Charleston:
3.2% (76)
State:
6.9% (2,977)
Number of households with income $20k - 30k:
North Charleston:
9.3% (220)
State:
9.2% (3,988)
Number of households with income $30k - 40k:
North Charleston:
18.0% (429)
State:
11.8% (5,124)
Number of households with income $40k - 50k:
North Charleston:
13.9% (331)
State:
12.3% (5,309)
Number of households with income $50k - 60k:
North Charleston:
10.1% (241)
South Carolina:
9.7% (4,196)
Number of households with income $60k - 75k:
North Charleston:
10.9% (260)
State:
10.5% (4,549)
Number of households with income $75k - 100k:
North Charleston:
14.7% (349)
State:
14.1% (6,099)
Number of households with income $100k - 125k:
North Charleston:
4.5% (108)
South Carolina:
6.3% (2,747)
Number of households with income $125k - 150k:
North Charleston:
12.4% (294)
State:
7.0% (3,024)
Number of households with income $150k - 200k:
North Charleston:
0.4% (10)
State:
4.6% (1,982)
Number of households with income > $200k:
North Charleston:
2.2% (53)
State:
3.2% (1,365)
Aggregate household income in North Charleston in 2022: $88,873,100
Median family income in North Charleston in 2022:
North Charleston:
$79,481
State:
$60,279
Number of families with income < $10k:
North Charleston:
0.3% (4)
State:
4.7% (1,478)
Number of families with income $10k - 20k:
North Charleston:
2.3% (30)
State:
7.4% (2,325)
Number of families with income $20k - 30k:
North Charleston:
11.7% (153)
South Carolina:
7.6% (2,400)
Number of families with income $30k - 40k:
North Charleston:
9.3% (121)
State:
11.9% (3,744)
Number of families with income $40k - 50k:
North Charleston:
10.7% (141)
State:
10.5% (3,295)
Number of families with income $50k - 60k:
North Charleston:
10.7% (140)
State:
7.4% (2,322)
Number of families with income $60k - 75k:
North Charleston:
13.9% (182)
South Carolina:
11.5% (3,606)
Number of families with income $75k - 100k:
North Charleston:
29.4% (385)
State:
14.0% (4,390)
Number of families with income $100k - 125k:
North Charleston:
2.6% (34)
State:
8.3% (2,597)
Number of families with income $125k - 150k:
North Charleston:
8.3% (109)
South Carolina:
8.6% (2,711)
Number of families with income $150k - 200k:
North Charleston:
0.7% (9)
State:
4.3% (1,361)
Median per capita income in North Charleston in 2022:
North Charleston:
$16,921
State:
$22,305
Change in median per capita income between 2000 and 2022:
North Charleston, South Carolina:
+87.2%
South Carolina:
+113.0%
Discuss North Charleston, South Carolina (SC) on our hugely popular South Carolina forum.