The median household income in Kensington, CT in 2022 was $97,456, which was 9.3% greater than the median annual income of $88,429 across the entire state of Connecticut. Compared to the median income of $60,500 in 2000 this represents an increase of 37.9%. The per capita income in 2022 was $49,009, which means an increase of 48.9% compared to 2000 when it was $25,030.
Whole page based on the data from 2000 / 2022 when the population of Kensington, Connecticut was 8,541 / 9,619
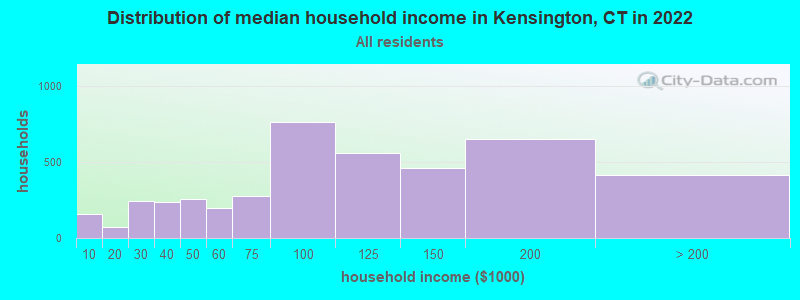
Income statistics for all residents
Median household income in Kensington, CT in 2022:
Kensington:
$97,457
State:
$88,429
Change in median household income between 2000 and 2022:
Kensington, Connecticut:
+61.1%
State:
+64.0%
Number of households with income < $10k:
Kensington:
3.6% (155)
State:
5.1% (72,746)
Number of households with income $10k - 20k:
Kensington:
1.7% (75)
State:
5.7% (81,643)
Number of households with income $20k - 30k:
Kensington:
5.6% (242)
State:
6.5% (92,844)
Number of households with income $30k - 40k:
Kensington:
5.5% (237)
Connecticut:
5.9% (83,934)
Number of households with income $40k - 50k:
Kensington:
6.0% (257)
State:
5.8% (83,025)
Number of households with income $50k - 60k:
Kensington:
4.6% (197)
State:
5.7% (81,788)
Number of households with income $60k - 75k:
Kensington:
6.5% (279)
State:
8.1% (115,651)
Number of households with income $75k - 100k:
Kensington:
17.8% (765)
State:
12.6% (180,173)
Number of households with income $100k - 125k:
Kensington:
13.0% (559)
State:
9.9% (141,231)
Number of households with income $125k - 150k:
Kensington:
10.8% (462)
State:
7.9% (112,826)
Number of households with income $150k - 200k:
Kensington:
15.2% (652)
State:
10.8% (154,641)
Number of households with income > $200k:
Kensington:
9.7% (416)
State:
16.3% (233,133)
Aggregate household income in Kensington in 2022: $479,789,277
Median family income in Kensington in 2022:
Kensington:
$115,703
State:
$115,183
Number of families with income < $10k:
Kensington:
0.3% (10)
State:
2.6% (23,251)
Number of families with income $10k - 20k:
Kensington:
1.9% (56)
State:
2.8% (25,184)
Number of families with income $20k - 30k:
Kensington:
5.1% (153)
State:
4.1% (36,835)
Number of families with income $40k - 50k:
Kensington:
6.5% (195)
Connecticut:
4.8% (43,104)
Number of families with income $50k - 60k:
Kensington:
1.1% (33)
Connecticut:
4.8% (43,284)
Number of families with income $60k - 75k:
Kensington:
6.0% (179)
State:
7.4% (66,521)
Number of families with income $75k - 100k:
Kensington:
22.0% (658)
Connecticut:
12.9% (116,232)
Number of families with income $100k - 125k:
Kensington:
14.4% (430)
State:
10.6% (95,504)
Number of families with income $125k - 150k:
Kensington:
12.2% (364)
Connecticut:
9.5% (86,149)
Number of families with income $150k - 200k:
Kensington:
17.1% (511)
State:
14.0% (125,908)
Number of families with income > $200k:
Kensington:
13.3% (396)
State:
22.4% (202,515)
Median non-family income in Kensington in 2022:
Kensington:
$54,277
State:
$50,964
Change in median non-family income between 2000 and 2022:
Kensington, Connecticut:
+98.1%
State:
+65.1%
Median per capita income in Kensington in 2022:
Kensington:
$49,010
State:
$51,581
Change in median per capita income between 2000 and 2022:
Kensington, Connecticut:
+95.8%
State:
+79.3%
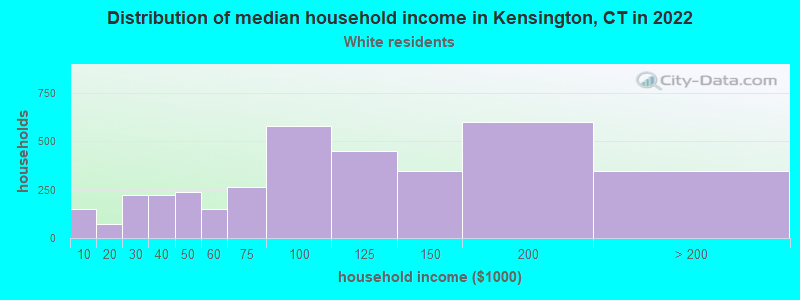
Income statistics for White residents
Median household income in Kensington, CT in 2022:
Kensington:
$96,467
Connecticut:
$96,890
Change in median household income between 2000 and 2022:
Kensington, Connecticut:
+60.0%
Connecticut:
+68.5%
Number of households with income < $10k:
Kensington:
4.1% (151)
State:
4.2% (42,265)
Number of households with income $10k - 20k:
Kensington:
2.0% (74)
State:
4.8% (48,323)
Number of households with income $20k - 30k:
Kensington:
6.1% (223)
State:
5.7% (57,716)
Number of households with income $30k - 40k:
Kensington:
6.1% (221)
State:
5.3% (53,827)
Number of households with income $40k - 50k:
Kensington:
6.6% (239)
State:
5.3% (53,301)
Number of households with income $50k - 60k:
Kensington:
4.1% (151)
Connecticut:
5.5% (55,690)
Number of households with income $60k - 75k:
Kensington:
7.3% (265)
State:
8.0% (80,329)
Number of households with income $75k - 100k:
Kensington:
15.8% (577)
State:
12.7% (128,070)
Number of households with income $100k - 125k:
Kensington:
12.3% (450)
State:
10.0% (101,210)
Number of households with income $125k - 150k:
Kensington:
9.6% (349)
State:
8.0% (81,250)
Number of households with income $150k - 200k:
Kensington:
16.5% (600)
State:
11.8% (119,527)
Number of households with income > $200k:
Kensington:
9.5% (345)
Connecticut:
18.6% (187,875)
Aggregate household income in Kensington in 2022: $393,082,107
Median family income in Kensington in 2022:
Kensington:
$116,659
Connecticut:
$128,955
Number of families with income < $10k:
Kensington:
0.4% (10)
Connecticut:
1.9% (11,537)
Number of families with income $10k - 20k:
Kensington:
2.3% (57)
Connecticut:
1.8% (11,289)
Number of families with income $20k - 30k:
Kensington:
5.6% (137)
State:
3.0% (18,506)
Number of families with income $40k - 50k:
Kensington:
7.4% (180)
Connecticut:
3.9% (24,550)
Number of families with income $50k - 60k:
Kensington:
1.3% (31)
State:
4.3% (26,723)
Number of families with income $60k - 75k:
Kensington:
7.0% (173)
Connecticut:
7.1% (44,075)
Number of families with income $75k - 100k:
Kensington:
19.0% (467)
State:
12.5% (77,679)
Number of families with income $100k - 125k:
Kensington:
14.3% (350)
State:
11.1% (69,086)
Number of families with income $125k - 150k:
Kensington:
10.3% (253)
Connecticut:
9.6% (59,616)
Number of families with income $150k - 200k:
Kensington:
19.1% (469)
State:
15.7% (97,890)
Number of families with income > $200k:
Kensington:
13.3% (326)
State:
26.3% (163,417)
Median non-family income in Kensington in 2022:
Kensington:
$53,166
State:
$54,067
Change in median non-family income between 2000 and 2022:
Kensington, Connecticut:
+92.0%
Connecticut:
+68.7%
Median per capita income in Kensington in 2022:
Kensington:
$49,689
State:
$59,916
Change in median per capita income between 2000 and 2022:
Kensington, Connecticut:
+94.6%
Connecticut:
+90.2%
Income statistics for Black or African American residents
Median per capita income in Kensington in 2022:
Kensington:
$118,553
Connecticut:
$36,289
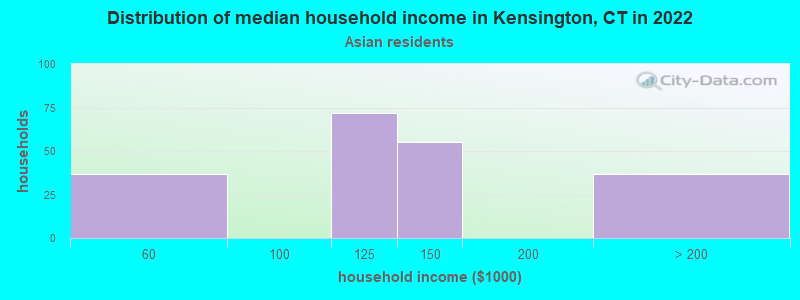
Income statistics for Asian residents
Median household income in Kensington, CT in 2022:
Kensington:
$113,579
Connecticut:
$110,568
Change in median household income between 2000 and 2022:
Kensington, Connecticut:
+68.3%
State:
+79.5%
Number of households with income < $10k:
Kensington:
0.0% (0)
Connecticut:
7.1% (4,245)
Number of households with income $10k - 20k:
Kensington:
0.0% (0)
Connecticut:
3.5% (2,087)
Number of households with income $20k - 30k:
Kensington:
0.0% (0)
State:
4.1% (2,464)
Number of households with income $30k - 40k:
Kensington:
0.0% (0)
Connecticut:
4.1% (2,478)
Number of households with income $40k - 50k:
Kensington:
0.0% (0)
State:
3.3% (1,983)
Number of households with income $50k - 60k:
Kensington:
18.4% (37)
State:
3.9% (2,328)
Number of households with income $60k - 75k:
Kensington:
0.0% (0)
State:
7.0% (4,228)
Number of households with income $75k - 100k:
Kensington:
0.0% (0)
State:
11.5% (6,911)
Number of households with income $100k - 125k:
Kensington:
35.8% (72)
Connecticut:
10.2% (6,127)
Number of households with income $125k - 150k:
Kensington:
27.4% (55)
Connecticut:
8.5% (5,079)
Number of households with income $150k - 200k:
Kensington:
0.0% (0)
State:
12.4% (7,434)
Number of households with income > $200k:
Kensington:
18.4% (37)
State:
24.4% (14,661)
Aggregate household income in Kensington in 2022: $27,430,439
Median family income in Kensington in 2022:
Kensington:
$126,585
Connecticut:
$134,548
Number of families with income $100k - 125k:
Kensington:
44.5% (71)
Connecticut:
10.5% (4,621)
Number of families with income $125k - 150k:
Kensington:
30.9% (49)
State:
8.2% (3,588)
Number of families with income > $200k:
Kensington:
24.6% (39)
State:
30.8% (13,522)
Median per capita income in Kensington in 2022:
Kensington:
$55,797
State:
$55,295
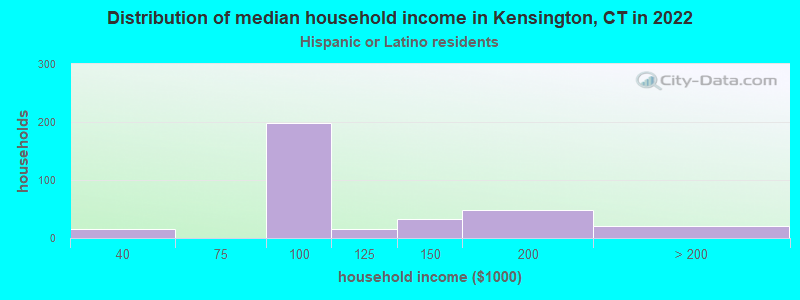
Income statistics for Hispanic or Latino residents
Median household income in Kensington, CT in 2022:
Kensington:
$97,836
State:
$60,275
Change in median household income between 2000 and 2022:
Kensington, Connecticut:
+82.0%
Connecticut:
+87.9%
Number of households with income < $10k:
Kensington:
0.0% (0)
State:
8.7% (18,584)
Number of households with income $10k - 20k:
Kensington:
0.0% (0)
State:
9.1% (19,235)
Number of households with income $20k - 30k:
Kensington:
0.0% (0)
Connecticut:
8.9% (18,989)
Number of households with income $30k - 40k:
Kensington:
4.6% (15)
State:
7.5% (15,967)
Number of households with income $40k - 50k:
Kensington:
0.0% (0)
State:
8.7% (18,466)
Number of households with income $50k - 60k:
Kensington:
0.0% (0)
Connecticut:
6.9% (14,706)
Number of households with income $60k - 75k:
Kensington:
0.0% (0)
State:
8.9% (18,888)
Number of households with income $75k - 100k:
Kensington:
60.2% (198)
State:
13.5% (28,669)
Number of households with income $100k - 125k:
Kensington:
4.6% (15)
State:
8.2% (17,434)
Number of households with income $125k - 150k:
Kensington:
10.0% (33)
State:
6.5% (13,752)
Number of households with income $150k - 200k:
Kensington:
14.6% (48)
State:
6.6% (14,114)
Number of households with income > $200k:
Kensington:
6.1% (20)
Connecticut:
6.4% (13,630)
Aggregate household income in Kensington in 2022: $38,470,166
Median family income in Kensington in 2022:
Kensington:
$100,218
State:
$68,336
Number of families with income $75k - 100k:
Kensington:
70.7% (192)
State:
14.3% (20,457)
Number of families with income $125k - 150k:
Kensington:
12.7% (34)
State:
8.2% (11,729)
Number of families with income $150k - 200k:
Kensington:
9.9% (27)
State:
7.1% (10,096)
Number of families with income > $200k:
Kensington:
6.8% (18)
Connecticut:
7.4% (10,622)
Median non-family income in Kensington in 2022:
Kensington:
$116,429
State:
$36,714
Median per capita income in Kensington in 2022:
Kensington:
$39,675
State:
$28,507
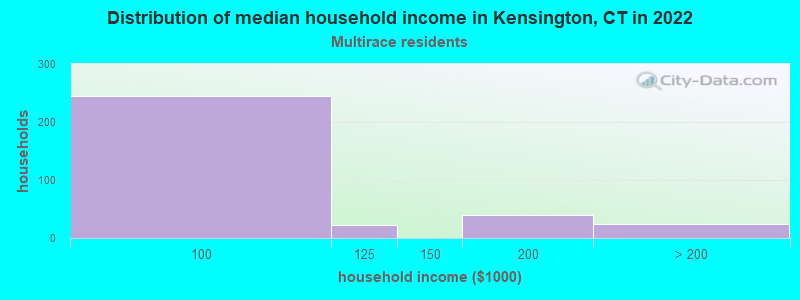
Income statistics for Multirace residents
Median household income in Kensington, CT in 2022:
Kensington:
$95,429
Connecticut:
$77,277
Change in median household income between 2000 and 2022:
Kensington, Connecticut:
+74.6%
State:
+113.6%
Number of households with income < $10k:
Kensington:
0.0% (0)
Connecticut:
6.0% (7,457)
Number of households with income $10k - 20k:
Kensington:
0.0% (0)
State:
8.1% (10,139)
Number of households with income $20k - 30k:
Kensington:
0.0% (0)
State:
7.0% (8,702)
Number of households with income $30k - 40k:
Kensington:
0.0% (0)
Connecticut:
6.9% (8,546)
Number of households with income $40k - 50k:
Kensington:
0.0% (0)
Connecticut:
7.0% (8,712)
Number of households with income $50k - 60k:
Kensington:
0.0% (0)
State:
5.9% (7,331)
Number of households with income $60k - 75k:
Kensington:
0.0% (0)
State:
8.5% (10,634)
Number of households with income $75k - 100k:
Kensington:
74.0% (245)
State:
14.1% (17,600)
Number of households with income $100k - 125k:
Kensington:
6.6% (22)
Connecticut:
9.9% (12,383)
Number of households with income $125k - 150k:
Kensington:
0.0% (0)
State:
7.2% (8,921)
Number of households with income $150k - 200k:
Kensington:
12.1% (40)
State:
8.8% (10,922)
Number of households with income > $200k:
Kensington:
7.3% (24)
State:
10.6% (13,247)
Aggregate household income in Kensington in 2022: $50,377,960
Median per capita income in Kensington in 2022:
Kensington:
$53,387
Connecticut:
$32,794
Income statistics for other residents
Number of households with income < $10k:
Kensington:
0.0% (0)
State:
9.0% (8,596)
Number of households with income $10k - 20k:
Kensington:
0.0% (0)
State:
10.2% (9,773)
Number of households with income $20k - 30k:
Kensington:
0.0% (0)
Connecticut:
9.1% (8,691)
Number of households with income $30k - 40k:
Kensington:
0.0% (0)
State:
7.8% (7,447)
Number of households with income $40k - 50k:
Kensington:
0.0% (0)
State:
8.2% (7,860)
Number of households with income $50k - 60k:
Kensington:
0.0% (0)
State:
6.0% (5,757)
Number of households with income $60k - 75k:
Kensington:
0.0% (0)
State:
9.3% (8,942)
Number of households with income $75k - 100k:
Kensington:
0.0% (0)
Connecticut:
14.3% (13,700)
Number of households with income $100k - 125k:
Kensington:
0.0% (0)
State:
7.2% (6,906)
Number of households with income $125k - 150k:
Kensington:
100.0% (44)
Connecticut:
6.5% (6,215)
Number of households with income $150k - 200k:
Kensington:
0.0% (0)
State:
6.1% (5,865)
Number of households with income > $200k:
Kensington:
0.0% (0)
State:
6.3% (6,065)
Median per capita income in Kensington in 2022:
Kensington:
$44,351
Connecticut:
$29,353
Change in median per capita income between 2000 and 2022:
Kensington, Connecticut:
+147.0%
State:
+165.8%
Discuss Kensington, Connecticut (CT) on our hugely popular Connecticut forum.