The median household income in Converse, TX in 2022 was $75,605, which was 4.4% greater than the median annual income of $72,284 across the entire state of Texas. Compared to the median income of $47,947 in 2000 this represents an increase of 36.6%. The per capita income in 2022 was $32,105, which means an increase of 41.0% compared to 2000 when it was $18,949.
Whole page based on the data from 2000 / 2022 when the population of Converse, Texas was 11,508 / 28,685
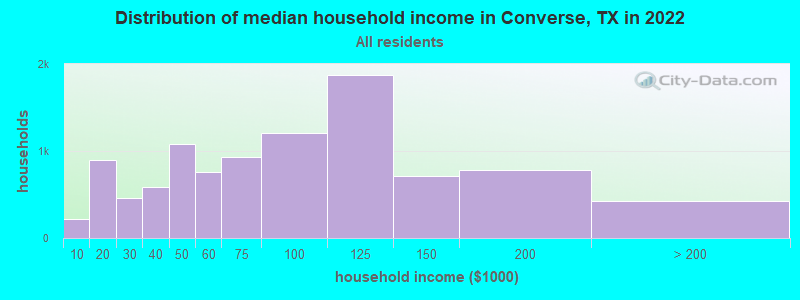
Income statistics for all residents
Median household income in Converse, TX in 2022:
Converse:
$75,606
State:
$72,284
Change in median household income between 2000 and 2022:
Converse, Texas:
+57.7%
Texas:
+81.0%
Number of households with income < $10k:
Converse:
2.2% (222)
State:
5.5% (611,011)
Number of households with income $10k - 20k:
Converse:
9.0% (891)
State:
6.7% (743,157)
Number of households with income $20k - 30k:
Converse:
4.6% (457)
State:
7.2% (803,381)
Number of households with income $30k - 40k:
Converse:
5.9% (590)
State:
7.8% (866,080)
Number of households with income $40k - 50k:
Converse:
10.9% (1,083)
State:
7.3% (810,440)
Number of households with income $50k - 60k:
Converse:
7.6% (754)
State:
7.2% (799,783)
Number of households with income $60k - 75k:
Converse:
9.4% (930)
Texas:
9.9% (1,095,384)
Number of households with income $75k - 100k:
Converse:
12.2% (1,211)
Texas:
12.8% (1,419,057)
Number of households with income $100k - 125k:
Converse:
18.9% (1,878)
State:
9.5% (1,054,577)
Number of households with income $125k - 150k:
Converse:
7.2% (711)
State:
6.7% (741,518)
Number of households with income $150k - 200k:
Converse:
7.9% (785)
State:
8.7% (961,776)
Number of households with income > $200k:
Converse:
4.3% (429)
State:
10.7% (1,181,544)
Aggregate household income in Converse in 2022: $891,403,447
Median family income in Converse in 2022:
Converse:
$94,874
Texas:
$86,267
Number of families with income < $10k:
Converse:
3.0% (211)
Texas:
4.0% (297,884)
Number of families with income $10k - 20k:
Converse:
7.7% (540)
Texas:
4.3% (324,514)
Number of families with income $20k - 30k:
Converse:
3.3% (236)
Texas:
5.8% (430,949)
Number of families with income $30k - 40k:
Converse:
5.3% (375)
Texas:
6.6% (493,535)
Number of families with income $40k - 50k:
Converse:
3.8% (267)
State:
6.7% (499,663)
Number of families with income $50k - 60k:
Converse:
9.1% (641)
State:
6.6% (492,203)
Number of families with income $60k - 75k:
Converse:
8.1% (570)
Texas:
9.5% (710,229)
Number of families with income $75k - 100k:
Converse:
13.8% (971)
State:
13.6% (1,015,480)
Number of families with income $100k - 125k:
Converse:
22.9% (1,615)
State:
10.7% (797,961)
Number of families with income $125k - 150k:
Converse:
8.7% (613)
Texas:
8.1% (602,985)
Number of families with income $150k - 200k:
Converse:
9.1% (642)
Texas:
10.7% (804,459)
Number of families with income > $200k:
Converse:
5.3% (371)
State:
13.5% (1,013,514)
Median non-family income in Converse in 2022:
Converse:
$46,683
State:
$45,999
Change in median non-family income between 2000 and 2022:
Converse, Texas:
+44.5%
State:
+79.5%
Median per capita income in Converse in 2022:
Converse:
$32,106
State:
$38,123
Change in median per capita income between 2000 and 2022:
Converse, Texas:
+69.4%
State:
+94.3%
Income statistics for White residents
Median household income in Converse, TX in 2022:
Converse:
$79,969
Texas:
$82,032
Change in median household income between 2000 and 2022:
Converse, Texas:
+61.0%
State:
+91.0%
Number of households with income < $10k:
Converse:
2.4% (97)
Texas:
4.7% (273,716)
Number of households with income $10k - 20k:
Converse:
9.0% (369)
State:
5.5% (322,702)
Number of households with income $20k - 30k:
Converse:
3.1% (126)
State:
6.2% (363,947)
Number of households with income $30k - 40k:
Converse:
2.9% (119)
State:
6.8% (399,275)
Number of households with income $40k - 50k:
Converse:
11.1% (454)
State:
6.5% (383,417)
Number of households with income $50k - 60k:
Converse:
8.8% (359)
State:
6.6% (388,535)
Number of households with income $60k - 75k:
Converse:
10.7% (440)
Texas:
9.7% (566,295)
Number of households with income $75k - 100k:
Converse:
11.3% (463)
State:
13.0% (760,276)
Number of households with income $100k - 125k:
Converse:
17.8% (729)
State:
10.2% (597,596)
Number of households with income $125k - 150k:
Converse:
8.1% (333)
State:
7.4% (436,830)
Number of households with income $150k - 200k:
Converse:
8.0% (328)
Texas:
9.9% (583,067)
Number of households with income > $200k:
Converse:
6.8% (277)
Texas:
13.5% (792,647)
Aggregate household income in Converse in 2022: $395,082,717
Median family income in Converse in 2022:
Converse:
$103,708
State:
$101,788
Number of families with income < $10k:
Converse:
2.3% (61)
State:
2.8% (108,142)
Number of families with income $10k - 20k:
Converse:
5.5% (145)
Texas:
2.9% (113,421)
Number of families with income $20k - 30k:
Converse:
1.5% (39)
Texas:
4.1% (157,688)
Number of families with income $30k - 40k:
Converse:
1.3% (36)
State:
5.2% (198,847)
Number of families with income $40k - 50k:
Converse:
2.9% (76)
State:
5.6% (216,490)
Number of families with income $50k - 60k:
Converse:
10.4% (276)
State:
5.7% (220,689)
Number of families with income $60k - 75k:
Converse:
11.0% (292)
State:
9.0% (346,106)
Number of families with income $75k - 100k:
Converse:
14.4% (383)
State:
13.7% (527,363)
Number of families with income $100k - 125k:
Converse:
21.1% (562)
Texas:
11.6% (448,411)
Number of families with income $125k - 150k:
Converse:
11.3% (299)
State:
9.2% (355,798)
Number of families with income $150k - 200k:
Converse:
9.2% (246)
Texas:
12.5% (480,185)
Number of families with income > $200k:
Converse:
9.1% (242)
State:
17.6% (677,490)
Median non-family income in Converse in 2022:
Converse:
$46,527
Texas:
$50,587
Change in median non-family income between 2000 and 2022:
Converse, Texas:
+42.7%
Texas:
+87.7%
Median per capita income in Converse in 2022:
Converse:
$37,116
Texas:
$47,740
Change in median per capita income between 2000 and 2022:
Converse, Texas:
+80.0%
Texas:
+114.3%
Income statistics for Black or African American residents
Median household income in Converse, TX in 2022:
Converse:
$94,820
State:
$55,759
Change in median household income between 2000 and 2022:
Converse, Texas:
+107.0%
State:
+90.3%
Number of households with income < $10k:
Converse:
4.5% (91)
Texas:
8.9% (126,378)
Number of households with income $10k - 20k:
Converse:
9.7% (194)
Texas:
9.9% (140,369)
Number of households with income $20k - 30k:
Converse:
10.3% (207)
State:
8.5% (120,639)
Number of households with income $30k - 40k:
Converse:
2.2% (44)
Texas:
9.7% (137,517)
Number of households with income $40k - 50k:
Converse:
3.9% (79)
State:
8.0% (112,973)
Number of households with income $50k - 60k:
Converse:
5.4% (108)
State:
8.3% (117,156)
Number of households with income $60k - 75k:
Converse:
5.9% (118)
State:
10.4% (147,462)
Number of households with income $75k - 100k:
Converse:
19.3% (387)
State:
11.5% (162,718)
Number of households with income $100k - 125k:
Converse:
20.1% (402)
State:
8.2% (115,829)
Number of households with income $125k - 150k:
Converse:
6.1% (123)
State:
4.9% (69,556)
Number of households with income $150k - 200k:
Converse:
9.5% (190)
State:
6.4% (90,701)
Number of households with income > $200k:
Converse:
2.9% (59)
State:
5.5% (77,988)
Aggregate household income in Converse in 2022: $200,887,632
Median family income in Converse in 2022:
Converse:
$79,478
State:
$69,134
Number of families with income < $10k:
Converse:
9.4% (134)
State:
6.8% (55,625)
Number of families with income $10k - 20k:
Converse:
8.9% (127)
State:
6.8% (55,300)
Number of families with income $20k - 30k:
Converse:
5.0% (71)
State:
7.1% (57,877)
Number of families with income $30k - 40k:
Converse:
3.3% (48)
Texas:
8.5% (68,776)
Number of families with income $40k - 50k:
Converse:
1.6% (22)
State:
7.1% (57,907)
Number of families with income $50k - 60k:
Converse:
3.6% (51)
Texas:
7.3% (59,511)
Number of families with income $60k - 75k:
Converse:
5.3% (75)
State:
10.1% (81,994)
Number of families with income $75k - 100k:
Converse:
16.8% (239)
State:
12.7% (103,723)
Number of families with income $100k - 125k:
Converse:
24.3% (345)
State:
9.4% (76,609)
Number of families with income $125k - 150k:
Converse:
7.0% (99)
Texas:
6.8% (55,615)
Number of families with income $150k - 200k:
Converse:
11.8% (169)
Texas:
9.4% (76,146)
Number of families with income > $200k:
Converse:
3.0% (43)
State:
7.9% (64,439)
Median non-family income in Converse in 2022:
Converse:
$59,087
State:
$40,133
Change in median non-family income between 2000 and 2022:
Converse, Texas:
+101.6%
Texas:
+102.2%
Median per capita income in Converse in 2022:
Converse:
$36,677
State:
$30,490
Change in median per capita income between 2000 and 2022:
Converse, Texas:
+112.2%
State:
+113.9%
Income statistics for Asian residents
Median household income in Converse, TX in 2022:
Converse:
$78,103
State:
$107,673
Change in median household income between 2000 and 2022:
Converse, Texas:
+33.5%
Texas:
+115.1%
Number of households with income < $10k:
Converse:
0.0% (0)
Texas:
5.2% (29,885)
Number of households with income $10k - 20k:
Converse:
1.9% (7)
State:
4.7% (27,044)
Number of households with income $20k - 30k:
Converse:
3.9% (14)
State:
4.1% (23,363)
Number of households with income $30k - 40k:
Converse:
5.0% (18)
State:
4.1% (23,309)
Number of households with income $40k - 50k:
Converse:
4.4% (16)
State:
5.2% (29,826)
Number of households with income $50k - 60k:
Converse:
12.7% (46)
State:
4.7% (26,512)
Number of households with income $60k - 75k:
Converse:
27.8% (101)
State:
6.5% (36,905)
Number of households with income $75k - 100k:
Converse:
8.5% (31)
Texas:
11.3% (64,350)
Number of households with income $100k - 125k:
Converse:
32.2% (117)
State:
11.4% (64,714)
Number of households with income $125k - 150k:
Converse:
3.6% (13)
State:
9.3% (52,719)
Number of households with income $150k - 200k:
Converse:
0.0% (0)
State:
12.5% (70,953)
Number of households with income > $200k:
Converse:
0.0% (0)
State:
21.1% (120,260)
Aggregate household income in Converse in 2022: $26,475,441
Median family income in Converse in 2022:
Converse:
$87,550
Texas:
$123,328
Number of families with income $20k - 30k:
Converse:
6.8% (15)
Texas:
3.4% (14,738)
Number of families with income $30k - 40k:
Converse:
8.4% (19)
Texas:
3.4% (15,033)
Number of families with income $50k - 60k:
Converse:
21.5% (48)
State:
4.7% (20,568)
Number of families with income $75k - 100k:
Converse:
10.7% (24)
Texas:
10.7% (46,626)
Number of families with income $100k - 125k:
Converse:
45.1% (100)
Texas:
11.3% (49,585)
Number of families with income $125k - 150k:
Converse:
7.5% (17)
State:
9.8% (43,043)
Median non-family income in Converse in 2022:
Converse:
$81,849
State:
$64,320
Median per capita income in Converse in 2022:
Converse:
$25,547
State:
$48,626
Change in median per capita income between 2000 and 2022:
Converse, Texas:
+31.8%
State:
+132.0%
Income statistics for Hispanic or Latino residents
Median household income in Converse, TX in 2022:
Converse:
$80,830
Texas:
$60,504
Change in median household income between 2000 and 2022:
Converse, Texas:
+79.3%
State:
+102.5%
Number of households with income < $10k:
Converse:
2.6% (103)
Texas:
5.8% (213,953)
Number of households with income $10k - 20k:
Converse:
3.2% (123)
State:
8.0% (297,456)
Number of households with income $20k - 30k:
Converse:
4.7% (182)
Texas:
9.2% (340,166)
Number of households with income $30k - 40k:
Converse:
9.5% (369)
Texas:
9.5% (354,336)
Number of households with income $40k - 50k:
Converse:
9.3% (362)
Texas:
8.8% (327,013)
Number of households with income $50k - 60k:
Converse:
8.3% (323)
State:
8.3% (308,818)
Number of households with income $60k - 75k:
Converse:
9.7% (377)
State:
10.9% (405,109)
Number of households with income $75k - 100k:
Converse:
12.0% (468)
State:
13.8% (511,639)
Number of households with income $100k - 125k:
Converse:
21.5% (840)
State:
8.6% (319,728)
Number of households with income $125k - 150k:
Converse:
7.1% (278)
State:
5.7% (210,932)
Number of households with income $150k - 200k:
Converse:
9.5% (372)
State:
6.4% (236,055)
Number of households with income > $200k:
Converse:
2.6% (102)
State:
5.1% (189,259)
Aggregate household income in Converse in 2022: $344,355,742
Median family income in Converse in 2022:
Converse:
$87,998
State:
$65,080
Number of families with income < $10k:
Converse:
3.9% (118)
State:
5.3% (147,493)
Number of families with income $10k - 20k:
Converse:
1.6% (48)
Texas:
6.3% (174,531)
Number of families with income $20k - 30k:
Converse:
4.0% (121)
Texas:
8.6% (238,528)
Number of families with income $30k - 40k:
Converse:
8.6% (259)
State:
9.1% (251,999)
Number of families with income $40k - 50k:
Converse:
4.3% (129)
Texas:
8.6% (240,188)
Number of families with income $50k - 60k:
Converse:
11.3% (341)
State:
8.0% (223,566)
Number of families with income $60k - 75k:
Converse:
9.6% (291)
Texas:
10.9% (302,688)
Number of families with income $75k - 100k:
Converse:
12.7% (383)
Texas:
14.3% (398,554)
Number of families with income $100k - 125k:
Converse:
24.1% (729)
State:
9.5% (264,007)
Number of families with income $125k - 150k:
Converse:
7.7% (234)
State:
6.2% (171,274)
Number of families with income $150k - 200k:
Converse:
8.8% (266)
State:
7.3% (202,259)
Number of families with income > $200k:
Converse:
3.4% (102)
Texas:
5.9% (165,129)
Median non-family income in Converse in 2022:
Converse:
$48,079
Texas:
$39,934
Change in median non-family income between 2000 and 2022:
Converse, Texas:
+56.4%
State:
+109.1%
Median per capita income in Converse in 2022:
Converse:
$26,524
State:
$24,862
Change in median per capita income between 2000 and 2022:
Converse, Texas:
+101.7%
Texas:
+130.8%
Income statistics for American Indian and Alaska Native residents
Median household income in Converse, TX in 2022:
Converse:
$126,507
State:
$65,765
Number of households with income < $10k:
Converse:
0.0% (0)
Texas:
4.1% (3,398)
Number of households with income $10k - 20k:
Converse:
0.0% (0)
Texas:
8.3% (6,949)
Number of households with income $20k - 30k:
Converse:
7.7% (15)
State:
9.3% (7,742)
Number of households with income $30k - 40k:
Converse:
21.1% (41)
State:
9.1% (7,627)
Number of households with income $40k - 50k:
Converse:
0.0% (0)
State:
7.1% (5,922)
Number of households with income $50k - 60k:
Converse:
0.0% (0)
State:
8.1% (6,761)
Number of households with income $60k - 75k:
Converse:
2.6% (5)
State:
12.7% (10,588)
Number of households with income $75k - 100k:
Converse:
4.1% (8)
State:
13.0% (10,903)
Number of households with income $100k - 125k:
Converse:
37.6% (73)
State:
9.9% (8,256)
Number of households with income $125k - 150k:
Converse:
26.8% (52)
State:
5.2% (4,355)
Number of households with income $150k - 200k:
Converse:
0.0% (0)
State:
6.7% (5,623)
Number of households with income > $200k:
Converse:
0.0% (0)
Texas:
6.6% (5,522)
Aggregate household income in Converse in 2022: $17,818,322
Median family income in Converse in 2022:
Converse:
$119,058
Texas:
$72,369
Number of families with income $20k - 30k:
Converse:
9.5% (14)
State:
7.3% (4,502)
Number of families with income $60k - 75k:
Converse:
2.9% (4)
State:
12.1% (7,429)
Number of families with income $75k - 100k:
Converse:
5.1% (7)
State:
14.4% (8,852)
Number of families with income $100k - 125k:
Converse:
45.7% (66)
Texas:
11.4% (6,997)
Number of families with income $125k - 150k:
Converse:
36.8% (53)
State:
7.5% (4,609)
Median per capita income in Converse in 2022:
Converse:
$47,289
State:
$28,166
Change in median per capita income between 2000 and 2022:
Converse, Texas:
+3.0%
State:
+77.2%
Income statistics for Multirace residents
Median household income in Converse, TX in 2022:
Converse:
$78,052
State:
$62,748
Change in median household income between 2000 and 2022:
Converse, Texas:
+105.8%
State:
+92.3%
Number of households with income < $10k:
Converse:
0.0% (0)
State:
5.5% (122,324)
Number of households with income $10k - 20k:
Converse:
7.6% (148)
State:
8.2% (182,232)
Number of households with income $20k - 30k:
Converse:
2.6% (50)
State:
8.5% (189,456)
Number of households with income $30k - 40k:
Converse:
13.9% (273)
State:
8.9% (197,499)
Number of households with income $40k - 50k:
Converse:
11.3% (222)
State:
8.7% (191,735)
Number of households with income $50k - 60k:
Converse:
4.9% (95)
State:
8.0% (177,535)
Number of households with income $60k - 75k:
Converse:
6.2% (122)
Texas:
10.5% (232,479)
Number of households with income $75k - 100k:
Converse:
13.3% (261)
State:
13.1% (290,448)
Number of households with income $100k - 125k:
Converse:
22.3% (436)
State:
8.6% (191,595)
Number of households with income $125k - 150k:
Converse:
6.8% (134)
State:
6.0% (133,361)
Number of households with income $150k - 200k:
Converse:
9.5% (185)
State:
7.2% (159,195)
Number of households with income > $200k:
Converse:
1.6% (31)
Texas:
6.7% (148,064)
Aggregate household income in Converse in 2022: $177,814,097
Median family income in Converse in 2022:
Converse:
$104,477
State:
$69,780
Number of families with income $20k - 30k:
Converse:
4.3% (61)
State:
7.8% (126,627)
Number of families with income $30k - 40k:
Converse:
14.4% (202)
State:
8.5% (137,626)
Number of families with income $40k - 50k:
Converse:
3.9% (55)
State:
8.4% (135,809)
Number of families with income $50k - 60k:
Converse:
6.8% (95)
Texas:
7.9% (127,739)
Number of families with income $60k - 75k:
Converse:
2.8% (39)
State:
10.5% (169,549)
Number of families with income $75k - 100k:
Converse:
13.9% (196)
State:
14.0% (226,284)
Number of families with income $100k - 125k:
Converse:
32.2% (452)
State:
9.5% (153,597)
Number of families with income $125k - 150k:
Converse:
8.1% (114)
State:
6.7% (107,900)
Number of families with income $150k - 200k:
Converse:
11.3% (159)
Texas:
8.5% (137,607)
Number of families with income > $200k:
Converse:
2.2% (31)
Texas:
7.9% (127,299)
Median non-family income in Converse in 2022:
Converse:
$48,445
State:
$40,634
Median per capita income in Converse in 2022:
Converse:
$26,132
Texas:
$26,785
Change in median per capita income between 2000 and 2022:
Converse, Texas:
+93.5%
Texas:
+110.9%
Income statistics for other residents
Median household income in Converse, TX in 2022:
Converse:
$44,411
State:
$57,114
Number of households with income < $10k:
Converse:
0.0% (0)
Texas:
5.9% (54,162)
Number of households with income $10k - 20k:
Converse:
4.9% (45)
Texas:
6.8% (62,891)
Number of households with income $20k - 30k:
Converse:
6.2% (57)
State:
10.6% (97,294)
Number of households with income $30k - 40k:
Converse:
22.1% (205)
State:
10.8% (99,670)
Number of households with income $40k - 50k:
Converse:
22.7% (210)
State:
9.3% (85,548)
Number of households with income $50k - 60k:
Converse:
10.4% (96)
Texas:
9.0% (82,757)
Number of households with income $60k - 75k:
Converse:
5.6% (52)
Texas:
10.9% (100,326)
Number of households with income $75k - 100k:
Converse:
6.4% (59)
State:
14.0% (128,767)
Number of households with income $100k - 125k:
Converse:
14.8% (137)
State:
8.2% (75,218)
Number of households with income $125k - 150k:
Converse:
1.1% (10)
State:
4.8% (44,223)
Number of households with income $150k - 200k:
Converse:
0.0% (0)
Texas:
5.6% (51,376)
Number of households with income > $200k:
Converse:
5.9% (55)
State:
4.0% (36,393)
Aggregate household income in Converse in 2022: $57,921,334
Median family income in Converse in 2022:
Converse:
$42,189
Texas:
$60,064
Number of families with income < $10k:
Converse:
3.4% (25)
State:
6.8% (47,502)
Number of families with income $10k - 20k:
Converse:
6.6% (50)
State:
6.0% (41,763)
Number of families with income $20k - 30k:
Converse:
7.3% (55)
State:
9.9% (68,761)
Number of families with income $30k - 40k:
Converse:
19.5% (146)
State:
9.7% (67,685)
Number of families with income $40k - 50k:
Converse:
14.2% (106)
State:
9.0% (62,441)
Number of families with income $50k - 60k:
Converse:
15.1% (113)
Texas:
8.5% (59,321)
Number of families with income $60k - 75k:
Converse:
7.1% (53)
State:
11.2% (77,588)
Number of families with income $75k - 100k:
Converse:
7.1% (53)
State:
14.5% (101,032)
Number of families with income $100k - 125k:
Converse:
13.4% (100)
State:
8.8% (61,439)
Number of families with income > $200k:
Converse:
6.3% (47)
Texas:
4.5% (31,243)
Median non-family income in Converse in 2022:
Converse:
$41,413
Texas:
$38,690
Change in median non-family income between 2000 and 2022:: -31.3%
Converse, Texas:
-31.3%
Texas:
+90.2%
Median per capita income in Converse in 2022:
Converse:
$20,668
State:
$23,899
Change in median per capita income between 2000 and 2022:
Converse, Texas:
+93.5%
Texas:
+135.2%
Discuss Converse, Texas (TX) on our hugely popular Texas forum.