Bedford, Massachusetts (MA) income map, earnings map, and wages data
The median household income in Bedford, MA in 2022 was $171,813, which was 45.0% greater than the median annual income of $94,488 across the entire state of Massachusetts. Compared to the median income of $87,962 in 2000 this represents an increase of 48.8%. The per capita income in 2022 was $81,411, which means an increase of 51.8% compared to 2000 when it was $39,212.
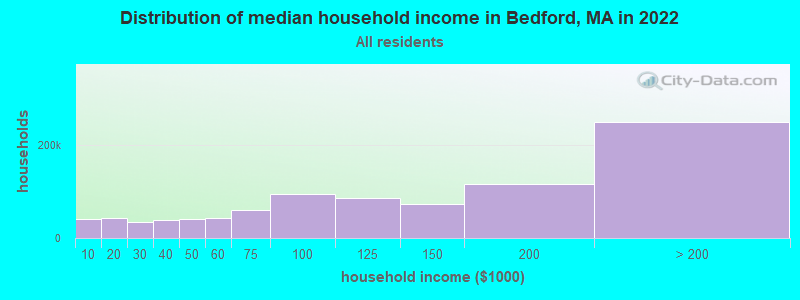
Income statistics for all residents
Median household income in Bedford, MA in 2022:| Bedford: | $171,814 |
| State: | $94,488 |
Change in median household income between 2000 and 2022:| Bedford, Massachusetts: | +95.3% |
| State: | +87.1% |
Number of households with income < $10k:| Bedford: | 4.5% (41,292) |
| State: | 5.2% (146,170) |
Number of households with income $10k - 20k:| Bedford: | 4.7% (43,678) |
| State: | 6.4% (180,001) |
Number of households with income $20k - 30k:| Bedford: | 3.8% (34,966) |
| State: | 5.6% (156,667) |
Number of households with income $30k - 40k:| Bedford: | 4.2% (38,761) |
| State: | 5.6% (157,168) |
Number of households with income $40k - 50k:| Bedford: | 4.5% (41,295) |
| Massachusetts: | 5.4% (151,455) |
Number of households with income $50k - 60k:| Bedford: | 4.6% (42,893) |
| Massachusetts: | 5.1% (142,726) |
Number of households with income $60k - 75k:| Bedford: | 6.5% (60,016) |
| State: | 7.6% (212,203) |
Number of households with income $75k - 100k:| Bedford: | 10.2% (93,947) |
| State: | 11.3% (317,064) |
Number of households with income $100k - 125k:| Bedford: | 9.4% (87,146) |
| State: | 9.7% (270,603) |
Number of households with income $125k - 150k:| Bedford: | 7.9% (72,588) |
| State: | 8.0% (223,140) |
Number of households with income $150k - 200k:| Bedford: | 12.6% (116,603) |
| State: | 11.0% (308,695) |
Number of households with income > $200k:| Bedford: | 27.1% (249,833) |
| Massachusetts: | 19.0% (531,884) |
Aggregate household income in Bedford in 2022: $23,426,089,519
Median family income in Bedford in 2022:| Bedford: | $205,629 |
| State: | $120,263 |
Median non-family income in Bedford in 2022:| Bedford: | $86,409 |
| State: | $55,979 |
Change in median non-family income between 2000 and 2022:| Bedford, Massachusetts: | +94.2% |
| State: | +88.0% |
Median per capita income in Bedford in 2022:| Bedford: | $81,411 |
| State: | $54,025 |
Change in median per capita income between 2000 and 2022:| Bedford, Massachusetts: | +107.6% |
| Massachusetts: | +108.2% |
Income statistics for White residents
Median household income in Bedford, MA in 2022:| Bedford: | $169,997 |
| Massachusetts: | $101,391 |
Change in median household income between 2000 and 2022:| Bedford, Massachusetts: | +98.2% |
| Massachusetts: | +93.3% |
Number of households with income < $10k:| Bedford: | 3.9% (24,818) |
| Massachusetts: | 4.4% (91,120) |
Number of households with income $10k - 20k:| Bedford: | 4.7% (30,254) |
| State: | 5.9% (122,055) |
Number of households with income $20k - 30k:| Bedford: | 3.8% (24,415) |
| Massachusetts: | 5.1% (105,311) |
Number of households with income $30k - 40k:| Bedford: | 4.2% (27,218) |
| State: | 5.3% (110,239) |
Number of households with income $40k - 50k:| Bedford: | 4.0% (25,851) |
| State: | 5.0% (104,636) |
Number of households with income $50k - 60k:| Bedford: | 4.3% (27,774) |
| Massachusetts: | 4.8% (99,486) |
Number of households with income $60k - 75k:| Bedford: | 6.6% (42,326) |
| State: | 7.5% (155,124) |
Number of households with income $75k - 100k:| Bedford: | 10.1% (65,145) |
| State: | 11.4% (236,252) |
Number of households with income $100k - 125k:| Bedford: | 8.8% (56,566) |
| State: | 9.9% (204,731) |
Number of households with income $125k - 150k:| Bedford: | 8.1% (52,245) |
| State: | 8.5% (175,324) |
Number of households with income $150k - 200k:| Bedford: | 13.2% (85,167) |
| Massachusetts: | 11.7% (242,980) |
Number of households with income > $200k:| Bedford: | 28.2% (181,194) |
| State: | 20.5% (425,966) |
Aggregate household income in Bedford in 2022: $15,843,512,755
Median family income in Bedford in 2022:| Bedford: | $213,627 |
| Massachusetts: | $133,153 |
Number of families with income < $10k:| Bedford: | 0.4% (14) |
| Massachusetts: | 2.0% (25,038) |
Number of families with income $10k - 20k:| Bedford: | 0.6% (21) |
| State: | 2.1% (26,403) |
Number of families with income $20k - 30k:| Bedford: | 0.6% (21) |
| State: | 2.6% (32,525) |
Number of families with income $30k - 40k:| Bedford: | 1.3% (44) |
| State: | 3.9% (48,079) |
Number of families with income $40k - 50k:| Bedford: | 1.2% (41) |
| State: | 3.8% (46,908) |
Number of families with income $50k - 60k:| Bedford: | 2.5% (84) |
| Massachusetts: | 3.8% (46,476) |
Number of families with income $60k - 75k:| Bedford: | 3.4% (115) |
| State: | 6.4% (79,040) |
Number of families with income $75k - 100k:| Bedford: | 7.2% (242) |
| Massachusetts: | 11.1% (137,395) |
Number of families with income $100k - 125k:| Bedford: | 10.9% (365) |
| State: | 11.1% (136,771) |
Number of families with income $125k - 150k:| Bedford: | 16.3% (548) |
| Massachusetts: | 10.0% (123,709) |
Number of families with income $150k - 200k:| Bedford: | 18.2% (612) |
| Massachusetts: | 14.7% (181,602) |
Number of families with income > $200k:| Bedford: | 37.3% (1,255) |
| State: | 28.5% (351,887) |
Median non-family income in Bedford in 2022:| Bedford: | $85,214 |
| Massachusetts: | $59,323 |
Change in median non-family income between 2000 and 2022:| Bedford, Massachusetts: | +90.7% |
| State: | +94.3% |
Median per capita income in Bedford in 2022:| Bedford: | $82,612 |
| State: | $60,804 |
Change in median per capita income between 2000 and 2022:| Bedford, Massachusetts: | +117.3% |
| State: | +118.7% |
Income statistics for Black or African American residents
Median household income in Bedford, MA in 2022:| Bedford: | $174,370 |
| State: | $63,189 |
Change in median household income between 2000 and 2022:| Bedford, Massachusetts: | +92.0% |
| State: | +87.4% |
Number of households with income < $10k:| Bedford: | 5.7% (3,295) |
| State: | 9.1% (15,797) |
Number of households with income $10k - 20k:| Bedford: | 7.1% (4,134) |
| Massachusetts: | 9.4% (16,267) |
Number of households with income $20k - 30k:| Bedford: | 4.3% (2,513) |
| Massachusetts: | 7.8% (13,520) |
Number of households with income $30k - 40k:| Bedford: | 6.4% (3,742) |
| State: | 8.3% (14,412) |
Number of households with income $40k - 50k:| Bedford: | 9.6% (5,564) |
| State: | 7.9% (13,790) |
Number of households with income $50k - 60k:| Bedford: | 5.7% (3,308) |
| Massachusetts: | 5.8% (10,041) |
Number of households with income $60k - 75k:| Bedford: | 8.9% (5,185) |
| State: | 8.5% (14,822) |
Number of households with income $75k - 100k:| Bedford: | 13.0% (7,550) |
| State: | 11.0% (19,122) |
Number of households with income $100k - 125k:| Bedford: | 8.1% (4,713) |
| State: | 8.4% (14,575) |
Number of households with income $125k - 150k:| Bedford: | 6.7% (3,904) |
| State: | 6.0% (10,429) |
Number of households with income $150k - 200k:| Bedford: | 11.2% (6,497) |
| State: | 7.2% (12,539) |
Number of households with income > $200k:| Bedford: | 13.3% (7,705) |
| Massachusetts: | 10.5% (18,185) |
Aggregate household income in Bedford in 2022: $56,707,908
Median family income in Bedford in 2022:| Bedford: | $211,945 |
| Massachusetts: | $79,815 |
Number of families with income $60k - 75k:| Bedford: | 2.7% (3) |
| State: | 7.9% (8,699) |
Number of families with income $75k - 100k:| Bedford: | 31.6% (40) |
| State: | 11.5% (12,654) |
Number of families with income $150k - 200k:| Bedford: | 65.7% (83) |
| State: | 9.3% (10,230) |
Median non-family income in Bedford in 2022:| Bedford: | $80,019 |
| State: | $38,934 |
Change in median non-family income between 2000 and 2022:| Bedford, Massachusetts: | +71.5% |
| State: | +69.2% |
Median per capita income in Bedford in 2022:| Bedford: | $245,666 |
| State: | $33,524 |
Change in median per capita income between 2000 and 2022:| Bedford, Massachusetts: | +98.1% |
| Massachusetts: | +109.4% |
Income statistics for Asian residents
Median household income in Bedford, MA in 2022:| Bedford: | $249,256 |
| State: | $117,855 |
Change in median household income between 2000 and 2022:| Bedford, Massachusetts: | +108.1% |
| Massachusetts: | +129.9% |
Number of households with income < $10k:| Bedford: | 6.0% (8,848) |
| State: | 6.8% (11,982) |
Number of households with income $10k - 20k:| Bedford: | 3.1% (4,567) |
| State: | 4.8% (8,376) |
Number of households with income $20k - 30k:| Bedford: | 1.9% (2,863) |
| Massachusetts: | 3.7% (6,558) |
Number of households with income $30k - 40k:| Bedford: | 2.4% (3,521) |
| Massachusetts: | 3.3% (5,748) |
Number of households with income $40k - 50k:| Bedford: | 4.4% (6,434) |
| Massachusetts: | 4.1% (7,192) |
Number of households with income $50k - 60k:| Bedford: | 4.3% (6,351) |
| State: | 5.0% (8,734) |
Number of households with income $60k - 75k:| Bedford: | 4.5% (6,610) |
| Massachusetts: | 5.8% (10,203) |
Number of households with income $75k - 100k:| Bedford: | 7.9% (11,681) |
| State: | 8.6% (15,154) |
Number of households with income $100k - 125k:| Bedford: | 13.0% (19,154) |
| Massachusetts: | 10.8% (18,942) |
Number of households with income $125k - 150k:| Bedford: | 8.3% (12,224) |
| State: | 8.0% (14,037) |
Number of households with income $150k - 200k:| Bedford: | 11.1% (16,358) |
| Massachusetts: | 12.5% (21,856) |
Number of households with income > $200k:| Bedford: | 32.9% (48,424) |
| State: | 26.6% (46,694) |
Aggregate household income in Bedford in 2022: $189,964,570
Median family income in Bedford in 2022:| Bedford: | $334,432 |
| State: | $140,113 |
Number of families with income $30k - 40k:| Bedford: | 0.4% (5) |
| State: | 2.8% (3,234) |
Number of families with income $50k - 60k:| Bedford: | 0.8% (11) |
| State: | 3.9% (4,606) |
Number of families with income $75k - 100k:| Bedford: | 2.0% (27) |
| State: | 8.5% (10,022) |
Number of families with income $100k - 125k:| Bedford: | 7.3% (100) |
| Massachusetts: | 10.0% (11,697) |
Number of families with income $150k - 200k:| Bedford: | 3.6% (49) |
| Massachusetts: | 13.2% (15,478) |
Number of families with income > $200k:| Bedford: | 86.0% (1,172) |
| State: | 34.0% (39,856) |
Median non-family income in Bedford in 2022:| Bedford: | $23,359 |
| State: | $71,440 |
Change in median non-family income between 2000 and 2022:| Bedford, Massachusetts: | +119.9% |
| State: | +128.0% |
Median per capita income in Bedford in 2022:| Bedford: | $118,167 |
| State: | $58,900 |
Income statistics for Hispanic or Latino residents
Median household income in Bedford, MA in 2022:| Bedford: | $32,737 |
| State: | $61,523 |
Change in median household income between 2000 and 2022:| Bedford, Massachusetts: | +138.1% |
| Massachusetts: | +125.4% |
Number of households with income < $10k:| Bedford: | 6.6% (985) |
| Massachusetts: | 8.8% (25,307) |
Number of households with income $10k - 20k:| Bedford: | 7.1% (1,053) |
| State: | 10.0% (28,653) |
Number of households with income $20k - 30k:| Bedford: | 6.0% (900) |
| Massachusetts: | 8.8% (25,189) |
Number of households with income $30k - 40k:| Bedford: | 3.4% (505) |
| State: | 7.2% (20,822) |
Number of households with income $40k - 50k:| Bedford: | 6.4% (952) |
| State: | 7.2% (20,817) |
Number of households with income $50k - 60k:| Bedford: | 6.1% (916) |
| Massachusetts: | 6.5% (18,748) |
Number of households with income $60k - 75k:| Bedford: | 6.3% (940) |
| Massachusetts: | 8.8% (25,390) |
Number of households with income $75k - 100k:| Bedford: | 11.4% (1,705) |
| Massachusetts: | 12.0% (34,488) |
Number of households with income $100k - 125k:| Bedford: | 10.6% (1,579) |
| Massachusetts: | 8.6% (24,599) |
Number of households with income $125k - 150k:| Bedford: | 7.5% (1,118) |
| State: | 6.2% (17,743) |
Number of households with income $150k - 200k:| Bedford: | 11.4% (1,700) |
| State: | 7.3% (21,017) |
Number of households with income > $200k:| Bedford: | 17.2% (2,565) |
| Massachusetts: | 8.6% (24,606) |
Aggregate household income in Bedford in 2022: $7,330,653
Median family income in Bedford in 2022:| Bedford: | $22,127 |
| State: | $66,072 |
Number of families with income < $10k:| Bedford: | 0.2% (1) |
| State: | 6.2% (12,456) |
Number of families with income $10k - 20k:| Bedford: | 1.7% (5) |
| State: | 6.0% (12,071) |
Number of families with income $20k - 30k:| Bedford: | 2.0% (6) |
| State: | 10.1% (20,376) |
Number of families with income $30k - 40k:| Bedford: | 2.2% (7) |
| Massachusetts: | 8.2% (16,470) |
Number of families with income $40k - 50k:| Bedford: | 3.6% (11) |
| Massachusetts: | 7.4% (14,829) |
Number of families with income $50k - 60k:| Bedford: | 7.3% (23) |
| State: | 7.3% (14,643) |
Number of families with income $60k - 75k:| Bedford: | 7.4% (23) |
| Massachusetts: | 10.6% (21,252) |
Number of families with income $75k - 100k:| Bedford: | 11.8% (37) |
| Massachusetts: | 12.0% (24,088) |
Number of families with income $100k - 125k:| Bedford: | 14.3% (44) |
| Massachusetts: | 8.9% (17,954) |
Number of families with income $125k - 150k:| Bedford: | 14.8% (46) |
| State: | 6.9% (13,837) |
Number of families with income $150k - 200k:| Bedford: | 14.2% (44) |
| Massachusetts: | 7.3% (14,683) |
Number of families with income > $200k:| Bedford: | 20.4% (63) |
| State: | 9.3% (18,741) |
Median non-family income in Bedford in 2022:| Bedford: | $52,002 |
| Massachusetts: | $37,563 |
Change in median non-family income between 2000 and 2022:| Bedford, Massachusetts: | +98.1% |
| State: | +115.0% |
Median per capita income in Bedford in 2022:| Bedford: | $30,396 |
| State: | $28,993 |
Change in median per capita income between 2000 and 2022:| Bedford, Massachusetts: | +142.9% |
| Massachusetts: | +142.4% |
Income statistics for Multirace residents
Median household income in Bedford, MA in 2022:| Bedford: | $222,423 |
| State: | $71,552 |
Change in median household income between 2000 and 2022:| Bedford, Massachusetts: | +146.3% |
| State: | +109.0% |
Number of households with income < $10k:| Bedford: | 5.4% (5,287) |
| State: | 6.6% (15,127) |
Number of households with income $10k - 20k:| Bedford: | 6.0% (5,907) |
| State: | 9.2% (21,158) |
Number of households with income $20k - 30k:| Bedford: | 2.8% (2,785) |
| State: | 7.8% (18,016) |
Number of households with income $30k - 40k:| Bedford: | 6.0% (5,936) |
| Massachusetts: | 7.9% (18,260) |
Number of households with income $40k - 50k:| Bedford: | 4.1% (4,047) |
| State: | 5.6% (13,027) |
Number of households with income $50k - 60k:| Bedford: | 5.9% (5,791) |
| State: | 5.6% (12,909) |
Number of households with income $60k - 75k:| Bedford: | 6.7% (6,527) |
| State: | 9.0% (20,800) |
Number of households with income $75k - 100k:| Bedford: | 12.9% (12,698) |
| Massachusetts: | 12.1% (27,875) |
Number of households with income $100k - 125k:| Bedford: | 10.8% (10,549) |
| State: | 8.1% (18,754) |
Number of households with income $125k - 150k:| Bedford: | 6.4% (6,247) |
| State: | 6.8% (15,621) |
Number of households with income $150k - 200k:| Bedford: | 12.8% (12,587) |
| Massachusetts: | 9.4% (21,618) |
Number of households with income > $200k:| Bedford: | 20.1% (19,769) |
| State: | 12.0% (27,592) |
Aggregate household income in Bedford in 2022: $13,777,803
Median family income in Bedford in 2022:| Bedford: | $205,082 |
| State: | $78,380 |
Number of families with income $30k - 40k:| Bedford: | 29.6% (31) |
| Massachusetts: | 8.2% (12,705) |
Number of families with income $75k - 100k:| Bedford: | 70.4% (74) |
| Massachusetts: | 12.1% (18,758) |
Median per capita income in Bedford in 2022:| Bedford: | $33,081 |
| State: | $34,029 |
Change in median per capita income between 2000 and 2022:| Bedford, Massachusetts: | +116.4% |
| State: | +132.1% |
Income statistics for other residents
Number of households with income < $10k:| Bedford: | 9.0% (8) |
| State: | 8.4% (11,559) |
Number of households with income $10k - 20k:| Bedford: | 5.6% (5) |
| State: | 8.4% (11,499) |
Number of households with income $20k - 30k:| Bedford: | 11.2% (10) |
| State: | 9.5% (13,070) |
Number of households with income $30k - 40k:| Bedford: | 3.4% (3) |
| Massachusetts: | 6.0% (8,291) |
Number of households with income $40k - 50k:| Bedford: | 9.0% (8) |
| State: | 9.2% (12,611) |
Number of households with income $50k - 60k:| Bedford: | 9.0% (8) |
| State: | 7.9% (10,879) |
Number of households with income $60k - 75k:| Bedford: | 7.9% (7) |
| State: | 7.5% (10,239) |
Number of households with income $75k - 100k:| Bedford: | 10.1% (9) |
| State: | 13.1% (18,032) |
Number of households with income $100k - 125k:| Bedford: | 10.1% (9) |
| Massachusetts: | 9.6% (13,141) |
Number of households with income $125k - 150k:| Bedford: | 5.6% (5) |
| State: | 5.0% (6,808) |
Number of households with income $150k - 200k:| Bedford: | 5.6% (5) |
| Massachusetts: | 6.4% (8,843) |
Number of households with income > $200k:| Bedford: | 13.5% (12) |
| State: | 9.0% (12,396) |
Aggregate household income in Bedford in 2022: $10,906,768
Median family income in Bedford in 2022:| Bedford: | $266,053 |
| Massachusetts: | $66,840 |
Number of families with income $125k - 150k:| Bedford: | 100.0% (72) |
| State: | 5.3% (5,373) |
Median per capita income in Bedford in 2022:| Bedford: | $159,413 |
| State: | $30,797 |