Housing density: 546 houses/condos per square mile
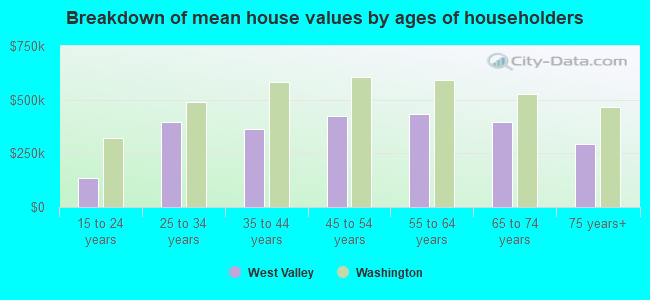
Median price asked for vacant for-sale houses and condos in 2022 in this county: $337,394.
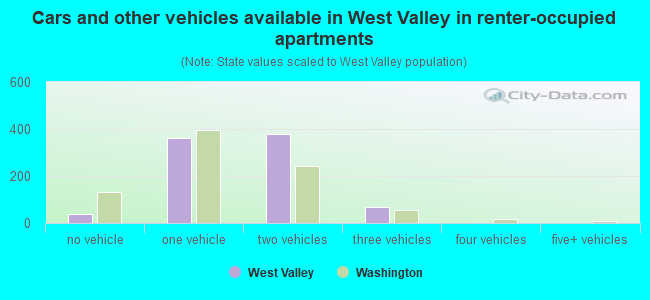
Median contract rent in 2022: $1,259 (lower quartile is $1,089, upper quartile is $1,426)
Median rent asked for vacant for-rent units in 2022: $1,325
Median gross rent in West Valley, WA in 2022: $1,415
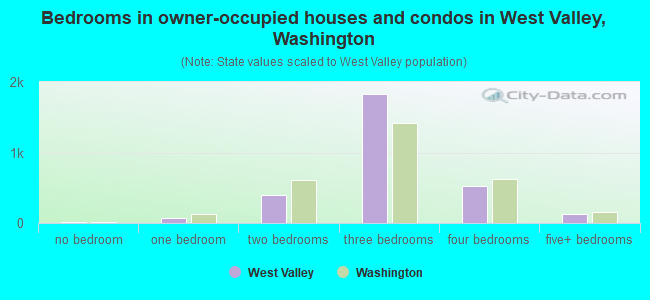
Housing units in West Valley with a mortgage: 1,947 (206 second mortgage, 252 home equity loan, 0 both second mortgage and home equity loan) Houses without a mortgage: 471
Compare current foreclosures near West Valley, WA:
In family households: 212,086 (40,296 male householders, 18,494 female householders)
41,426 spouses, 81,860 children (76,456 natural, 1,715 adopted, 3,689 stepchildren), 7,772 grandchildren, 3,380 brothers or sisters, 2,349 parents, foster children, 5,388 other relatives, 8,861 non-relatives
In nonfamily households: 27,660 (10,578 male householders (7,947 living alone)), 11,224 female householders (9,478 living alone)), 5,858 nonrelatives
In group quarters: 3,485 (2,533 institutionalized population)
44,742 married couples with children.
16,953 single-parent households (4,329 men, 12,624 women).
93.0% of residents of West Valley speak English at home.
4.6% of residents speak Spanish at home (88% speak English very well, 7% speak English well, 5% speak English not well).
1.1% of residents speak other Indo-European language at home (82% speak English very well, 18% speak English well).
1.2% of residents speak Asian or Pacific Island language at home (52% speak English very well, 22% speak English well, 26% speak English not well).
0.1% of residents speak other language at home (100% speak English very well).
Foreign born population: 539 (4.6%)
(64.2% of them are naturalized citizens)
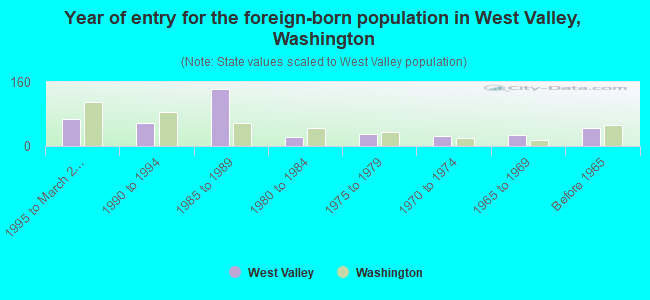
Year of entry for the foreign-born population in West Valley, Washington
671995 to March 2000
581990 to 1994
1431985 to 1989
231980 to 1984
301975 to 1979
251970 to 1974
271965 to 1969
46Before 1965
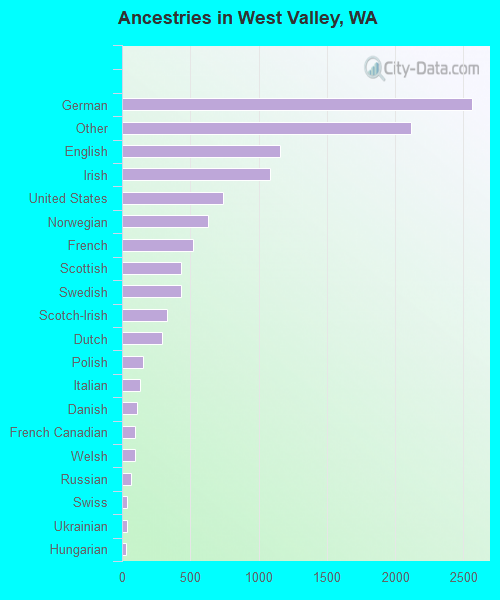
First ancestries reported:
German: 2,559 (23.0%)
Other: 2,115 (19.0%)
English: 1,156 (10.4%)
Irish: 1,080 (9.7%)
United States: 739 (6.7%)
Norwegian: 628 (5.7%)
French: 522 (4.7%)
Scottish: 433 (3.9%)
Swedish: 429 (3.9%)
Scotch-Irish: 326 (2.9%)
Dutch: 296 (2.7%)
Polish: 154 (1.4%)
Italian: 132 (1.2%)
Danish: 111 (1.0%)
French Canadian: 92 (0.8%)
Welsh: 92 (0.8%)
Russian: 63 (0.6%)
Swiss: 39 (0.4%)
Ukrainian: 37 (0.3%)
Hungarian: 26 (0.2%)
Greek: 23 (0.2%)
Arab: 21 (0.2%)
Czech: 17 (0.2%)
Slovak: 10 (0.09%)
Portuguese: 8 (0.07%)
Subsaharan African: 4 (0.04%)
Most common places of birth for foreign-born residents (%):
Mexico
West Valley:
24.3% (102)
Washington:
24.1% (148,115)
Canada
West Valley:
14.8% (62)
Washington:
7.7% (47,568)
Korea
West Valley:
10.5% (44)
Washington:
6.2% (38,172)
United Kingdom
West Valley:
10.3% (43)
Washington:
3.3% (20,321)
China, excluding Hong Kong and Taiwan
West Valley:
7.4% (31)
Washington:
3.3% (20,530)
Philippines
West Valley:
6.9% (29)
Washington:
7.6% (46,733)
India
West Valley:
4.5% (19)
Washington:
2.4% (14,714)
Germany
West Valley:
3.8% (16)
Washington:
3.4% (21,167)
Other South Central Asia
West Valley:
3.3% (14)
Washington:
0.5% (2,889)
Pakistan
West Valley:
2.6% (11)
Washington:
0.3% (1,975)
Japan
West Valley:
2.1% (9)
Washington:
2.8% (16,936)
Cuba
West Valley:
2.1% (9)
Washington:
0.2% (1,259)
Sweden
West Valley:
1.9% (8)
Washington:
0.4% (2,213)
Peru
West Valley:
1.9% (8)
Washington:
0.3% (1,804)
Other Northern Europe
West Valley:
1.7% (7)
Washington:
1.0% (6,393)
Hong Kong
West Valley:
1.7% (7)
Washington:
1.0% (6,263)
Place of birth for U.S.-born residents:
This state: 6,120
Other state: 3,339
Northeast: 219
Midwest: 983
South: 625
West: 1,512
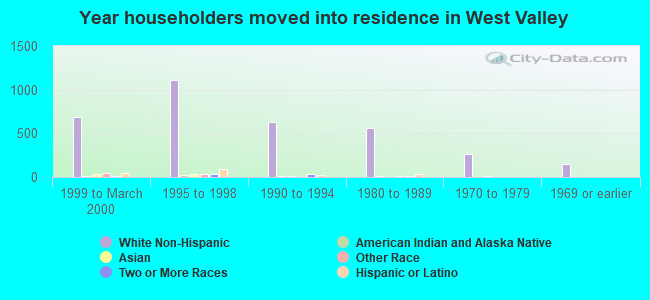
54% of West Valley residents lived in the same house 5 years ago. Out of people who lived in different houses, 69% lived in this county. Out of people who lived in different counties, 52% lived in Washington.
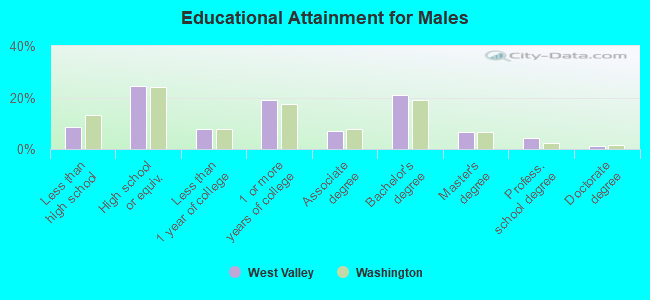
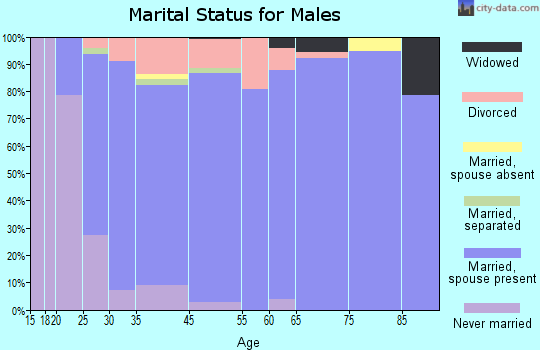
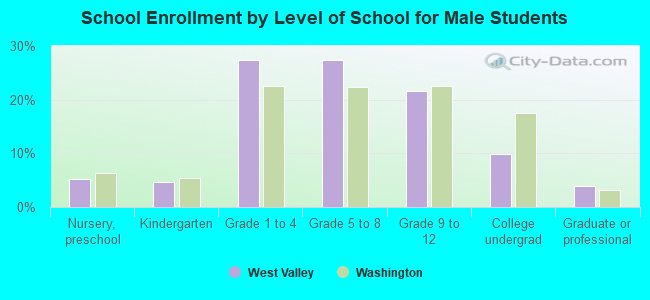
Education attainment for males 25 years and older:
No schooling: 6
Nursery to 4th grade: 0
5th and 6th grade: 15
7th and 8th grade: 36
9th grade: 6
10th grade: 81
11th grade: 39
12th grade, no diploma: 73
High school graduate (or equivalency): 744
Less than 1 year of college: 230
Some college more than 1 year, no degree: 575
Associate degree: 206
Bachelor's degree: 632
Master's degree: 204
Professional school degree: 131
Doctorate degree: 40
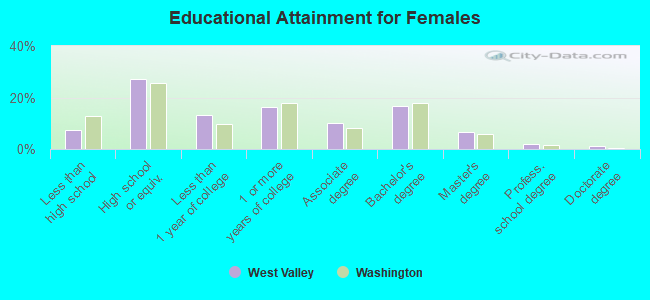
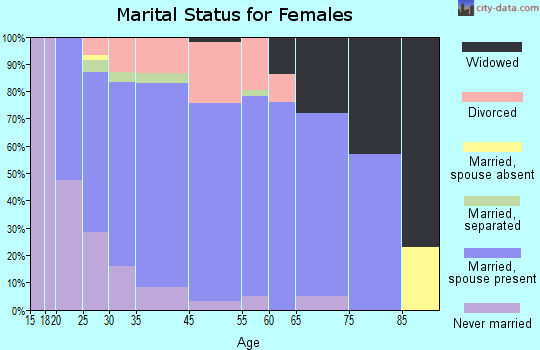
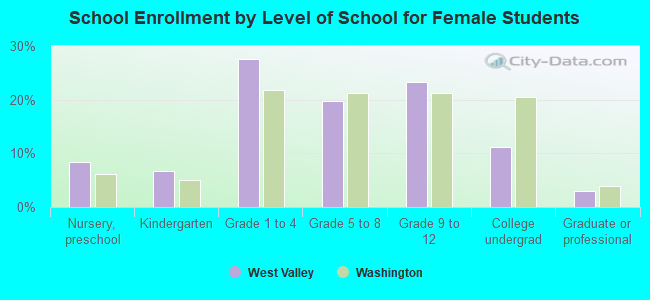
Education attainment for females 25 years and older:
No schooling: 0
Nursery to 4th grade: 0
5th and 6th grade: 17
7th and 8th grade: 34
9th grade: 0
10th grade: 59
11th grade: 65
12th grade, no diploma: 84
High school graduate (or equivalency): 956
Less than 1 year of college: 462
Some college more than 1 year, no degree: 570
Associate degree: 353
Bachelor's degree: 582
Master's degree: 234
Professional school degree: 62
Doctorate degree: 35
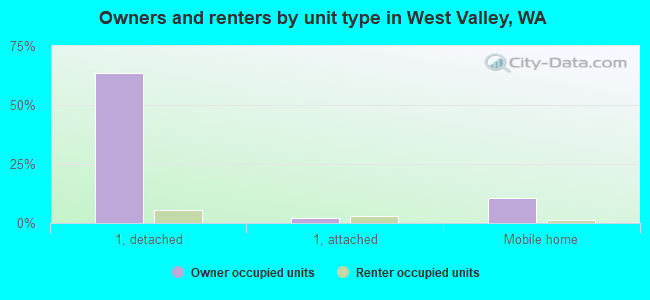
Housing units in structures:
One, detached: 2,657
One, attached: 204
Two: 216
3 or 4: 171
5 to 9: 78
10 to 19: 17
50 or more: 79
Mobile homes: 511
Median worth of mobile homes: $49,745
Housing units lacking complete plumbing facilities: 0.2%
Housing units lacking complete kitchen facilities: 0.2%