Urbana, IL (Illinois) Houses and Residents
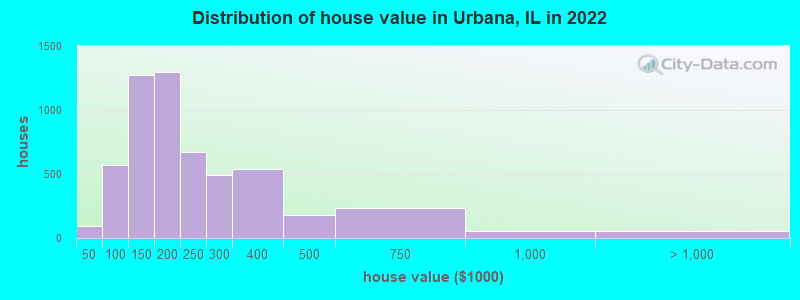
Estimated median house or condo value in 2022: $181,009 (it was $89,500 in 2000 )
Urbana:
$181,009Illinois:
$251,600
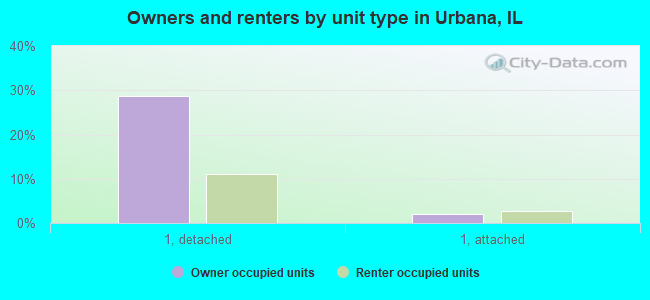
Lower value quartile - upper value quartile: $122,578 - $260,467Mean price in 2022: Detached houses: $204,779 Here:
$204,779State:
$310,164
Townhouses or other attached units: $221,124 Here:
$221,124State:
$286,230
In 2-unit structures: $72,859 Here:
$72,859State:
$299,638
In 3-to-4-unit structures: $204,071 Here:
$204,071State:
$330,907
In 5-or-more-unit structures: $153,963 Here:
$153,963State:
$318,887
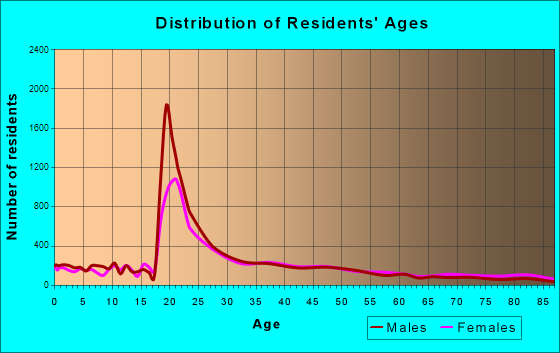
Total population: 42,044 (Urban population: 36,145, Rural population: 51 (all nonfarm) )
Houses: 19,283 (16,694 occupied: 5,524 owner occupied, 11,301 renter occupied )
% of renters here:
67%State:
33%
Housing density: 1,838 houses/condos per square mile
Median price asked for vacant for-sale houses and condos in 2022: $50,678.
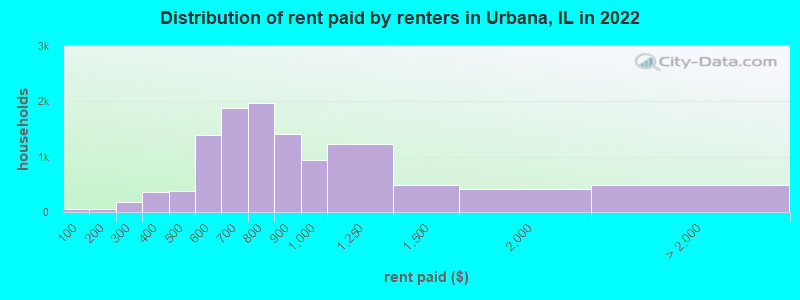
Median contract rent in 2022: $752 (lower quartile is $603, upper quartile is $961)
Median rent asked for vacant for-rent units in 2022: $956
Median gross rent in Urbana, IL in 2022: $897
Housing units in Urbana with a mortgage: 3,233 (102 second mortgage, 7 home equity loan, 104 both second mortgage and home equity loan )Houses without a mortgage: 55
Median household income for houses/condos with a mortgage: $96,274
Median household income for apartments without a mortgage: $88,349
Median monthly housing costs: $951
Data:
Median house or condo value ($)
Median house or condo value ($ change since 2000)
Median house or condo value ($) - White
Median house or condo value ($) - Black or African American
Median house or condo value ($) - Asian
Median house or condo value ($) - Hispanic or Latino
Median house or condo value ($) - American Indian and Alaska Native
Median house or condo value ($) - Multirace
Median house or condo value ($) - Other Race
Median price asked for mobile homes ($)
Household density (households per square mile)
Mean house or condo value by units in structure - 1, detached ($)
Mean house or condo value by units in structure - 1, attached ($)
Mean house or condo value by units in structure - 2 ($)
Mean house or condo value by units in structure by units in structure - 3 or 4 ($)
Mean house or condo value by units in structure - 5 or more ($)
Mean house or condo value by units in structure - Boat, RV, van, etc. ($)
Mean house or condo value by units in structure - Mobile home ($)
Median contract rent ($)
Median contract rent - Lower quartile ($)
Median contract rent - Upper quartile ($)
Median gross rent ($)
Urban houses (%)
Rural houses (%)
Houses occupied (%)
Houses occupied (% change since 2000)
Houses owner occupied (%)
Houses owner occupied (% change since 2000)
Houses renter occupied (%)
Houses renter occupied (% change since 2000)
Vacant housing units - For rent (%)
Vacant housing units - For rent (% change since 2000)
Vacant housing units - For sale only (%)
Vacant housing units - For sale only (% change since 2000)
Vacant housing units - Rented or sold, not occupied (%)
Vacant housing units - Rented or sold, not occupied (% change since 2000)
Vacant housing units - For seasonal, recreational, or occasional use (%)
Vacant housing units - For seasonal, recreational, or occasional use (% change since 2000)
Vacant housing units - For migrant workers (%)
Vacant housing units - For migrant workers (% change since 2000)
Vacant housing units - Other vacant (%)
Vacant housing units - Other vacant (% change since 2000)
Median monthly housing costs ($)
Median household income for houses/condos with a mortgage ($)
Median household income for houses/condos without a mortgage ($)
Median household income ($)
Median household income ($) - White
Median household income ($) - Black or African American
Median household income ($) - Asian
Median household income ($) - Hispanic or Latino
Median household income ($) - American Indian and Alaska Native
Median household income ($) - Multirace
Median household income ($) - Other Race
Mortgage status - with mortgage (%)
Mortgage status - with second mortgage (%)
Mortgage status - with home equity loan (%)
Mortgage status - with both second mortgage and home equity loan (%)
Mortgage status - without a mortgage (%)
Median year house/condo built
Median year apartment built
Household type by relationship - Male householder living alone (%)
Household type by relationship - Male householder not living alone (%)
Household type by relationship - Female householder living alone (%)
Household type by relationship - Female householder not living alone (%)
Household type by relationship - Opposite-Sex spouse (%)
Household type by relationship - Same-Sex spouse (%)
Household type by relationship - Opposite-Sex unmarried partner (%)
Household type by relationship - Same-Sex unmarried partner (%)
Household type by relationship - In group quarters (%)
Size of family households - 2-person household (%)
Size of family households - 3-person household (%)
Size of family households - 4-person household (%)
Size of family households - 5-person household (%)
Size of family households - 6-person household (%)
Size of family households - 7-or-more-person household (%)
Size of nonfamily households - 1-person household (%)
Size of nonfamily households - 2-person household (%)
Size of nonfamily households - 3-person household (%)
Size of nonfamily households - 4-person household (%)
Size of nonfamily households - 5-person household (%)
Size of nonfamily households - 6-person household (%)
Size of nonfamily households - 7-or-moreperson household (%)
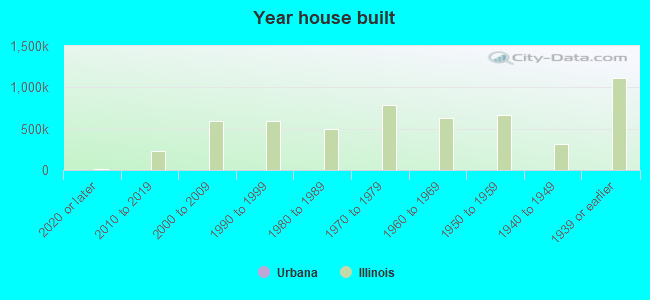
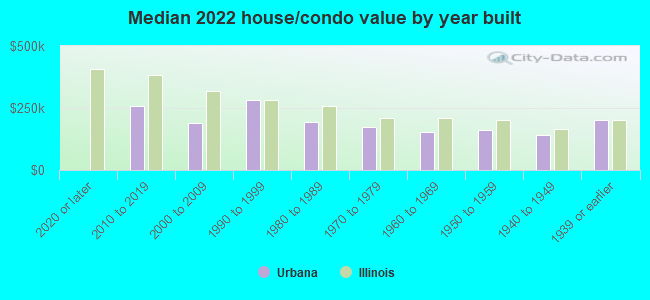
Year house built - Built 2010 or later (%)
Year house built - Built 2000 to 2009 (%)
Year house built - Built 1990 to 1999 (%)
Year house built - Built 1980 to 1989 (%)
Year house built - Built 1970 to 1979 (%)
Year house built - Built 1960 to 1969 (%)
Year house built - Built 1950 to 1959 (%)
Year house built - Built 1940 to 1949 (%)
Year house built - Built 1939 or earlier (%)
Median number of rooms in houses and condos
Median number of rooms in apartments
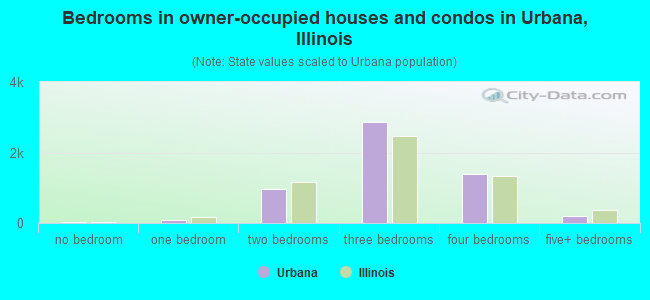
Median number of bedrooms in owner occupied houses
Mean number of bedrooms in owner occupied houses
Median number of bedrooms in renter occupied houses
Mean number of bedrooms in renter occupied houses
Median number of vehichles in owner occupied houses
Mean number of vehichles in owner occupied houses
Median number of vehichles in renter occupied houses
Mean number of vehichles in renter occupied houses
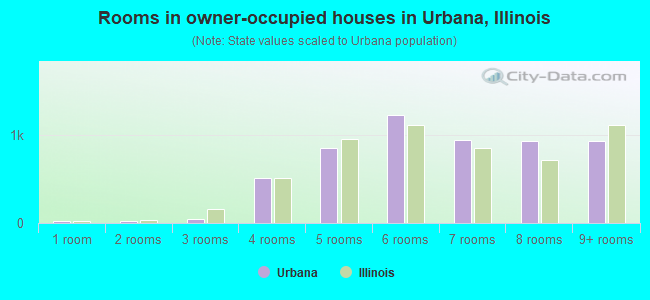
Rooms in owner-occupied houses - 1 room (%)
Rooms in owner-occupied houses - 2 rooms (%)
Rooms in owner-occupied houses - 3 rooms (%)
Rooms in owner-occupied houses - 4 rooms (%)
Rooms in owner-occupied houses - 5 rooms (%)
Rooms in owner-occupied houses - 6 rooms (%)
Rooms in owner-occupied houses - 7 rooms (%)
Rooms in owner-occupied houses - 8 rooms (%)
Rooms in owner-occupied houses - 9+ rooms (%)
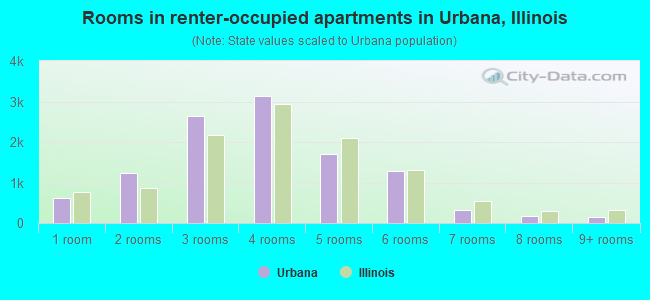
Rooms in renter-occupied houses - 1 room (%)
Rooms in renter-occupied houses - 2 rooms (%)
Rooms in renter-occupied houses - 3 rooms (%)
Rooms in renter-occupied houses - 4 rooms (%)
Rooms in renter-occupied houses - 5 rooms (%)
Rooms in renter-occupied houses - 6 rooms (%)
Rooms in renter-occupied houses - 7 rooms (%)
Rooms in renter-occupied houses - 8 rooms (%)
Rooms in renter-occupied houses - 9+ rooms (%)
Bedrooms in owner-occupied houses - no bedrooms (%)
Bedrooms in owner-occupied houses - 1 bedroom (%)
Bedrooms in owner-occupied houses - 2 bedrooms (%)
Bedrooms in owner-occupied houses - 3 bedrooms (%)
Bedrooms in owner-occupied houses - 4 bedrooms (%)
Bedrooms in owner-occupied houses - 5+ bedrooms (%)
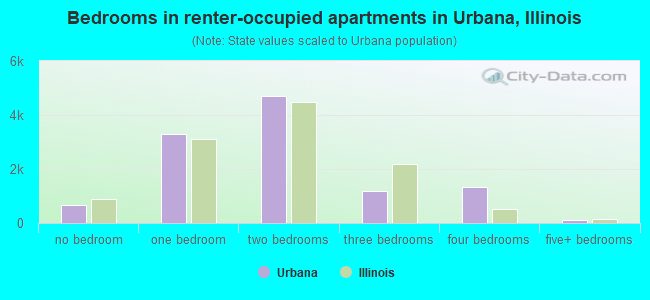
Bedrooms in renter-occupied houses - no bedrooms (%)
Bedrooms in renter-occupied houses - 1 bedroom (%)
Bedrooms in renter-occupied houses - 2 bedrooms (%)
Bedrooms in renter-occupied houses - 3 bedrooms (%)
Bedrooms in renter-occupied houses - 4 bedrooms (%)
Bedrooms in renter-occupied houses - 5+ bedrooms (%)
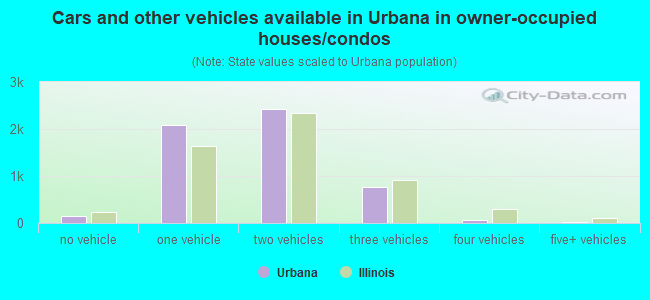
Vehicles available in owner-occupied houses - no vehicle available (%)
Vehicles available in owner-occupied houses - 1 vehicle available(%)
Vehicles available in owner-occupied houses - 2 Vehicles available (%)
Vehicles available in owner-occupied houses - 3 Vehicles available (%)
Vehicles available in owner-occupied houses - 4 Vehicles available (%)
Vehicles available in owner-occupied houses - 5+ Vehicles available (%)
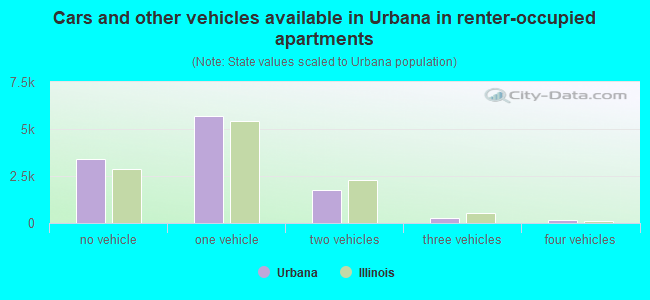
Vehicles available in renter-occupied houses - no vehicle available (%)
Vehicles available in renter-occupied houses - 1 vehicle available (%)
Vehicles available in renter-occupied houses - 2 Vehicles available (%)
Vehicles available in renter-occupied houses - 3 Vehicles available (%)
Vehicles available in renter-occupied houses - 4 Vehicles available (%)
Vehicles available in renter-occupied houses - 5+ Vehicles available (%)
Housing units in structures - 1, detached (%)
Housing units in structures - 1, attached (%)
Housing units in structures - 2 (%)
Housing units in structures - 3 or 4 (%)
Housing units in structures - 5 to 9 (%)
Housing units in structures - 10 to 19 (%)
Housing units in structures - 20 to 49 (%)
Housing units in structures - 50 or more (%)
Housing units in structures - Mobile home (%)
Housing units in structures - Boat, RV, van, etc. (%)
Housing units in structures - Owners - 1, detached (%)
Housing units in structures - Owners - 1, attached (%)
Housing units in structures - Owners - 2 (%)
Housing units in structures - Owners - 3 or 4 (%)
Housing units in structures - Owners - 5 to 9 (%)
Housing units in structures - Owners - 10 to 19 (%)
Housing units in structures - Owners - 20 to 49 (%)
Housing units in structures - Owners - 50 or more (%)
Housing units in structures - Owners - Mobile home (%)
Housing units in structures - Owners - Boat, RV, van, etc. (%)
Housing units in structures - Renters - 1, detached (%)
Housing units in structures - Renters - 1, attached (%)
Housing units in structures - Renters - 2 (%)
Housing units in structures - Renters - 3 or 4 (%)
Housing units in structures - Renters - 5 to 9 (%)
Housing units in structures - Renters - 10 to 19 (%)
Housing units in structures - Renters - 20 to 49 (%)
Housing units in structures - Renters - 50 or more (%)
Housing units in structures - Renters - Mobile home (%)
Housing units in structures - Renters - Boat, RV, van, etc. (%)
House/condo owner moved in on average (years ago)
Renter moved in on average (years ago)
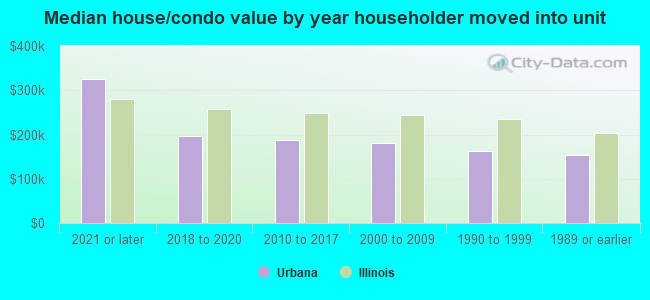
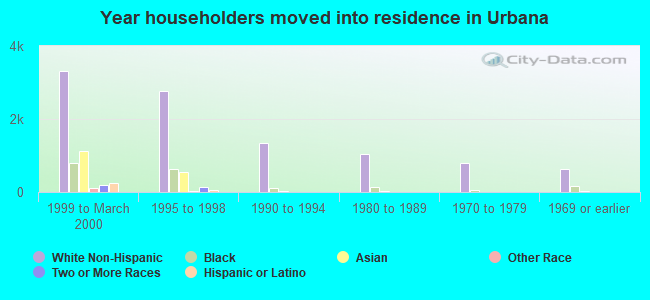
Year householder moved into unit - Moved in 1999 to March 2000 (%)
Year householder moved into unit - Moved in 1999 to March 2000 (%) - White
Year householder moved into unit - Moved in 1999 to March 2000 (%) - Black or African American
Year householder moved into unit - Moved in 1999 to March 2000 (%) - Asian
Year householder moved into unit - Moved in 1999 to March 2000 (%) - Hispanic or Latino
Year householder moved into unit - Moved in 1999 to March 2000 (%) - American Indian and Alaska Native
Year householder moved into unit - Moved in 1999 to March 2000 (%) - Multirace
Year householder moved into unit - Moved in 1999 to March 2000 (%) - Other Race
Year householder moved into unit - Moved in 1995 to 1998 (%)
Year householder moved into unit - Moved in 1995 to 1998 (%) - White
Year householder moved into unit - Moved in 1995 to 1998 (%) - Black or African American
Year householder moved into unit - Moved in 1995 to 1998 (%) - Asian
Year householder moved into unit - Moved in 1995 to 1998 (%) - Hispanic or Latino
Year householder moved into unit - Moved in 1995 to 1998 (%) - American Indian and Alaska Native
Year householder moved into unit - Moved in 1995 to 1998 (%) - Multirace
Year householder moved into unit - Moved in 1995 to 1998 (%) - Other Race
Year householder moved into unit - Moved in 1990 to 1994 (%)
Year householder moved into unit - Moved in 1990 to 1994 (%) - White
Year householder moved into unit - Moved in 1990 to 1994 (%) - Black or African American
Year householder moved into unit - Moved in 1990 to 1994 (%) - Asian
Year householder moved into unit - Moved in 1990 to 1994 (%) - Hispanic or Latino
Year householder moved into unit - Moved in 1990 to 1994 (%) - American Indian and Alaska Native
Year householder moved into unit - Moved in 1990 to 1994 (%) - Multirace
Year householder moved into unit - Moved in 1990 to 1994 (%) - Other Race
Year householder moved into unit - Moved in 1980 to 1989 (%)
Year householder moved into unit - Moved in 1980 to 1989 (%) - White
Year householder moved into unit - Moved in 1980 to 1989 (%) - Black or African American
Year householder moved into unit - Moved in 1980 to 1989 (%) - Asian
Year householder moved into unit - Moved in 1980 to 1989 (%) - Hispanic or Latino
Year householder moved into unit - Moved in 1980 to 1989 (%) - American Indian and Alaska Native
Year householder moved into unit - Moved in 1980 to 1989 (%) - Multirace
Year householder moved into unit - Moved in 1980 to 1989 (%) - Other Race
Year householder moved into unit - Moved in 1970 to 1979 (%)
Year householder moved into unit - Moved in 1970 to 1979 (%) - White
Year householder moved into unit - Moved in 1970 to 1979 (%) - Black or African American
Year householder moved into unit - Moved in 1970 to 1979 (%) - Asian
Year householder moved into unit - Moved in 1970 to 1979 (%) - Hispanic or Latino
Year householder moved into unit - Moved in 1970 to 1979 (%) - American Indian and Alaska Native
Year householder moved into unit - Moved in 1970 to 1979 (%) - Multirace
Year householder moved into unit - Moved in 1970 to 1979 (%) - Other Race
Year householder moved into unit - Moved in 1969 or earlier (%)
Year householder moved into unit - Moved in 1969 or earlier (%) - White
Year householder moved into unit - Moved in 1969 or earlier (%) - Black or African American
Year householder moved into unit - Moved in 1969 or earlier (%) - Asian
Year householder moved into unit - Moved in 1969 or earlier (%) - Hispanic or Latino
Year householder moved into unit - Moved in 1969 or earlier (%) - American Indian and Alaska Native
Year householder moved into unit - Moved in 1969 or earlier (%) - Multirace
Year householder moved into unit - Moved in 1969 or earlier (%) - Other Race
Housing units lacking complete plumbing facilities (%)
Housing units lacking complete kitchen facilities (%)
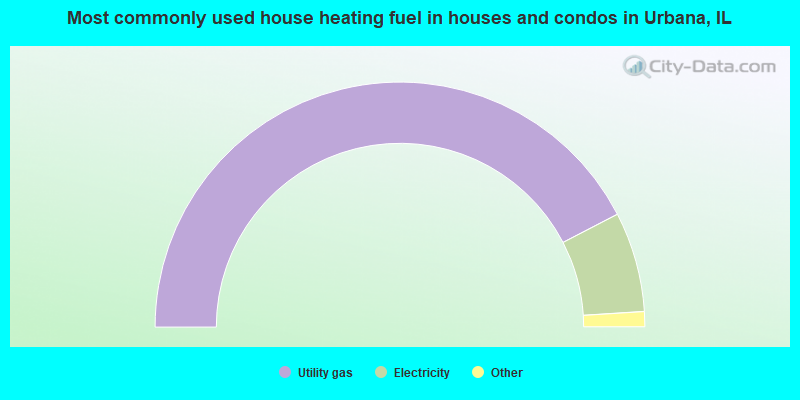
House heating fuel used in houses and condos - Utility gas (%)
House heating fuel used in houses and condos - Bottled, tank, or LP gas (%)
House heating fuel used in houses and condos - Electricity (%)
House heating fuel used in houses and condos - Fuel oil, kerosene, etc. (%)
House heating fuel used in houses and condos - Coal or coke (%)
House heating fuel used in houses and condos - Wood (%)
House heating fuel used in houses and condos - Solar energy (%)
House heating fuel used in houses and condos - Other fuel (%)
House heating fuel used in houses and condos - No fuel used (%)
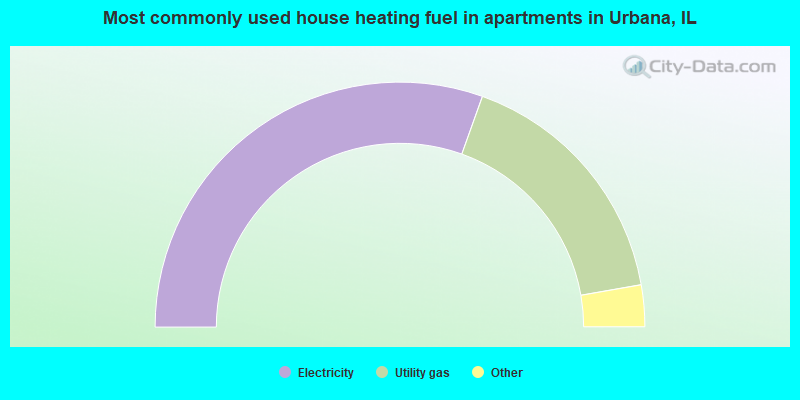
House heating fuel used in apartments - Utility gas (%)
House heating fuel used in apartments - Bottled, tank, or LP gas (%)
House heating fuel used in apartments - Electricity (%)
House heating fuel used in apartments - Fuel oil, kerosene, etc. (%)
House heating fuel used in apartments - Coal or coke (%)
House heating fuel used in apartments - Wood (%)
House heating fuel used in apartments - Solar energy (%)
House heating fuel used in apartments - Other fuel (%)
House heating fuel used in apartments - No fuel used (%)
Latest news about housing in Urbana, IL collected exclusively by city-data.com from local newspapers, TV, and radio stations
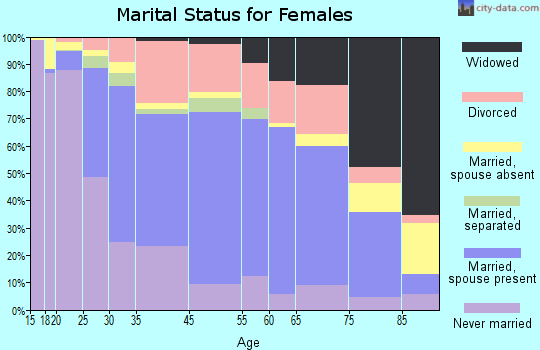
Median year house/condo built: 1971Median year apartment built: 1978Household type by relationship:
Households: 38,744
Male householders: 8,209 (3,818 living alone ), Female householders: 8,171 (4,051 living alone )4,225 spouses (4,160 opposite-sex spouses ), 1,030 unmarried partners , (1,001 opposite-sex unmarried partners ), 5,155 children (4,752 natural , 356 adopted , 47 stepchildren ), 539 grandchildren , 266 brothers or sisters , 64 parents , 0 foster children , 310 other relatives , 4,787 non-relatives In group quarters: 5,985
Size of family households: 3,579 2-persons , 1,208 3-persons , 844 4-persons , 227 5-persons , 18 6-persons , 36 7-or-more-persons .
Size of nonfamily households: 8,348 1-person , 1,782 2-persons , 538 3-persons , 374 4-persons , 48 5-persons , 9 7-or-more-persons .
2,677 married couples with children. single-parent households (196 men , 752 women ).
75.1% of residents of Urbana speak English at home. of residents speak Spanish at home (70% speak English very well , 25% speak English well , 1% speak English not well , 4% don't speak English at all ).of residents speak other Indo-European language at home (70% speak English very well , 21% speak English well , 9% speak English not well ).of residents speak Asian or Pacific Island language at home (59% speak English very well , 40% speak English well , 1% speak English not well ).of residents speak other language at home (87% speak English very well , 11% speak English well , 2% speak English not well ).
Foreign born population: 7,657 (19.8%)of them are naturalized citizens )
Median number of rooms in houses and condos:
Median number of rooms in apartments
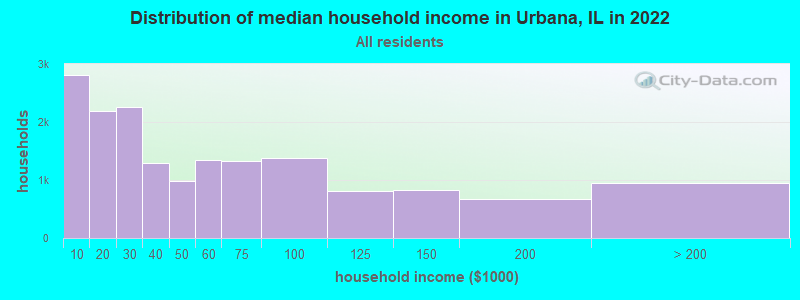
Urbana, IL household income distribution 2,807 Less than $10,0002,192 $10,000 to $19,9992,263 $20,000 to $29,9991,285 $30,000 to $39,999990 $40,000 to $49,9991,339 $50,000 to $59,9991,320 $60,000 to $74,9991,384 $75,000 to $99,999815 $100,000 to $124,999820 $125,000 to $149,999680 $150,000 to $199,999950 $200,000 or more
Home value of owner - occupied houses in 2022 in Urbana, IL 36 Less than $10,00010 $15,000 to $19,99916 $20,000 to $24,99911 $25,000 to $29,99920 $35,000 to $39,99960 $50,000 to $59,999189 $60,000 to $69,99986 $70,000 to $79,99996 $80,000 to $89,999134 $90,000 to $99,999774 $100,000 to $124,999502 $125,000 to $149,999719 $150,000 to $174,999577 $175,000 to $199,999669 $200,000 to $249,999494 $250,000 to $299,999539 $300,000 to $399,999180 $400,000 to $499,999232 $500,000 to $749,99958 $750,000 to $999,99952 $1,000,000 to $1,499,999Rent paid by renters in 2022 in Urbana, IL 52 Less than $10016 $100 to $14943 $150 to $19961 $200 to $249113 $250 to $299216 $300 to $349146 $350 to $39993 $400 to $449292 $450 to $499848 $500 to $549545 $550 to $599974 $600 to $649905 $650 to $699803 $700 to $7491,168 $750 to $7991,409 $800 to $899939 $900 to $9991,233 $1,000 to $1,249481 $1,250 to $1,499408 $1,500 to $1,999191 $2,000 to $2,49978 $2,500 to $2,99924 $3,000 to $3,49954 $3,500 or more139 No cash rent
Percentage of workers working in this county: 96.1%Number of people working at home: 3,529 (18.7% of all workers )
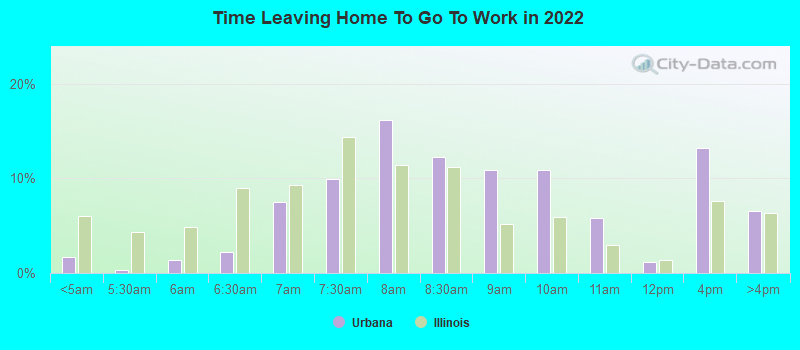
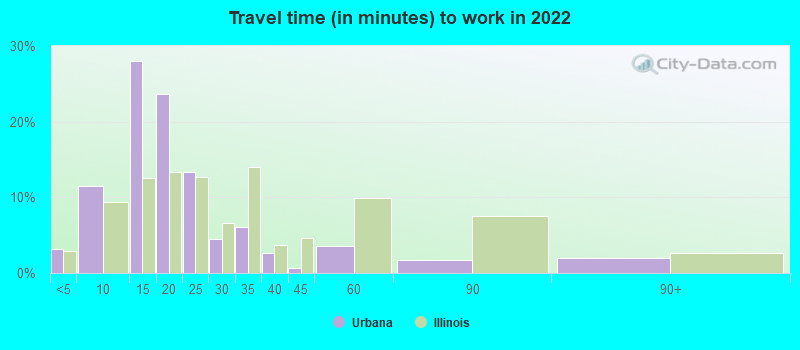
Travel time to work (commute)
Less than 5 minutes: 5605 to 9 minutes: 2,83910 to 14 minutes: 6,85215 to 19 minutes: 2,93020 to 24 minutes: 1,52425 to 29 minutes: 30130 to 34 minutes: 35235 to 39 minutes: 11140 to 44 minutes: 9845 to 59 minutes: 15360 to 89 minutes: 17690 or more minutes: 107
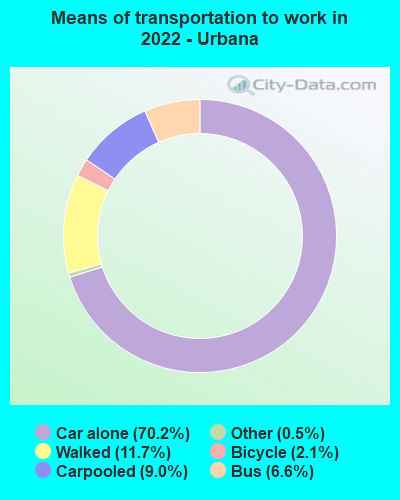
Means of transportation to work:
Drove a car alone: 19,028 (60.8%)Carpooled: 2,361 (7.5%)Bus : 2,418 (7.7%)Taxi: 89 (0.3%)Bicycle: 466 (1.5%)Walked: 2,917 (9.3%)Worked at home: 3,529 (11.3%)
Unemployment by race in 2022
Unemployment rate for White non-Hispanic residents 4.6% Males4.0% FemalesUnemployment rate for Black residents 18.0% Males6.9% FemalesUnemployment rate for Asian residents 3.8% MalesUnemployment rate for other race residents 6.9% FemalesUnemployment rate for two or more race residents 2.4% Males4.0% FemalesUnemployment rate for Hispanic or Latino residents 1.6% Males9.9% Females
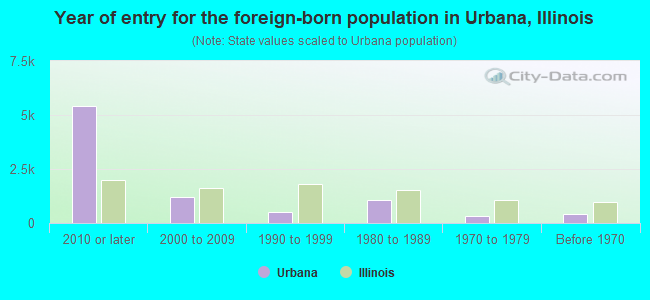
Year of entry for the foreign-born population in Urbana, Illinois
5,412 2010 or later 1,193 2000 to 2009 532 1990 to 1999 1,075 1980 to 1989 323 1970 to 1979 406 Before 1970
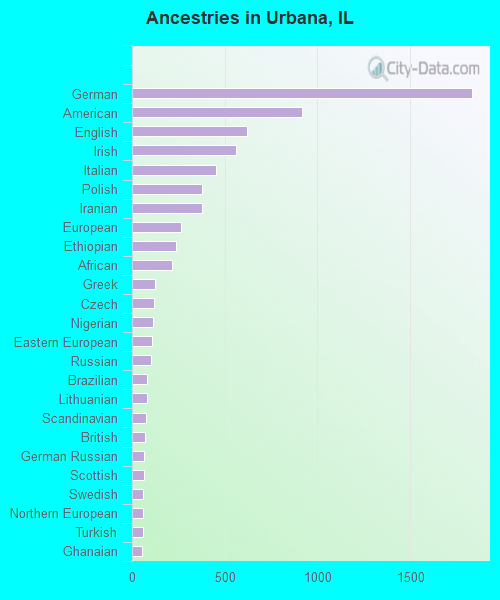
First ancestries reported:
German: 1,833 (9.3%)
American: 916 (4.7%)
English: 619 (3.2%)
Irish: 561 (2.9%)
Italian: 453 (2.3%)
Polish: 380 (1.9%)
Iranian: 377 (1.9%)
European: 265 (1.3%)
Ethiopian: 236 (1.2%)
African: 213 (1.1%)
Greek: 126 (0.6%)
Czech: 118 (0.6%)
Nigerian: 111 (0.6%)
Eastern European: 108 (0.5%)
Russian: 104 (0.5%)
Brazilian: 82 (0.4%)
Lithuanian: 82 (0.4%)
Scandinavian: 74 (0.4%)
British: 69 (0.4%)
German Russian: 67 (0.3%)
Scottish: 62 (0.3%)
Swedish: 60 (0.3%)
Northern European: 59 (0.3%)
Turkish: 58 (0.3%)
Ghanaian: 56 (0.3%)
Dutch: 55 (0.3%)
Norwegian: 52 (0.3%)
Arab: 51 (0.3%)
Egyptian: 49 (0.2%)
Icelander: 46 (0.2%)
Welsh: 43 (0.2%)
Romanian: 36 (0.2%)
Ukrainian: 36 (0.2%)
French Canadian: 31 (0.2%)
French: 29 (0.1%)
Syrian: 26 (0.1%)
Hungarian: 25 (0.1%)
Kenyan: 23 (0.1%)
Albanian: 17 (0.09%)
Portuguese: 17 (0.09%)
Israeli: 16 (0.08%)
U.S. Virgin Islander: 16 (0.08%)
Alsatian: 15 (0.08%)
Danish: 15 (0.08%)
Scotch-Irish: 15 (0.08%)
Pennsylvania German: 13 (0.07%)
Iraqi: 13 (0.07%)
Liberian: 13 (0.07%)
Ugandan: 12 (0.06%)
Lebanese: 11 (0.06%)
Czechoslovakian: 10 (0.05%)
Finnish: 3 (0.02%)
Most common places of birth for foreign-born residents (%): China, excluding Hong Kong and Taiwan Urbana:
27.6% (1,984)Illinois:
4.1% (74,364)
India Urbana:
10.3% (741)Illinois:
9.2% (166,409)
Iran Urbana:
5.8% (420)Illinois:
0.4% (6,922)
Bangladesh Urbana:
4.3% (311)Illinois:
0.2% (2,731)
Colombia Urbana:
4.1% (298)Illinois:
0.9% (16,553)
Mexico Urbana:
3.8% (274)Illinois:
34.7% (626,958)
Nigeria Urbana:
3.4% (246)Illinois:
1.2% (21,186)
Korea Urbana:
2.6% (187)Illinois:
2.2% (40,393)
Ethiopia Urbana:
2.5% (180)Illinois:
0.3% (4,775)
Japan Urbana:
1.9% (138)Illinois:
0.6% (10,943)
Algeria Urbana:
1.9% (137)Illinois:
0.1% (2,465)
Pakistan Urbana:
1.9% (135)Illinois:
1.6% (29,519)
Congo Urbana:
1.8% (129)Illinois:
0.1% (1,142)
Brazil Urbana:
1.7% (125)Illinois:
0.5% (8,778)
Place of birth for U.S.-born residents:
This state: 21,429Other state: 8,889Northeast: 1,261Midwest: 2,919South: 3,098West: 1,570 67.3% of Urbana residents lived in the same house 1 years ago.
Out of people who lived in different houses, 33.9% lived in this county.
Out of people who lived in different counties, 70.4% lived in Illinois.
Urbana:
67.3%State average:
88.3%
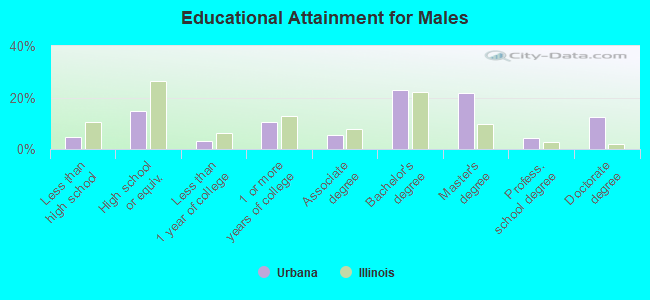
Education attainment for males 25 years and older:
No schooling: 100Nursery to 4th grade: 05th and 6th grade: 587th and 8th grade: 09th grade: 1510th grade: 7611th grade: 17412th grade, no diploma: 37High school graduate (or equivalency): 1,386Less than 1 year of college: 311Some college more than 1 year, no degree: 997Associate degree: 502Bachelor's degree: 2,166Master's degree: 2,063Professional school degree: 411Doctorate degree: 1,186
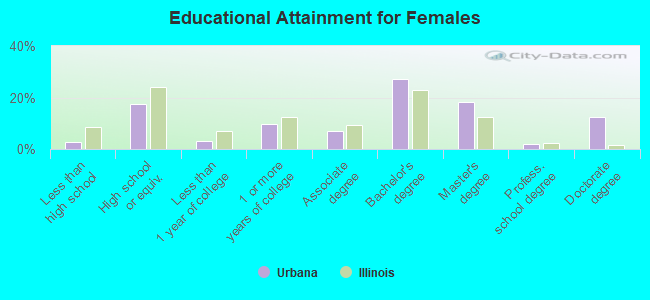
Education attainment for females 25 years and older:
No schooling: 64Nursery to 4th grade: 255th and 6th grade: 527th and 8th grade: 459th grade: 910th grade: 1011th grade: 3512th grade, no diploma: 69High school graduate (or equivalency): 1,882Less than 1 year of college: 352Some college more than 1 year, no degree: 1,042Associate degree: 769Bachelor's degree: 2,919Master's degree: 1,954Professional school degree: 219Doctorate degree: 1,351
Housing units in structures:
One, detached: 6,894One, attached: 794Two: 7513 or 4: 8105 to 9: 2,38010 to 19: 3,16520 to 49: 2,12450 or more: 2,338Mobile homes: 23Housing units lacking complete plumbing facilities in 2022: 0.4%Housing units lacking complete kitchen facilities in 2022: 1.7%House/condo owner moved in on average 11 years ago
Renter moved in on average 0 years ago
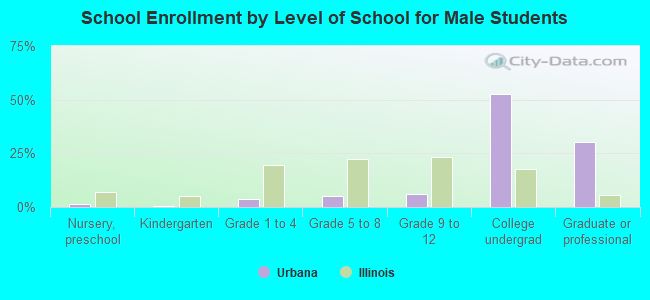
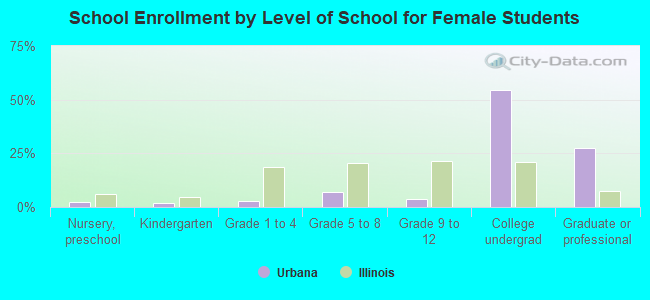
Private vs. public school enrollment:
Students in private schools in grades 1 to 8 (elementary and middle school): 144 Students in private schools in grades 9 to 12 (high school): 26 Students in private undergraduate colleges: 215