Temple Terrace, FL (Florida) Houses and Residents
| Temple Terrace: | $346,994 |
| Florida: | $354,100 |
Mean price in 2022:
Detached houses: $360,274
Here: $360,274 State: $500,941 Townhouses or other attached units: $151,211
Here: $151,211 State: $370,869 In 2-unit structures: $234,607
Here: $234,607 State: $423,188 In 3-to-4-unit structures: $143,131
Here: $143,131 State: $309,944 In 5-or-more-unit structures: $214,183
Here: $214,183 State: $447,145
Total population: 25,419 (Urban population: 20,871, Rural population: 0)
Houses: 11,861 (11,291 occupied: 5,639 owner occupied, 5,699 renter occupied)
| % of renters here: | 50% |
| State: | 33% |
Housing density: 1,730 houses/condos per square mile
Median price asked for vacant for-sale houses and condos in 2022: $2,213,571.
Median contract rent in 2022: $1,347 (lower quartile is $1,120, upper quartile is $1,599)
Median rent asked for vacant for-rent units in 2022: $2,846
Median gross rent in Temple Terrace, FL in 2022: $1,484
Housing units in Temple Terrace with a mortgage: 3,436 (338 second mortgage, 39 home equity loan, 303 both second mortgage and home equity loan)
Houses without a mortgage: 14
Median household income for houses/condos with a mortgage: $110,890
Median household income for apartments without a mortgage: $67,966
Median monthly housing costs: $1,392
Compare current foreclosures near Temple Terrace, FL:
| Photo | Address | Area | Beds / Baths | Price | Details |
|---|---|---|---|---|---|

|
#1
N Merrin St
Plant City, FL 33563
|
2,208 sq. feet
|
2 baths 3 beds |
$435,000
|
show details |

|
#2
Cactus Needle Ln
Wesley Chapel, FL 33544
|
1,576 sq. feet
|
2 baths 3 beds |
$295,000
|
show details |

|
#3
Blue Magnolia Rd
Brandon, FL 33510
|
1,231 sq. feet
|
2 baths 2 beds |
$200,000
|
show details |

|
#4
S Farkas Rd
Plant City, FL 33567
|
1,120 sq. feet
|
1 baths 3 beds |
$130,000
|
show details |

|
#5
S Harbour Island Blvd Unit 145
Tampa, FL 33602
|
1,015 sq. feet
|
1 baths 1 beds |
show details | |

|
#6
Rivercrest Dr
Riverview, FL 33578
|
1,764 sq. feet
|
2 baths 3 beds |
show details | |

|
#7
Corrie Way
Tampa, FL 33618
|
2,444 sq. feet
|
2 baths 3 beds |
show details | |

|
#8
Lake Chase Island Way
Tampa, FL 33626
|
1,140 sq. feet
|
2 baths 2 beds |
show details | |

|
#9
Lake Chase Island Way
Tampa, FL 33626
|
1,140 sq. feet
|
2 baths 2 beds |
show details | |

|
#10
Dunham Station Dr
Tampa, FL 33647
|
4,262 sq. feet
|
4 baths 4 beds |
show details |
| Photo | Address | Area | Beds / Baths | Price | Details |
|---|---|---|---|---|---|

|
#11
Tocobaga Pl
Riverview, FL 33578
|
1,627 sq. feet
|
2 baths 3 beds |
show details | |

|
#12
Abigail Rd
Plant City, FL 33563
|
1,178 sq. feet
|
2 baths 3 beds |
show details | |

|
#13
Outpost Point Dr
Tampa, FL 33647
|
2,926 sq. feet
|
4 baths 4 beds |
show details | |

|
#14
Hidden Shadow Dr
Tampa, FL 33614
|
1,714 sq. feet
|
2 baths 3 beds |
show details | |

|
#15
N Thatcher Ave
Tampa, FL 33614
|
974 sq. feet
|
1 baths 2 beds |
show details | |

|
#16
S Harbour Island Blvd Unit 213
Tampa, FL 33602
|
1,187 sq. feet
|
2 baths 2 beds |
show details | |

|
#17
Magnolia St
Gibsonton, FL 33534
|
1,458 sq. feet
|
1 baths 3 beds |
show details | |

|
#18
W Woodlawn Ave
Tampa, FL 33607
|
1,638 sq. feet
|
2 baths 3 beds |
show details | |

|
#19
Cypress Shadow Ave
Tampa, FL 33647
|
1,643 sq. feet
|
2 baths 3 beds |
show details | |

|
#20
Pleasant Ln
Riverview, FL 33569
|
1,444 sq. feet
|
2 baths 3 beds |
show details |
| Photo | Address | Area | Beds / Baths | Price | Details |
|---|---|---|---|---|---|

|
#21
Grant Creek Dr
Tampa, FL 33647
|
2,348 sq. feet
|
3 baths 5 beds |
show details | |

|
#22
S Trask St
Tampa, FL 33611
|
1,214 sq. feet
|
1 baths 2 beds |
show details | |

|
#23
Highland Ridge Cir
Brandon, FL 33510
|
1,168 sq. feet
|
2 baths 2 beds |
show details | |

|
#24
Ambly Ln
Tampa, FL 33647
|
2,328 sq. feet
|
2 baths 4 beds |
show details | |

|
#25
Harvest Moon Dr
Seffner, FL 33584
|
1,271 sq. feet
|
2 baths 3 beds |
show details | |

|
#26
W Beach St
Tampa, FL 33607
|
1,728 sq. feet
|
2 baths 4 beds |
show details | |

|
#27
Ashfield Ct
Tampa, FL 33615
|
1,155 sq. feet
|
2 baths 3 beds |
show details | |

|
#28
W Hidden Haven Ct
Tampa, FL 33607
|
1,545 sq. feet
|
2 baths 3 beds |
show details | |

|
#29
Fiji Isle Pl
Tampa, FL 33647
|
3,008 sq. feet
|
2 baths 4 beds |
show details | |

|
#30
Wheeler Groves Dr
Seffner, FL 33584
|
1,712 sq. feet
|
2 baths 3 beds |
show details |
| Photo | Address | Area | Beds / Baths | Price | Details |
|---|---|---|---|---|---|

|
#31
Arbor Reserve Cir Apt 108
Tampa, FL 33624
|
914 sq. feet
|
2 baths 2 beds |
show details | |

|
#32
Norchester Cir
Tampa, FL 33647
|
2,634 sq. feet
|
3 baths 5 beds |
show details | |

|
#33
Willowick Ave
Tampa, FL 33617
|
2,367 sq. feet
|
2 baths 4 beds |
show details | |

|
#34
Bending Creek Pl
Tampa, FL 33647
|
1,695 sq. feet
|
2 baths 3 beds |
show details | |

|
#35
S Waterman Dr
Valrico, FL 33594
|
1,609 sq. feet
|
2 baths 3 beds |
show details | |

|
#36
W Pond Woods Dr
Tampa, FL 33618
|
1,478 sq. feet
|
2 baths 3 beds |
show details | |

|
#37
Blue Magnolia Rd
Brandon, FL 33510
|
1,312 sq. feet
|
2 baths 3 beds |
show details | |

|
#38
W Norfolk St
Tampa, FL 33614
|
986 sq. feet
|
2 baths 3 beds |
show details | |

|
#39
W Palmetto St
Tampa, FL 33607
|
710 sq. feet
|
1 baths 1 beds |
show details | |

|
#40
Belleville Pl
Tampa, FL 33624
|
1,336 sq. feet
|
2 baths 3 beds |
show details |
| Photo | Address | Area | Beds / Baths | Price | Details |
|---|---|---|---|---|---|

|
#41
Hamilton Park Blvd
Tampa, FL 33615
|
2,065 sq. feet
|
2 baths 4 beds |
show details | |

|
#42
Bruton Rd
Plant City, FL 33565
|
1,688 sq. feet
|
2 baths 5 beds |
show details | |

|
#43
Bayboro Bridge Dr
Tampa, FL 33626
|
1,705 sq. feet
|
2 baths 3 beds |
show details | |

|
#44
W Walnut St
Tampa, FL 33607
|
1,499 sq. feet
|
2 baths 4 beds |
show details | |

|
#45
Sandhurst Dr
Tampa, FL 33619
|
925 sq. feet
|
1 baths 2 beds |
show details | |

|
#46
Meadow Field Cir
Tampa, FL 33626
|
1,432 sq. feet
|
2 baths 2 beds |
show details | |

|
#47
Camden St
Tampa, FL 33614
|
3,640 sq. feet
|
2 baths 2 beds |
show details | |

|
#48
Chastain Rd
Seffner, FL 33584
|
1,784 sq. feet
|
2 baths 3 beds |
show details | |

|
#49
Glen Ivy Ln
Tampa, FL 33624
|
1,524 sq. feet
|
2 baths 3 beds |
show details | |

|
Check over 1 million property listings on Foreclosure.com!
|
browse all offers | |||


Median year apartment built: 1986
Household type by relationship:
Households: 27,635- Male householders: 5,714 (1,834 living alone), Female householders: 5,510 (1,721 living alone)
4,162 spouses (4,113 opposite-sex spouses), 843 unmarried partners, (781 opposite-sex unmarried partners), 6,897 children (6,633 natural, 251 adopted, 13 stepchildren), 365 grandchildren, 513 brothers or sisters, 654 parents, 0 foster children, 418 other relatives, 1,800 non-relatives
- In group quarters: 753
Size of family households: 3,160 2-persons, 1,130 3-persons, 1,276 4-persons, 439 5-persons, 273 6-persons, 78 7-or-more-persons.
Size of nonfamily households: 3,420 1-person, 1,210 2-persons, 203 3-persons, 121 4-persons.
3,493 married couples with children.
1,294 single-parent households (199 men, 1,095 women).
72.9% of residents of Temple Terrace speak English at home.
12.0% of residents speak Spanish at home (75% speak English very well, 15% speak English well, 4% speak English not well, 6% don't speak English at all).
4.5% of residents speak other Indo-European language at home (85% speak English very well, 11% speak English well, 4% speak English not well).
4.0% of residents speak Asian or Pacific Island language at home (64% speak English very well, 18% speak English well, 10% speak English not well, 9% don't speak English at all).
6.1% of residents speak other language at home (73% speak English very well, 19% speak English well, 5% speak English not well, 3% don't speak English at all).
Foreign born population: 4,789 (17.3%)
(55.7% of them are naturalized citizens)
| Here: | 6.6 |
| State: | 5.9 |
| Here: | 4.1 |
| State: | 4.2 |

- Bedrooms in owner-occupied houses and condos in Temple Terrace, Florida
- 100no bedroom
- 1271 bedroom
- 9742 bedrooms
- 2,3373 bedrooms
- 1,8574 bedrooms
- 2455+ bedrooms

- Bedrooms in renter-occupied apartments in Temple Terrace, Florida
- 116no bedroom
- 1,3871 bedroom
- 2,5822 bedrooms
- 1,1973 bedrooms
- 4174 bedrooms
- 05+ bedrooms

- Cars and other vehicles available in Temple Terrace in owner-occupied houses/condos
- 76no vehicle
- 1,8311 vehicle
- 2,6992 vehicles
- 7603 vehicles
- 1604 vehicles
- 1135+ vehicles

- Cars and other vehicles available in Temple Terrace in renter-occupied apartments
- 262no vehicle
- 2,9191 vehicle
- 2,1182 vehicles
- 2223 vehicles
- 1554 vehicles
- 235+ vehicles

- Rooms in owner-occupied houses in Temple Terrace, Florida
- 911 room
- 02 rooms
- 2093 rooms
- 4084 rooms
- 8625 rooms
- 1,1576 rooms
- 1,0537 rooms
- 9478 rooms
- 9129+ rooms

- Rooms in renter-occupied apartments in Temple Terrace, Florida
- 1161 room
- 2672 rooms
- 7683 rooms
- 2,5094 rooms
- 1,1555 rooms
- 5866 rooms
- 1977 rooms
- 928 rooms
- 99+ rooms


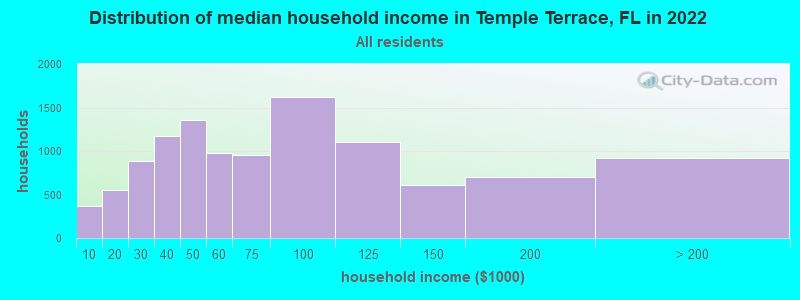
Temple Terrace, FL household income distribution

- 371Less than $10,000
- 555$10,000 to $19,999
- 880$20,000 to $29,999
- 1,178$30,000 to $39,999
- 1,361$40,000 to $49,999
- 978$50,000 to $59,999
- 954$60,000 to $74,999
- 1,622$75,000 to $99,999
- 1,109$100,000 to $124,999
- 609$125,000 to $149,999
- 705$150,000 to $199,999
- 919$200,000 or more
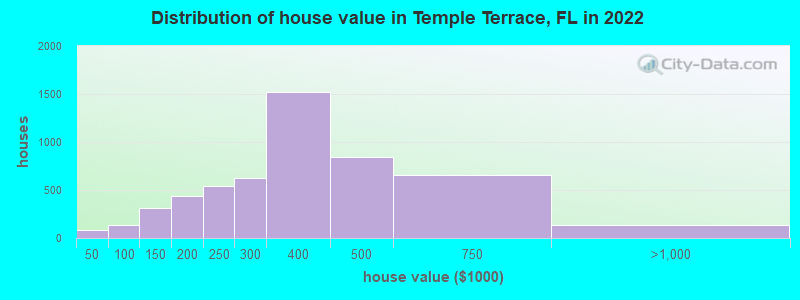
Home value of owner - occupied houses in 2022 in Temple Terrace, FL
-
- 12Less than $10,000
- 14$10,000 to $14,999
- 46$20,000 to $24,999
- 9$25,000 to $29,999
- 14$50,000 to $59,999
- 14$60,000 to $69,999
- 33$70,000 to $79,999
- 32$80,000 to $89,999
- 40$90,000 to $99,999
- 131$100,000 to $124,999
- 181$125,000 to $149,999
- 255$150,000 to $174,999
- 181$175,000 to $199,999
- 539$200,000 to $249,999
- 620$250,000 to $299,999
- 1,518$300,000 to $399,999
- 846$400,000 to $499,999
- 654$500,000 to $749,999
- 119$750,000 to $999,999
- 19$1,000,000 to $1,499,999
Rent paid by renters in 2022 in Temple Terrace, FL
-
- 41$350 to $399
- 12$400 to $449
- 208$450 to $499
- 14$500 to $549
- 15$650 to $699
- 31$700 to $749
- 84$750 to $799
- 108$800 to $899
- 228$900 to $999
- 1,680$1,000 to $1,249
- 1,382$1,250 to $1,499
- 790$1,500 to $1,999
- 381$2,000 to $2,499
- 108$2,500 to $2,999
- 61$3,000 to $3,499
- 78No cash rent


Percentage of workers working in this county: 89.4%
Number of people working at home: 2,793 (19.0% of all workers)
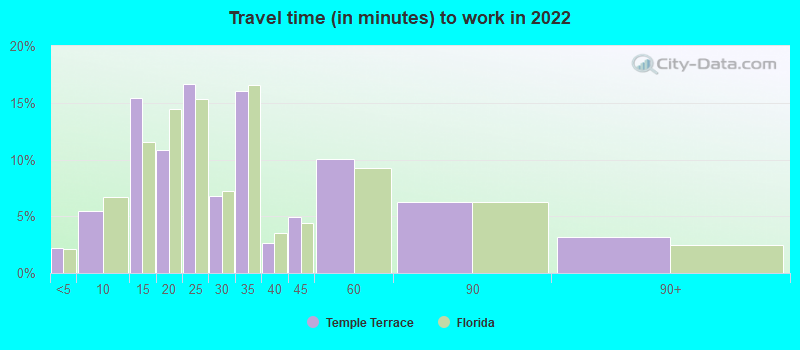
Travel time to work (commute)
- Less than 5 minutes: 175
- 5 to 9 minutes: 919
- 10 to 14 minutes: 1,575
- 15 to 19 minutes: 1,867
- 20 to 24 minutes: 1,790
- 25 to 29 minutes: 851
- 30 to 34 minutes: 2,195
- 35 to 39 minutes: 351
- 40 to 44 minutes: 480
- 45 to 59 minutes: 648
- 60 to 89 minutes: 852
- 90 or more minutes: 142
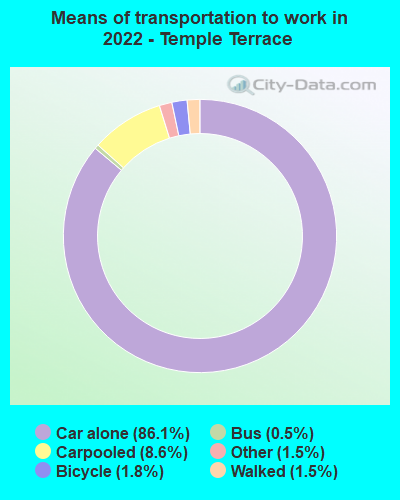
Means of transportation to work:
- Drove a car alone: 9,694 (68.1%)
- Carpooled: 1,107 (7.8%)
- Bus: 43 (0.3%)
- Taxi: 190 (1.3%)
- Bicycle: 225 (1.6%)
- Walked: 163 (1.1%)
- Worked at home: 2,793 (19.6%)

- Unemployment by race in 2022
- Unemployment rate for White non-Hispanic residents
- 2.1%Males
- 2.3%Females
- Unemployment rate for Black residents
- 8.4%Females
- Unemployment rate for Asian residents
- 4.0%Males
- 2.8%Females
- Unemployment rate for two or more race residents
- 11.1%Males
- Unemployment rate for Hispanic or Latino residents
- 3.7%Males

- Year of entry for the foreign-born population in Temple Terrace, Florida
- 2,3042010 or later
- 9012000 to 2009
- 8411990 to 1999
- 7271980 to 1989
- 2941970 to 1979
- 385Before 1970
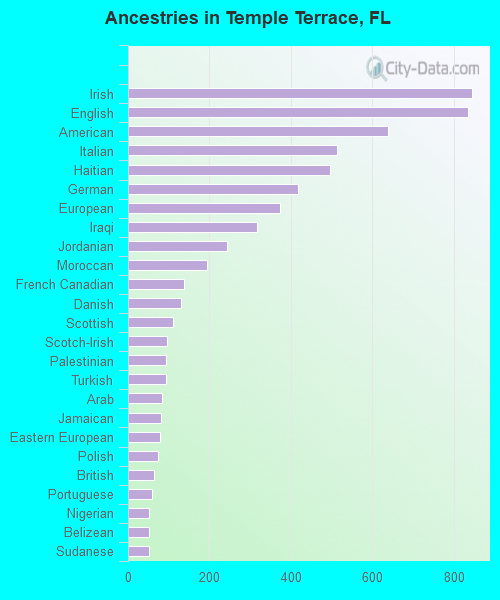
First ancestries reported:
- Irish: 844 (5.5%)
- English: 834 (5.4%)
- American: 638 (4.1%)
- Italian: 513 (3.3%)
- Haitian: 497 (3.2%)
- German: 418 (2.7%)
- European: 374 (2.4%)
- Iraqi: 316 (2.0%)
- Jordanian: 242 (1.6%)
- Moroccan: 195 (1.3%)
- French Canadian: 138 (0.9%)
- Danish: 130 (0.8%)
- Scottish: 110 (0.7%)
- Scotch-Irish: 95 (0.6%)
- Palestinian: 94 (0.6%)
- Turkish: 93 (0.6%)
- Arab: 84 (0.5%)
- Jamaican: 80 (0.5%)
- Eastern European: 78 (0.5%)
- Polish: 73 (0.5%)
- British: 64 (0.4%)
- Portuguese: 58 (0.4%)
- Nigerian: 52 (0.3%)
- Belizean: 52 (0.3%)
- Sudanese: 51 (0.3%)
- Guyanese: 45 (0.3%)
- Greek: 43 (0.3%)
- Northern European: 37 (0.2%)
- Ghanaian: 35 (0.2%)
- Hungarian: 30 (0.2%)
- Swedish: 29 (0.2%)
- Syrian: 25 (0.2%)
- French: 23 (0.1%)
- Russian: 22 (0.1%)
- U.S. Virgin Islander: 22 (0.1%)
- African: 21 (0.1%)
- Dutch: 19 (0.1%)
- Austrian: 18 (0.1%)
- Lithuanian: 18 (0.1%)
- British West Indian: 18 (0.1%)
- Afghan: 17 (0.1%)
- Croatian: 17 (0.1%)
- Belgian: 16 (0.1%)
- Finnish: 16 (0.1%)
- Canadian: 14 (0.09%)
- Egyptian: 12 (0.08%)
- Romanian: 5 (0.03%)
- Norwegian: 3 (0.02%)
Most common places of birth for foreign-born residents (%):
| Temple Terrace: | 9.5% (439) |
| Florida: | 2.1% (94,349) |
| Temple Terrace: | 7.2% (331) |
| Florida: | 0.1% (5,245) |
| Temple Terrace: | 6.9% (316) |
| Florida: | 7.5% (342,375) |
| Temple Terrace: | 6.8% (312) |
| Florida: | 5.6% (257,152) |
| Temple Terrace: | 3.9% (181) |
| Florida: | 1.8% (84,403) |
| Temple Terrace: | 3.5% (160) |
| Florida: | 2.3% (107,160) |
| Temple Terrace: | 3.5% (159) |
| Florida: | 0.2% (9,164) |
| Temple Terrace: | 3.4% (158) |
| Florida: | 22.0% (1,006,576) |
| Temple Terrace: | 3.4% (155) |
| Florida: | 0.1% (4,597) |
| Temple Terrace: | 2.9% (135) |
| Florida: | 1.3% (60,604) |
| Temple Terrace: | 2.7% (125) |
| Florida: | 5.7% (262,042) |
| Temple Terrace: | 2.7% (125) |
| Florida: | 0.1% (4,966) |
| Temple Terrace: | 2.7% (124) |
| Florida: | 5.0% (227,319) |
| Temple Terrace: | 2.7% (122) |
| Florida: | 0.4% (19,445) |
| Temple Terrace: | 2.5% (115) |
| Florida: | 0.1% (4,197) |
| Temple Terrace: | 2.5% (113) |
| Florida: | 1.2% (56,071) |
| Temple Terrace: | 2.4% (112) |
| Florida: | 6.5% (298,669) |
| Temple Terrace: | 2.1% (98) |
| Florida: | 0.2% (9,990) |
| Temple Terrace: | 2.1% (97) |
| Florida: | 2.1% (97,632) |
| Temple Terrace: | 1.8% (85) |
| Florida: | 0.0% (1,317) |
Place of birth for U.S.-born residents:
- This state: 11,784
- Other state: 9,715
- Northeast: 2,903
- Midwest: 2,302
- South: 3,043
- West: 1,462
79.0% of Temple Terrace residents lived in the same house 1 years ago.
Out of people who lived in different houses, 31.6% lived in this county.
Out of people who lived in different counties, 53.4% lived in Florida.
| Temple Terrace: | 79.0% |
| State average: | 86.3% |
Education attainment for males 25 years and older:
- No schooling: 97
- Nursery to 4th grade: 0
- 5th and 6th grade: 62
- 7th and 8th grade: 163
- 9th grade: 79
- 10th grade: 74
- 11th grade: 57
- 12th grade, no diploma: 195
- High school graduate (or equivalency): 1,867
- Less than 1 year of college: 366
- Some college more than 1 year, no degree: 1,085
- Associate degree: 1,250
- Bachelor's degree: 2,493
- Master's degree: 1,155
- Professional school degree: 236
- Doctorate degree: 349

Education attainment for females 25 years and older:
- No schooling: 72
- Nursery to 4th grade: 0
- 5th and 6th grade: 31
- 7th and 8th grade: 17
- 9th grade: 64
- 10th grade: 91
- 11th grade: 97
- 12th grade, no diploma: 198
- High school graduate (or equivalency): 1,696
- Less than 1 year of college: 413
- Some college more than 1 year, no degree: 1,025
- Associate degree: 1,056
- Bachelor's degree: 2,755
- Master's degree: 1,162
- Professional school degree: 123
- Doctorate degree: 152


Housing units in structures:
- One, detached: 5,056
- One, attached: 1,063
- Two: 124
- 3 or 4: 1,238
- 5 to 9: 1,301
- 10 to 19: 1,172
- 20 to 49: 1,032
- 50 or more: 847
- Mobile homes: 24
House/condo owner moved in on average 11 years ago
Renter moved in on average 1 years ago

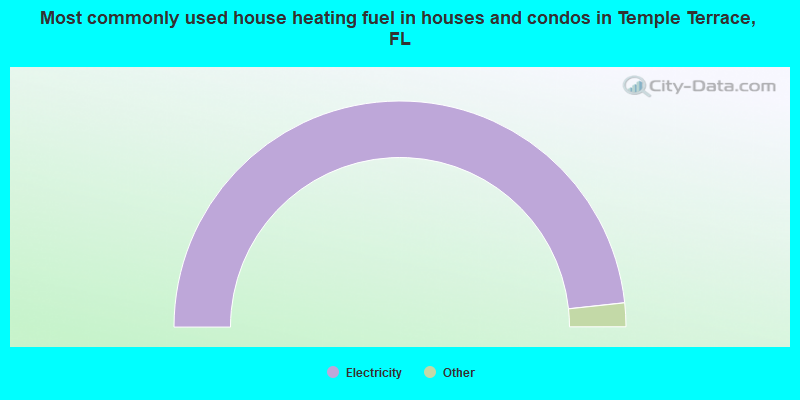
- 96.7%Electricity
- 1.5%Utility gas
- 0.8%Bottled, tank, or LP gas
- 0.8%Solar energy
- 0.2%Fuel oil, kerosene, etc.
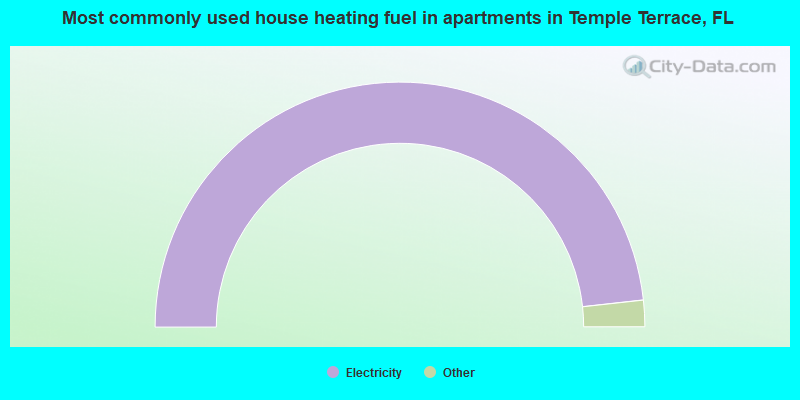
- 96.5%Electricity
- 2.9%Utility gas
- 0.3%Bottled, tank, or LP gas
- 0.3%No fuel used
Private vs. public school enrollment:
| Here: | 19.3% |
| Florida: | 15.8% |
| Here: | 21.0% |
| Florida: | 12.9% |
| Here: | 30.2% |
| Florida: | 23.6% |


