Shelbyville, KY (Kentucky) Houses and Residents
| Shelbyville: | $248,314 |
| Kentucky: | $196,300 |
Total population: 14,985 (Urban population: 9,630 (all inside urban clusters), Rural population: 796 (all nonfarm))
Houses: 6,889 (6,520 occupied: 3,670 owner occupied, 2,988 renter occupied)
| % of renters here: | 45% |
| State: | 31% |
Housing density: 911 houses/condos per square mile
Median price asked for vacant for-sale houses and condos in 2022: $152,421.
Median contract rent in 2022: $742 (lower quartile is $618, upper quartile is $965)
Median rent asked for vacant for-rent units in 2022: $966
Median gross rent in Shelbyville, KY in 2022: $935
Housing units in Shelbyville with a mortgage: 2,824 (135 second mortgage, 0 home equity loan, 128 both second mortgage and home equity loan)
Houses without a mortgage: 192
Median household income for houses/condos with a mortgage: $105,744
Median household income for apartments without a mortgage: $56,802
Median monthly housing costs: $1,026
Compare current foreclosures in Shelbyville, KY:
| Photo | Address | Area | Beds / Baths | Price | Details |
|---|---|---|---|---|---|

|
#1
Ponder Dr
Shelbyville, KY 40065
|
2,084 sq. feet
|
2 baths 3 beds |
show details | |

|
#2
Eagle Pass
Shelbyville, KY 40065
|
2,208 sq. feet
|
2 baths 3 beds |
show details | |

|
#3
Oakwood Dr
Shelbyville, KY 40065
|
1,000 sq. feet
|
1 baths 3 beds |
show details | |

|
#4
Hunting Hills Dr
Shelbyville, KY 40065
|
2,242 sq. feet
|
2 baths 4 beds |
show details | |

|
#5
Nordic Ct
Shelbyville, KY 40065
|
1,680 sq. feet
|
2 baths 4 beds |
show details | |

|
#6
Oakwood Dr
Shelbyville, KY 40065
|
1,000 sq. feet
|
1 baths 3 beds |
show details | |

|
#7
Hill N Dale Rd
Shelbyville, KY 40065
|
1,188 sq. feet
|
1 baths 2 beds |
show details | |

|
#8
Cherry Ln
Shelbyville, KY 40065
|
871 sq. feet
|
2 baths 4 beds |
show details | |

|
#9
Morning Glory Ln
Shelbyville, KY 40065
|
3,141 sq. feet
|
3 baths 3 beds |
show details | |

|
#10
Spring St
Shelbyville, KY 40065
|
1,025 sq. feet
|
1 baths 3 beds |
show details |
| Photo | Address | Area | Beds / Baths | Price | Details |
|---|---|---|---|---|---|

|
#11
Bluegrass Dr
Shelbyville, KY 40065
|
2,144 sq. feet
|
2 baths 3 beds |
show details | |

|
#12
Tipperary Xing
Shelbyville, KY 40065
|
1,367 sq. feet
|
2 baths 3 beds |
show details | |

|
#13
Brassfield Cir
Shelbyville, KY 40065
|
2,014 sq. feet
|
2 baths 3 beds |
show details | |

|
#14
Coors Dr
Shelbyville, KY 40065
|
1,008 sq. feet
|
- baths 3 beds |
show details | |

|
#15
Victoria Dr
Shelbyville, KY 40065
|
1,378 sq. feet
|
1 baths - beds |
show details | |

|
#16
Logan Station Rd
Shelbyville, KY 40065
|
- sq. feet
|
- baths - beds |
show details | |

|
#17
Cove Rd
Shelbyville, KY 40065
|
- sq. feet
|
- baths - beds |
show details | |

|
#18
Cherrywood Apartments
Shelbyville, KY 40065
|
- sq. feet
|
- baths - beds |
show details | |

|
#19
Old Mill Village Dr
Shelbyville, KY 40065
|
- sq. feet
|
- baths - beds |
show details | |

|
#20
Lakeview Dr Apt 290
Shelbyville, KY 40065
|
- sq. feet
|
- baths - beds |
show details |
| Photo | Address | Area | Beds / Baths | Price | Details |
|---|---|---|---|---|---|

|
#21
Scott Station Rd
Shelbyville, KY 40065
|
- sq. feet
|
- baths - beds |
show details | |

|
#22
Heron Dr
Shelbyville, KY 40065
|
- sq. feet
|
- baths - beds |
show details | |

|
#23
Tealwood Dr
Shelbyville, KY 40065
|
- sq. feet
|
- baths - beds |
show details | |

|
#24
Lakeview Dr Apt 95
Shelbyville, KY 40065
|
- sq. feet
|
- baths - beds |
show details | |

|
#25
Rockbridge Rd
Shelbyville, KY 40065
|
- sq. feet
|
- baths - beds |
show details | |

|
#26
Sanford Ln # 125
Shelbyville, KY 40065
|
- sq. feet
|
- baths - beds |
show details | |

|
#27
Frankfort Rd Apt 115
Shelbyville, KY 40065
|
- sq. feet
|
- baths - beds |
show details | |

|
#28
Karen Ct
Shelbyville, KY 40065
|
- sq. feet
|
- baths - beds |
show details | |

|
#29
Lakeview Dr Apt 131
Shelbyville, KY 40065
|
- sq. feet
|
- baths - beds |
show details | |

|
#30
Sanford Ln # 423
Shelbyville, KY 40065
|
- sq. feet
|
- baths - beds |
show details |
| Photo | Address | Area | Beds / Baths | Price | Details |
|---|---|---|---|---|---|

|
#31
Squire Cir
Shelbyville, KY 40065
|
- sq. feet
|
- baths - beds |
show details | |

|
#32
Saint Regis Dr
Shelbyville, KY 40065
|
- sq. feet
|
- baths - beds |
show details | |

|
#33
Daniel St
Shelbyville, KY 40065
|
- sq. feet
|
- baths - beds |
show details | |

|
#34
Geoghegan Rd
Shelbyville, KY 40065
|
1,766 sq. feet
|
- baths - beds |
show details | |

|
#35
Daniel St
Shelbyville, KY 40065
|
- sq. feet
|
- baths - beds |
show details | |

|
#36
Terry Ct
Shelbyville, KY 40065
|
- sq. feet
|
- baths - beds |
show details | |

|
#37
Old Brunerstown Rd # 126
Shelbyville, KY 40065
|
- sq. feet
|
- baths - beds |
show details | |

|
#38
Squire Cir
Shelbyville, KY 40065
|
- sq. feet
|
- baths - beds |
show details | |

|
#39
Hearthside Cir
Shelbyville, KY 40065
|
1,402 sq. feet
|
- baths - beds |
show details | |

|
#40
Breighton Cir # 522
Shelbyville, KY 40065
|
- sq. feet
|
- baths - beds |
show details |
| Photo | Address | Area | Beds / Baths | Price | Details |
|---|---|---|---|---|---|

|
#41
Nordic Ct
Shelbyville, KY 40065
|
- sq. feet
|
- baths - beds |
show details | |

|
#42
Elmburg Rd
Shelbyville, KY 40065
|
- sq. feet
|
- baths - beds |
show details | |

|
#43
Kingston Ct
Shelbyville, KY 40065
|
2,041 sq. feet
|
- baths - beds |
show details | |

|
#44
Blackwell Rd
Shelbyville, KY 40065
|
- sq. feet
|
- baths - beds |
show details | |

|
#45
Birchwood Cir
Shelbyville, KY 40065
|
- sq. feet
|
- baths - beds |
show details | |

|
#46
Village Ln
Shelbyville, KY 40065
|
- sq. feet
|
- baths - beds |
show details | |

|
#47
Ronnie Layne Rd
Shelbyville, KY 40065
|
- sq. feet
|
- baths - beds |
show details | |

|
#48
Maidie Ln
Shelbyville, KY 40065
|
- sq. feet
|
- baths - beds |
show details | |

|
#49
Hempridge Rd
Shelbyville, KY 40065
|
- sq. feet
|
- baths - beds |
show details | |

|
Check over 1 million property listings on Foreclosure.com!
|
browse all offers | |||

Latest news about housing in Shelbyville, KY collected exclusively by city-data.com from local newspapers, TV, and radio stations

 | Recommendation For Apartments (11 replies) |
| Home prices - can we even afford a house in a nice are of Louisville? (22 replies) |
| Shelbyville vs Bardstown (6 replies) |
| Home Prices in Central Kentucky (21 replies) |
| Second home in Louisville Area (8 replies) |
| Help with 3-day trip to KY (Louisville area) (13 replies) |

Median year apartment built: 1991
Household type by relationship:
Households: 17,274- Male householders: 3,084 (572 living alone), Female householders: 3,371 (980 living alone)
3,257 spouses (3,223 opposite-sex spouses), 493 unmarried partners, (453 opposite-sex unmarried partners), 5,319 children (4,994 natural, 96 adopted, 228 stepchildren), 152 grandchildren, 112 brothers or sisters, 337 parents, 0 foster children, 221 other relatives, 667 non-relatives
- In group quarters: 258
Size of family households: 1,849 2-persons, 1,063 3-persons, 1,038 4-persons, 429 5-persons, 139 6-persons, 35 7-or-more-persons.
Size of nonfamily households: 1,637 1-person, 365 2-persons, 16 3-persons, 37 4-persons, 16 5-persons.
2,782 married couples with children.
1,147 single-parent households (178 men, 969 women).
81.6% of residents of Shelbyville speak English at home.
15.1% of residents speak Spanish at home (57% speak English very well, 21% speak English well, 18% speak English not well, 5% don't speak English at all).
1.0% of residents speak other Indo-European language at home (100% speak English very well).
1.2% of residents speak Asian or Pacific Island language at home (56% speak English very well, 24% speak English well, 20% speak English not well).
1.4% of residents speak other language at home (3% speak English very well, 97% speak English well).
Foreign born population: 1,612 (9.3%)
(30.3% of them are naturalized citizens)
| Here: | 6.3 |
| State: | 6.4 |
| Here: | 4.6 |
| State: | 4.4 |

- Bedrooms in owner-occupied houses and condos in Shelbyville, Kentucky
- 0no bedroom
- 01 bedroom
- 3462 bedrooms
- 2,0633 bedrooms
- 1,1064 bedrooms
- 1555+ bedrooms

- Bedrooms in renter-occupied apartments in Shelbyville, Kentucky
- 170no bedroom
- 3581 bedroom
- 1,3432 bedrooms
- 1,0243 bedrooms
- 524 bedrooms
- 425+ bedrooms

- Cars and other vehicles available in Shelbyville in owner-occupied houses/condos
- 25no vehicle
- 6621 vehicle
- 2,0042 vehicles
- 7713 vehicles
- 2014 vehicles
- 85+ vehicles

- Cars and other vehicles available in Shelbyville in renter-occupied apartments
- 210no vehicle
- 1,4991 vehicle
- 1,0352 vehicles
- 2233 vehicles
- 224 vehicles
- 05+ vehicles

- Rooms in owner-occupied houses in Shelbyville, Kentucky
- 01 room
- 02 rooms
- 03 rooms
- 1274 rooms
- 9375 rooms
- 9646 rooms
- 3727 rooms
- 6468 rooms
- 6249+ rooms

- Rooms in renter-occupied apartments in Shelbyville, Kentucky
- 1701 room
- 1522 rooms
- 3883 rooms
- 6734 rooms
- 8605 rooms
- 3926 rooms
- 2437 rooms
- 538 rooms
- 599+ rooms


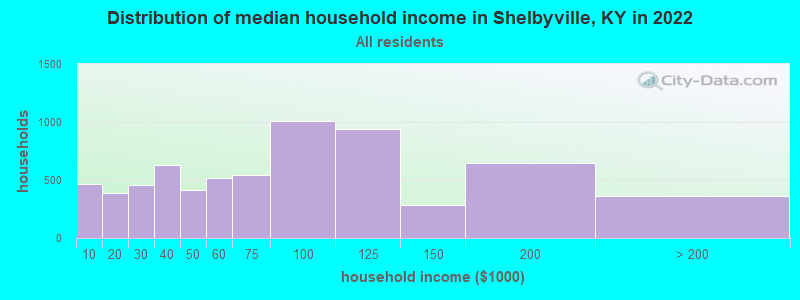
Shelbyville, KY household income distribution

- 467Less than $10,000
- 386$10,000 to $19,999
- 460$20,000 to $29,999
- 629$30,000 to $39,999
- 412$40,000 to $49,999
- 519$50,000 to $59,999
- 543$60,000 to $74,999
- 1,012$75,000 to $99,999
- 942$100,000 to $124,999
- 286$125,000 to $149,999
- 644$150,000 to $199,999
- 361$200,000 or more
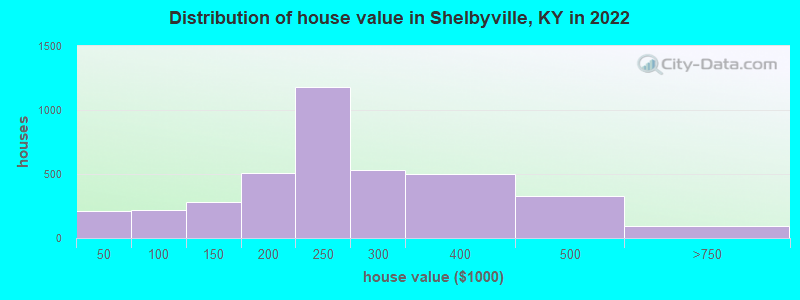
Home value of owner - occupied houses in 2022 in Shelbyville, KY
-
- 40Less than $10,000
- 94$10,000 to $14,999
- 7$20,000 to $24,999
- 13$30,000 to $34,999
- 11$35,000 to $39,999
- 45$40,000 to $49,999
- 46$60,000 to $69,999
- 52$70,000 to $79,999
- 25$80,000 to $89,999
- 46$90,000 to $99,999
- 95$100,000 to $124,999
- 185$125,000 to $149,999
- 236$150,000 to $174,999
- 267$175,000 to $199,999
- 1,179$200,000 to $249,999
- 532$250,000 to $299,999
- 498$300,000 to $399,999
- 331$400,000 to $499,999
- 75$500,000 to $749,999
- 21$2,000,000 or more
Rent paid by renters in 2022 in Shelbyville, KY
-
- 57Less than $100
- 10$100 to $149
- 127$150 to $199
- 11$200 to $249
- 13$250 to $299
- 37$300 to $349
- 19$350 to $399
- 34$400 to $449
- 72$450 to $499
- 195$500 to $549
- 33$550 to $599
- 267$600 to $649
- 409$650 to $699
- 225$700 to $749
- 187$750 to $799
- 374$800 to $899
- 176$900 to $999
- 309$1,000 to $1,249
- 233$1,250 to $1,499
- 89$1,500 to $1,999
- 21$3,500 or more
- 101No cash rent


Percentage of workers working in this county: 55.5%
Number of people working at home: 878 (9.7% of all workers)

Travel time to work (commute)
- Less than 5 minutes: 214
- 5 to 9 minutes: 1,215
- 10 to 14 minutes: 1,191
- 15 to 19 minutes: 1,225
- 20 to 24 minutes: 582
- 25 to 29 minutes: 663
- 30 to 34 minutes: 1,028
- 35 to 39 minutes: 422
- 40 to 44 minutes: 514
- 45 to 59 minutes: 655
- 60 to 89 minutes: 365
- 90 or more minutes: 142
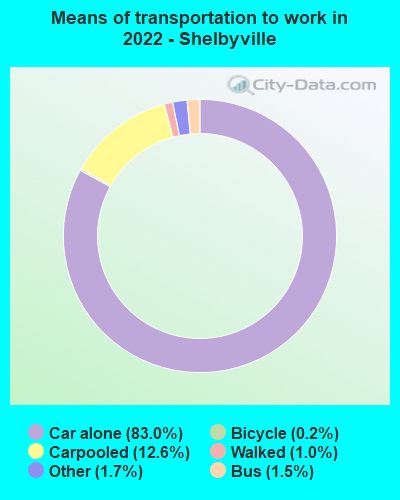
Means of transportation to work:
- Drove a car alone: 6,637 (74.1%)
- Carpooled: 1,107 (12.4%)
- Bus: 75 (0.8%)
- Taxi: 167 (1.9%)
- Bicycle: 13 (0.1%)
- Walked: 77 (0.9%)
- Worked at home: 878 (9.8%)

- Unemployment by race in 2022
- Unemployment rate for White non-Hispanic residents
- 1.2%Males
- 3.7%Females
- Unemployment rate for Black residents
- 7.8%Males
- Unemployment rate for two or more race residents
- 3.1%Males
- 3.4%Females
- Unemployment rate for Hispanic or Latino residents
- 1.1%Females

- Year of entry for the foreign-born population in Shelbyville, Kentucky
- 4552010 or later
- 6312000 to 2009
- 2941990 to 1999
- 591980 to 1989
- 611970 to 1979
- 39Before 1970

First ancestries reported:
- American: 1,406 (14.7%)
- English: 1,074 (11.2%)
- Irish: 789 (8.3%)
- German: 526 (5.5%)
- Scottish: 377 (3.9%)
- Scotch-Irish: 337 (3.5%)
- Senegalese: 205 (2.1%)
- Italian: 201 (2.1%)
- European: 165 (1.7%)
- British: 147 (1.5%)
- French: 37 (0.4%)
- Ethiopian: 36 (0.4%)
- Polish: 32 (0.3%)
- Dutch: 29 (0.3%)
- Scandinavian: 16 (0.2%)
- Swedish: 15 (0.2%)
- Welsh: 10 (0.1%)
- Hungarian: 9 (0.09%)
- Northern European: 6 (0.06%)
- Eastern European: 4 (0.04%)
Most common places of birth for foreign-born residents (%):
| Shelbyville: | 48.7% (815) |
| Kentucky: | 15.8% (29,070) |
| Shelbyville: | 22.1% (369) |
| Kentucky: | 3.7% (6,894) |
| Shelbyville: | 13.0% (218) |
| Kentucky: | 0.4% (782) |
| Shelbyville: | 6.1% (102) |
| Kentucky: | 4.2% (7,734) |
| Shelbyville: | 4.2% (71) |
| Kentucky: | 3.3% (6,109) |
| Shelbyville: | 2.6% (43) |
| Kentucky: | 8.0% (14,652) |
| Shelbyville: | 1.7% (29) |
| Kentucky: | 0.7% (1,372) |
Place of birth for U.S.-born residents:
- This state: 10,988
- Other state: 4,393
- Northeast: 486
- Midwest: 2,028
- South: 1,306
- West: 590
89.9% of Shelbyville residents lived in the same house 1 years ago.
Out of people who lived in different houses, 33.0% lived in this county.
Out of people who lived in different counties, 84.1% lived in Kentucky.
| Shelbyville: | 89.9% |
| State average: | 87.2% |
Education attainment for males 25 years and older:
- No schooling: 107
- Nursery to 4th grade: 0
- 5th and 6th grade: 76
- 7th and 8th grade: 84
- 9th grade: 39
- 10th grade: 245
- 11th grade: 145
- 12th grade, no diploma: 110
- High school graduate (or equivalency): 1,829
- Less than 1 year of college: 404
- Some college more than 1 year, no degree: 585
- Associate degree: 385
- Bachelor's degree: 999
- Master's degree: 266
- Professional school degree: 98
- Doctorate degree: 44

Education attainment for females 25 years and older:
- No schooling: 92
- Nursery to 4th grade: 16
- 5th and 6th grade: 101
- 7th and 8th grade: 207
- 9th grade: 172
- 10th grade: 121
- 11th grade: 171
- 12th grade, no diploma: 115
- High school graduate (or equivalency): 1,875
- Less than 1 year of college: 230
- Some college more than 1 year, no degree: 537
- Associate degree: 610
- Bachelor's degree: 900
- Master's degree: 701
- Professional school degree: 102
- Doctorate degree: 71


Housing units in structures:
- One, detached: 4,468
- One, attached: 383
- Two: 259
- 3 or 4: 494
- 5 to 9: 530
- 10 to 19: 437
- 20 to 49: 151
- 50 or more: 96
- Mobile homes: 67
Housing units lacking complete kitchen facilities in 2022: 1.1%
House/condo owner moved in on average 8 years ago
Renter moved in on average 4 years ago

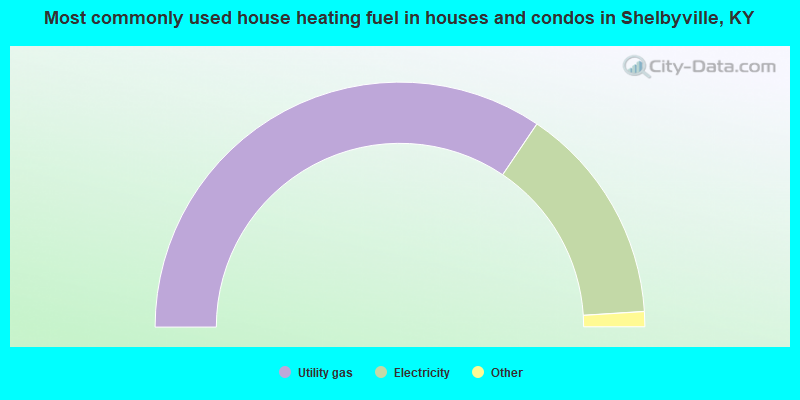
- 68.9%Utility gas
- 29.1%Electricity
- 1.4%Bottled, tank, or LP gas
- 0.3%No fuel used
- 0.3%Fuel oil, kerosene, etc.
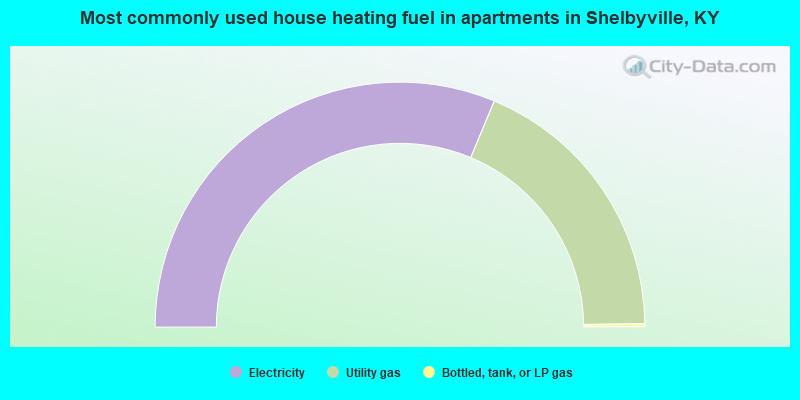
- 62.6%Electricity
- 37.0%Utility gas
- 0.4%Bottled, tank, or LP gas
Private vs. public school enrollment:
| Here: | 25.7% |
| Kentucky: | 17.2% |
| Here: | 14.8% |
| Kentucky: | 15.2% |
| Here: | 28.6% |
| Kentucky: | 19.6% |


