Santa Maria Valley, CA (California) Houses and Residents
| Santa Maria Valley: | $423,529 |
| California: | $715,900 |
Total population: 110,971 (Urban population: 108,309, Rural population: 2,494 (159 farm, 2,335 nonfarm))
Houses: 34,796 (33,825 occupied: 21,999 owner occupied, 11,826 renter occupied)
| % of renters here: | 35% |
| State: | 44% |
Housing density: 163 houses/condos per square mile
Median price asked for vacant for-sale houses and condos in 2022 in this county: $300,986.
Median contract rent in 2022: $1,507 (lower quartile is $1,187, upper quartile is $1,918)
Median rent asked for vacant for-rent units in 2022: $1,480
Median gross rent in Santa Maria Valley, CA in 2022: $1,653
Housing units in Santa Maria Valley with a mortgage: 13,980 (2,224 second mortgage, 1,349 home equity loan, 72 both second mortgage and home equity loan)
Houses without a mortgage: 4,431


Household type by relationship:
Households: 406,113- In family households: 328,096 (63,927 male householders, 27,673 female householders)
68,834 spouses, 113,869 children (107,701 natural, 2,244 adopted, 3,924 stepchildren), 9,655 grandchildren, 6,308 brothers or sisters, 4,394 parents, foster children, 11,429 other relatives, 17,914 non-relatives
- In nonfamily households: 78,017 (22,866 male householders (14,680 living alone)), 27,638 female householders (20,578 living alone)), 27,513 nonrelatives
- In group quarters: 17,782 (5,917 institutionalized population)
68,080 married couples with children.
18,812 single-parent households (4,951 men, 13,861 women).
59.1% of residents of Santa Maria Valley speak English at home.
35.7% of residents speak Spanish at home (41% speak English very well, 19% speak English well, 20% speak English not well, 21% don't speak English at all).
1.7% of residents speak other Indo-European language at home (76% speak English very well, 17% speak English well, 6% speak English not well, 1% don't speak English at all).
3.1% of residents speak Asian or Pacific Island language at home (52% speak English very well, 32% speak English well, 15% speak English not well).
0.4% of residents speak other language at home (29% speak English very well, 18% speak English well, 16% speak English not well, 37% don't speak English at all).
Foreign born population: 30,588 (24.8%)
(34.1% of them are naturalized citizens)
| Here: | 6.0 |
| State: | 6.0 |
| Here: | 3.9 |
| State: | 3.9 |

- Bedrooms in owner-occupied houses and condos in Santa Maria Valley, California
- 569no bedroom
- 9721 bedroom
- 4,5602 bedrooms
- 10,5563 bedrooms
- 4,7454 bedrooms
- 5975+ bedrooms

- Bedrooms in renter-occupied apartments in Santa Maria Valley, California
- 1,487no bedroom
- 3,0781 bedroom
- 3,6752 bedrooms
- 2,9163 bedrooms
- 6154 bedrooms
- 555+ bedrooms

- Cars and other vehicles available in Santa Maria Valley in owner-occupied houses/condos
- 856no vehicle
- 5,7431 vehicle
- 9,8532 vehicles
- 3,8293 vehicles
- 1,1854 vehicles
- 5335+ vehicles

- Cars and other vehicles available in Santa Maria Valley in renter-occupied apartments
- 1,385no vehicle
- 5,2121 vehicle
- 3,7692 vehicles
- 9603 vehicles
- 4234 vehicles
- 775+ vehicles

- Rooms in owner-occupied houses in Santa Maria Valley, California
- 601 room
- 2802 rooms
- 2,0483 rooms
- 2,0794 rooms
- 4,9155 rooms
- 5,9876 rooms
- 3,5897 rooms
- 1,9668 rooms
- 1,0759+ rooms

- Rooms in renter-occupied apartments in Santa Maria Valley, California
- 7991 room
- 1,7732 rooms
- 2,2723 rooms
- 2,5814 rooms
- 2,1805 rooms
- 1,3916 rooms
- 5907 rooms
- 1658 rooms
- 759+ rooms


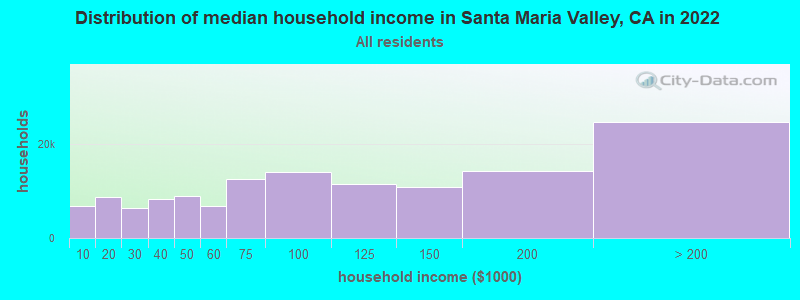
Santa Maria Valley, CA household income distribution

- 6,702Less than $10,000
- 8,730$10,000 to $19,999
- 6,360$20,000 to $29,999
- 8,309$30,000 to $39,999
- 9,002$40,000 to $49,999
- 6,868$50,000 to $59,999
- 12,553$60,000 to $74,999
- 13,934$75,000 to $99,999
- 11,542$100,000 to $124,999
- 10,737$125,000 to $149,999
- 14,303$150,000 to $199,999
- 24,602$200,000 or more
Percentage of workers working in this county: 87.5%
Number of people working at home: 6,754 (13.4% of all workers)
Travel time to work (commute)
- Less than 5 minutes: 1,281
- 5 to 9 minutes: 6,582
- 10 to 14 minutes: 10,215
- 15 to 19 minutes: 8,441
- 20 to 24 minutes: 4,859
- 25 to 29 minutes: 1,506
- 30 to 34 minutes: 4,788
- 35 to 39 minutes: 695
- 40 to 44 minutes: 714
- 45 to 59 minutes: 1,573
- 60 to 89 minutes: 1,521
- 90 or more minutes: 712
Means of transportation to work:
- Drove a car alone: 31,052 (70.8%)
- Carpooled: 9,919 (22.6%)
- Bus or trolley bus: 281 (0.6%)
- Streetcar or trolley car: 17 (0.0%)
- Motorcycle: 128 (0.3%)
- Bicycle: 343 (0.8%)
- Walked: 632 (1.4%)
- Other means: 515 (1.2%)
- Worked at home: 969 (2.2%)


- Year of entry for the foreign-born population in Santa Maria Valley, California
- 5,8581995 to March 2000
- 5,7551990 to 1994
- 5,2331985 to 1989
- 3,1791980 to 1984
- 2,3041975 to 1979
- 1,8121970 to 1974
- 9491965 to 1969
- 2,643Before 1965
Most common places of birth for foreign-born residents (%):
| Santa Maria Valley: | 79.3% (22,005) |
| California: | 44.3% (3,928,701) |
| Santa Maria Valley: | 7.2% (1,999) |
| California: | 7.5% (664,935) |
| Santa Maria Valley: | 1.5% (418) |
| California: | 1.6% (141,181) |
Place of birth for U.S.-born residents:
- This state: 57,929
- Other state: 23,999
- Northeast: 3,851
- Midwest: 8,371
- South: 6,081
- West: 5,696
52% of Santa Maria Valley residents lived in the same house 5 years ago.
Out of people who lived in different houses, 73% lived in this county.
Out of people who lived in different counties, 71% lived in California.
Education attainment for males 25 years and older:
- No schooling: 1,157
- Nursery to 4th grade: 1,007
- 5th and 6th grade: 2,665
- 7th and 8th grade: 1,294
- 9th grade: 888
- 10th grade: 844
- 11th grade: 1,028
- 12th grade, no diploma: 1,449
- High school graduate (or equivalency): 6,901
- Less than 1 year of college: 2,162
- Some college more than 1 year, no degree: 4,862
- Associate degree: 2,207
- Bachelor's degree: 3,497
- Master's degree: 1,468
- Professional school degree: 421
- Doctorate degree: 166

Education attainment for females 25 years and older:
- No schooling: 1,186
- Nursery to 4th grade: 937
- 5th and 6th grade: 2,066
- 7th and 8th grade: 1,204
- 9th grade: 1,020
- 10th grade: 905
- 11th grade: 1,051
- 12th grade, no diploma: 1,337
- High school graduate (or equivalency): 8,319
- Less than 1 year of college: 3,267
- Some college more than 1 year, no degree: 5,583
- Associate degree: 2,529
- Bachelor's degree: 2,992
- Master's degree: 1,136
- Professional school degree: 299
- Doctorate degree: 82


Housing units in structures:
- One, detached: 23,477
- One, attached: 1,913
- Two: 598
- 3 or 4: 1,243
- 5 to 9: 1,304
- 10 to 19: 1,180
- 20 to 49: 688
- 50 or more: 1,506
- Mobile homes: 2,839
- Boats, RVs, vans, etc.: 48
Median worth of mobile homes: $96,564
Housing units lacking complete kitchen facilities: 1.0%

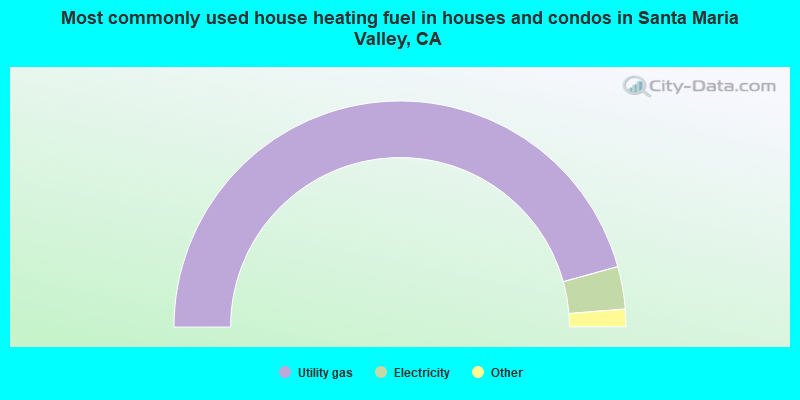
- 91.4%Utility gas
- 6.1%Electricity
- 1.1%Bottled, tank, or LP gas
- 0.7%Wood
- 0.6%No fuel used
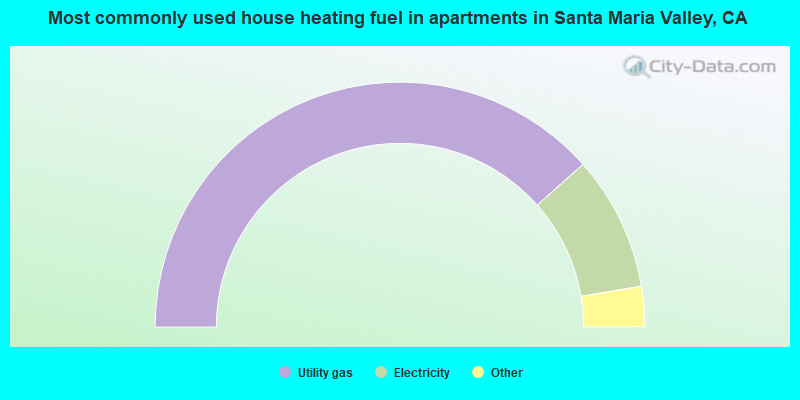
- 76.9%Utility gas
- 17.8%Electricity
- 2.4%No fuel used
- 2.3%Bottled, tank, or LP gas
- 0.3%Wood
- 0.2%Other fuel
- 0.1%Solar energy
Private vs. public school enrollment:
| Here: | 5.9% |
| California: | 9.9% |
| Here: | 7.2% |
| California: | 7.8% |
| Here: | 7.7% |
| California: | 15.4% |


