Sanford, FL (Florida) Houses and Residents
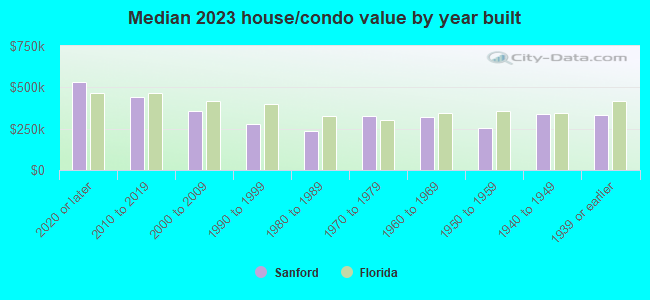
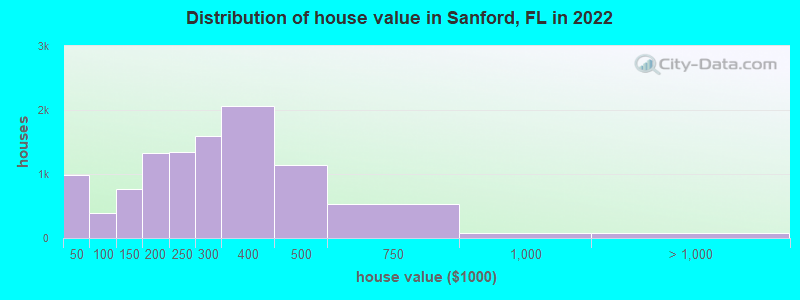
Estimated median house or condo value in 2022: $283,185 (it was $72,800 in 2000 )
Sanford:
$283,185Florida:
$354,100
Lower value quartile - upper value quartile: $203,192 - $381,863Total population: 57,525 (Urban population: 37,484, Rural population: 113 (all nonfarm) )
Houses: 26,132 (24,275 occupied: 12,625 owner occupied, 11,831 renter occupied )
% of renters here:
48%State:
33%
Housing density: 1,368 houses/condos per square mile
Median price asked for vacant for-sale houses and condos in 2022: $218,181.
Median contract rent in 2022: $1,311 (lower quartile is $1,063, upper quartile is $1,636)
Median rent asked for vacant for-rent units in 2022: $1,645
Median gross rent in Sanford, FL in 2022: $1,486
Housing units in Sanford with a mortgage: 8,161 (571 second mortgage, 121 home equity loan, 334 both second mortgage and home equity loan )Houses without a mortgage: 94
Median household income for houses/condos with a mortgage: $93,477
Median household income for apartments without a mortgage: $59,482
Median monthly housing costs: $1,348
Data:
Median house or condo value ($)
Median house or condo value ($ change since 2000)
Median house or condo value ($) - White
Median house or condo value ($) - Black or African American
Median house or condo value ($) - Asian
Median house or condo value ($) - Hispanic or Latino
Median house or condo value ($) - American Indian and Alaska Native
Median house or condo value ($) - Multirace
Median house or condo value ($) - Other Race
Median price asked for mobile homes ($)
Household density (households per square mile)
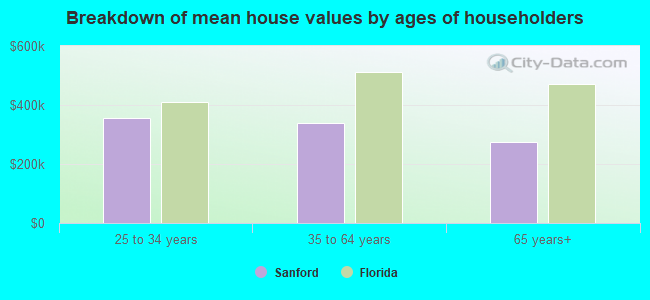
Mean house or condo value by units in structure - 1, detached ($)
Mean house or condo value by units in structure - 1, attached ($)
Mean house or condo value by units in structure - 2 ($)
Mean house or condo value by units in structure by units in structure - 3 or 4 ($)
Mean house or condo value by units in structure - 5 or more ($)
Mean house or condo value by units in structure - Boat, RV, van, etc. ($)
Mean house or condo value by units in structure - Mobile home ($)
Median contract rent ($)
Median contract rent - Lower quartile ($)
Median contract rent - Upper quartile ($)
Median gross rent ($)
Urban houses (%)
Rural houses (%)
Houses occupied (%)
Houses occupied (% change since 2000)
Houses owner occupied (%)
Houses owner occupied (% change since 2000)
Houses renter occupied (%)
Houses renter occupied (% change since 2000)
Vacant housing units - For rent (%)
Vacant housing units - For rent (% change since 2000)
Vacant housing units - For sale only (%)
Vacant housing units - For sale only (% change since 2000)
Vacant housing units - Rented or sold, not occupied (%)
Vacant housing units - Rented or sold, not occupied (% change since 2000)
Vacant housing units - For seasonal, recreational, or occasional use (%)
Vacant housing units - For seasonal, recreational, or occasional use (% change since 2000)
Vacant housing units - For migrant workers (%)
Vacant housing units - For migrant workers (% change since 2000)
Vacant housing units - Other vacant (%)
Vacant housing units - Other vacant (% change since 2000)
Median monthly housing costs ($)
Median household income for houses/condos with a mortgage ($)
Median household income for houses/condos without a mortgage ($)
Median household income ($)
Median household income ($) - White
Median household income ($) - Black or African American
Median household income ($) - Asian
Median household income ($) - Hispanic or Latino
Median household income ($) - American Indian and Alaska Native
Median household income ($) - Multirace
Median household income ($) - Other Race
Mortgage status - with mortgage (%)
Mortgage status - with second mortgage (%)
Mortgage status - with home equity loan (%)
Mortgage status - with both second mortgage and home equity loan (%)
Mortgage status - without a mortgage (%)
Median year house/condo built
Median year apartment built
Household type by relationship - Male householder living alone (%)
Household type by relationship - Male householder not living alone (%)
Household type by relationship - Female householder living alone (%)
Household type by relationship - Female householder not living alone (%)
Household type by relationship - Opposite-Sex spouse (%)
Household type by relationship - Same-Sex spouse (%)
Household type by relationship - Opposite-Sex unmarried partner (%)
Household type by relationship - Same-Sex unmarried partner (%)
Household type by relationship - In group quarters (%)
Size of family households - 2-person household (%)
Size of family households - 3-person household (%)
Size of family households - 4-person household (%)
Size of family households - 5-person household (%)
Size of family households - 6-person household (%)
Size of family households - 7-or-more-person household (%)
Size of nonfamily households - 1-person household (%)
Size of nonfamily households - 2-person household (%)
Size of nonfamily households - 3-person household (%)
Size of nonfamily households - 4-person household (%)
Size of nonfamily households - 5-person household (%)
Size of nonfamily households - 6-person household (%)
Size of nonfamily households - 7-or-moreperson household (%)
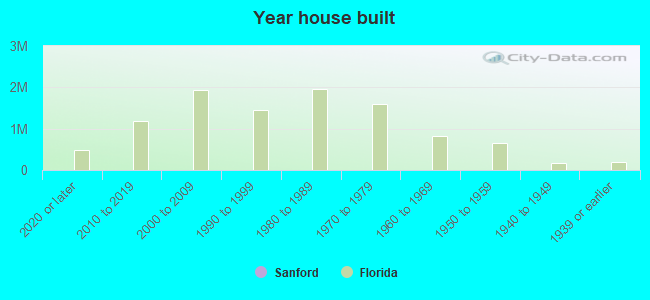
Year house built - Built 2010 or later (%)
Year house built - Built 2000 to 2009 (%)
Year house built - Built 1990 to 1999 (%)
Year house built - Built 1980 to 1989 (%)
Year house built - Built 1970 to 1979 (%)
Year house built - Built 1960 to 1969 (%)
Year house built - Built 1950 to 1959 (%)
Year house built - Built 1940 to 1949 (%)
Year house built - Built 1939 or earlier (%)
Median number of rooms in houses and condos
Median number of rooms in apartments
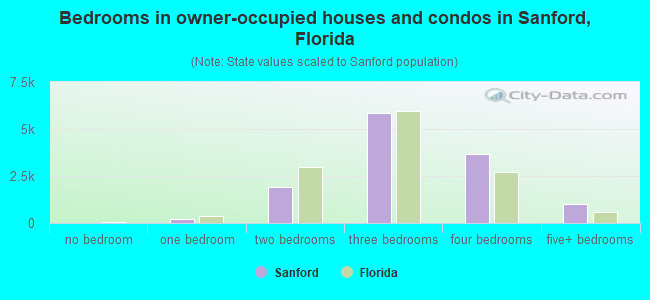
Median number of bedrooms in owner occupied houses
Mean number of bedrooms in owner occupied houses
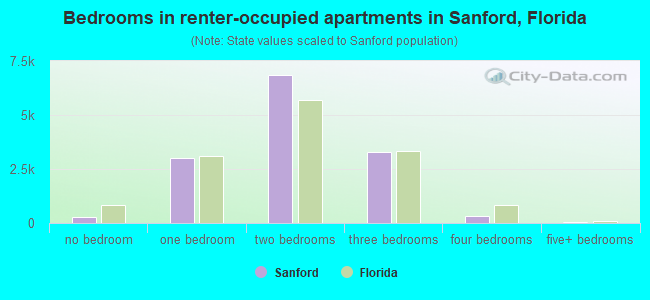
Median number of bedrooms in renter occupied houses
Mean number of bedrooms in renter occupied houses
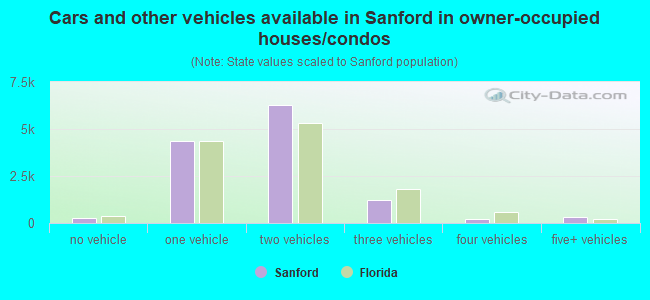
Median number of vehichles in owner occupied houses
Mean number of vehichles in owner occupied houses
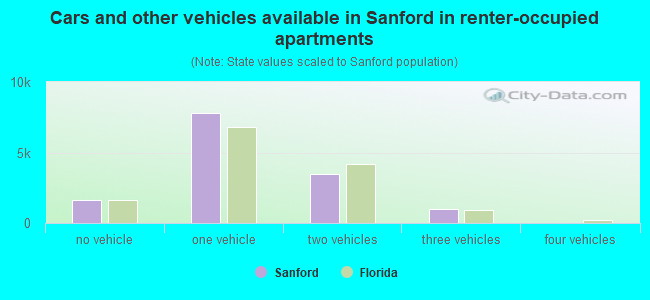
Median number of vehichles in renter occupied houses
Mean number of vehichles in renter occupied houses
Rooms in owner-occupied houses - 1 room (%)
Rooms in owner-occupied houses - 2 rooms (%)
Rooms in owner-occupied houses - 3 rooms (%)
Rooms in owner-occupied houses - 4 rooms (%)
Rooms in owner-occupied houses - 5 rooms (%)
Rooms in owner-occupied houses - 6 rooms (%)
Rooms in owner-occupied houses - 7 rooms (%)
Rooms in owner-occupied houses - 8 rooms (%)
Rooms in owner-occupied houses - 9+ rooms (%)
Rooms in renter-occupied houses - 1 room (%)
Rooms in renter-occupied houses - 2 rooms (%)
Rooms in renter-occupied houses - 3 rooms (%)
Rooms in renter-occupied houses - 4 rooms (%)
Rooms in renter-occupied houses - 5 rooms (%)
Rooms in renter-occupied houses - 6 rooms (%)
Rooms in renter-occupied houses - 7 rooms (%)
Rooms in renter-occupied houses - 8 rooms (%)
Rooms in renter-occupied houses - 9+ rooms (%)
Bedrooms in owner-occupied houses - no bedrooms (%)
Bedrooms in owner-occupied houses - 1 bedroom (%)
Bedrooms in owner-occupied houses - 2 bedrooms (%)
Bedrooms in owner-occupied houses - 3 bedrooms (%)
Bedrooms in owner-occupied houses - 4 bedrooms (%)
Bedrooms in owner-occupied houses - 5+ bedrooms (%)
Bedrooms in renter-occupied houses - no bedrooms (%)
Bedrooms in renter-occupied houses - 1 bedroom (%)
Bedrooms in renter-occupied houses - 2 bedrooms (%)
Bedrooms in renter-occupied houses - 3 bedrooms (%)
Bedrooms in renter-occupied houses - 4 bedrooms (%)
Bedrooms in renter-occupied houses - 5+ bedrooms (%)
Vehicles available in owner-occupied houses - no vehicle available (%)
Vehicles available in owner-occupied houses - 1 vehicle available(%)
Vehicles available in owner-occupied houses - 2 Vehicles available (%)
Vehicles available in owner-occupied houses - 3 Vehicles available (%)
Vehicles available in owner-occupied houses - 4 Vehicles available (%)
Vehicles available in owner-occupied houses - 5+ Vehicles available (%)
Vehicles available in renter-occupied houses - no vehicle available (%)
Vehicles available in renter-occupied houses - 1 vehicle available (%)
Vehicles available in renter-occupied houses - 2 Vehicles available (%)
Vehicles available in renter-occupied houses - 3 Vehicles available (%)
Vehicles available in renter-occupied houses - 4 Vehicles available (%)
Vehicles available in renter-occupied houses - 5+ Vehicles available (%)
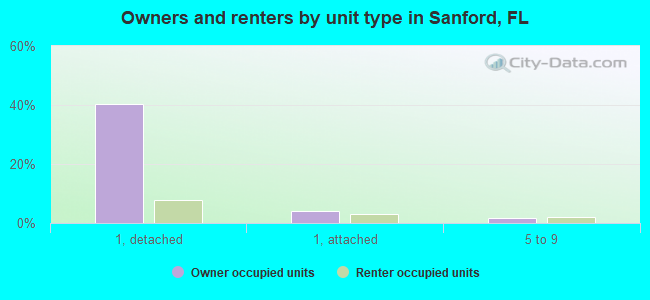
Housing units in structures - 1, detached (%)
Housing units in structures - 1, attached (%)
Housing units in structures - 2 (%)
Housing units in structures - 3 or 4 (%)
Housing units in structures - 5 to 9 (%)
Housing units in structures - 10 to 19 (%)
Housing units in structures - 20 to 49 (%)
Housing units in structures - 50 or more (%)
Housing units in structures - Mobile home (%)
Housing units in structures - Boat, RV, van, etc. (%)
Housing units in structures - Owners - 1, detached (%)
Housing units in structures - Owners - 1, attached (%)
Housing units in structures - Owners - 2 (%)
Housing units in structures - Owners - 3 or 4 (%)
Housing units in structures - Owners - 5 to 9 (%)
Housing units in structures - Owners - 10 to 19 (%)
Housing units in structures - Owners - 20 to 49 (%)
Housing units in structures - Owners - 50 or more (%)
Housing units in structures - Owners - Mobile home (%)
Housing units in structures - Owners - Boat, RV, van, etc. (%)
Housing units in structures - Renters - 1, detached (%)
Housing units in structures - Renters - 1, attached (%)
Housing units in structures - Renters - 2 (%)
Housing units in structures - Renters - 3 or 4 (%)
Housing units in structures - Renters - 5 to 9 (%)
Housing units in structures - Renters - 10 to 19 (%)
Housing units in structures - Renters - 20 to 49 (%)
Housing units in structures - Renters - 50 or more (%)
Housing units in structures - Renters - Mobile home (%)
Housing units in structures - Renters - Boat, RV, van, etc. (%)
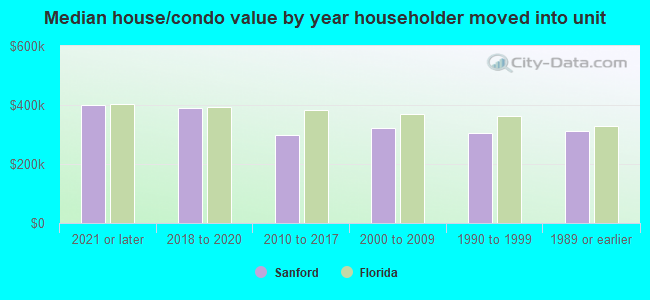
House/condo owner moved in on average (years ago)
Renter moved in on average (years ago)
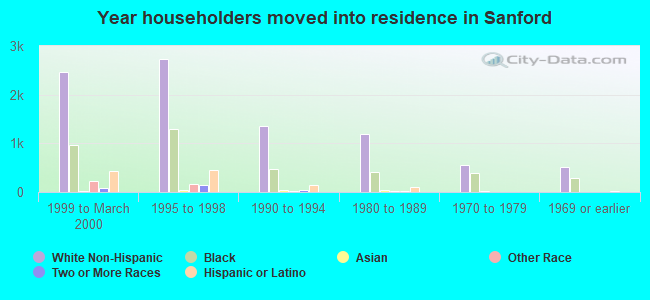
Year householder moved into unit - Moved in 1999 to March 2000 (%)
Year householder moved into unit - Moved in 1999 to March 2000 (%) - White
Year householder moved into unit - Moved in 1999 to March 2000 (%) - Black or African American
Year householder moved into unit - Moved in 1999 to March 2000 (%) - Asian
Year householder moved into unit - Moved in 1999 to March 2000 (%) - Hispanic or Latino
Year householder moved into unit - Moved in 1999 to March 2000 (%) - American Indian and Alaska Native
Year householder moved into unit - Moved in 1999 to March 2000 (%) - Multirace
Year householder moved into unit - Moved in 1999 to March 2000 (%) - Other Race
Year householder moved into unit - Moved in 1995 to 1998 (%)
Year householder moved into unit - Moved in 1995 to 1998 (%) - White
Year householder moved into unit - Moved in 1995 to 1998 (%) - Black or African American
Year householder moved into unit - Moved in 1995 to 1998 (%) - Asian
Year householder moved into unit - Moved in 1995 to 1998 (%) - Hispanic or Latino
Year householder moved into unit - Moved in 1995 to 1998 (%) - American Indian and Alaska Native
Year householder moved into unit - Moved in 1995 to 1998 (%) - Multirace
Year householder moved into unit - Moved in 1995 to 1998 (%) - Other Race
Year householder moved into unit - Moved in 1990 to 1994 (%)
Year householder moved into unit - Moved in 1990 to 1994 (%) - White
Year householder moved into unit - Moved in 1990 to 1994 (%) - Black or African American
Year householder moved into unit - Moved in 1990 to 1994 (%) - Asian
Year householder moved into unit - Moved in 1990 to 1994 (%) - Hispanic or Latino
Year householder moved into unit - Moved in 1990 to 1994 (%) - American Indian and Alaska Native
Year householder moved into unit - Moved in 1990 to 1994 (%) - Multirace
Year householder moved into unit - Moved in 1990 to 1994 (%) - Other Race
Year householder moved into unit - Moved in 1980 to 1989 (%)
Year householder moved into unit - Moved in 1980 to 1989 (%) - White
Year householder moved into unit - Moved in 1980 to 1989 (%) - Black or African American
Year householder moved into unit - Moved in 1980 to 1989 (%) - Asian
Year householder moved into unit - Moved in 1980 to 1989 (%) - Hispanic or Latino
Year householder moved into unit - Moved in 1980 to 1989 (%) - American Indian and Alaska Native
Year householder moved into unit - Moved in 1980 to 1989 (%) - Multirace
Year householder moved into unit - Moved in 1980 to 1989 (%) - Other Race
Year householder moved into unit - Moved in 1970 to 1979 (%)
Year householder moved into unit - Moved in 1970 to 1979 (%) - White
Year householder moved into unit - Moved in 1970 to 1979 (%) - Black or African American
Year householder moved into unit - Moved in 1970 to 1979 (%) - Asian
Year householder moved into unit - Moved in 1970 to 1979 (%) - Hispanic or Latino
Year householder moved into unit - Moved in 1970 to 1979 (%) - American Indian and Alaska Native
Year householder moved into unit - Moved in 1970 to 1979 (%) - Multirace
Year householder moved into unit - Moved in 1970 to 1979 (%) - Other Race
Year householder moved into unit - Moved in 1969 or earlier (%)
Year householder moved into unit - Moved in 1969 or earlier (%) - White
Year householder moved into unit - Moved in 1969 or earlier (%) - Black or African American
Year householder moved into unit - Moved in 1969 or earlier (%) - Asian
Year householder moved into unit - Moved in 1969 or earlier (%) - Hispanic or Latino
Year householder moved into unit - Moved in 1969 or earlier (%) - American Indian and Alaska Native
Year householder moved into unit - Moved in 1969 or earlier (%) - Multirace
Year householder moved into unit - Moved in 1969 or earlier (%) - Other Race
Housing units lacking complete plumbing facilities (%)
Housing units lacking complete kitchen facilities (%)
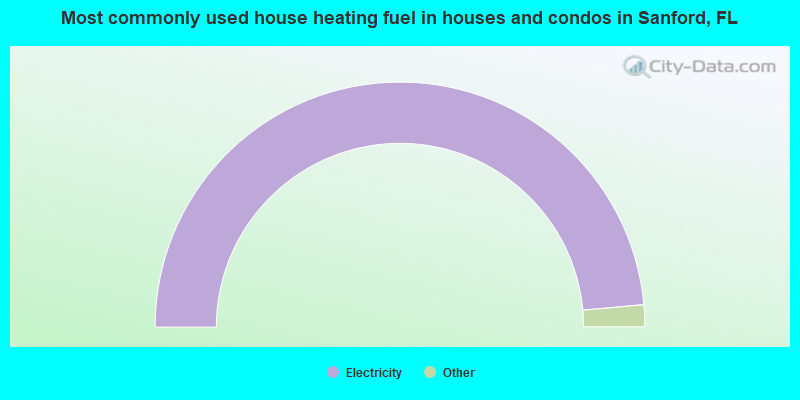
House heating fuel used in houses and condos - Utility gas (%)
House heating fuel used in houses and condos - Bottled, tank, or LP gas (%)
House heating fuel used in houses and condos - Electricity (%)
House heating fuel used in houses and condos - Fuel oil, kerosene, etc. (%)
House heating fuel used in houses and condos - Coal or coke (%)
House heating fuel used in houses and condos - Wood (%)
House heating fuel used in houses and condos - Solar energy (%)
House heating fuel used in houses and condos - Other fuel (%)
House heating fuel used in houses and condos - No fuel used (%)
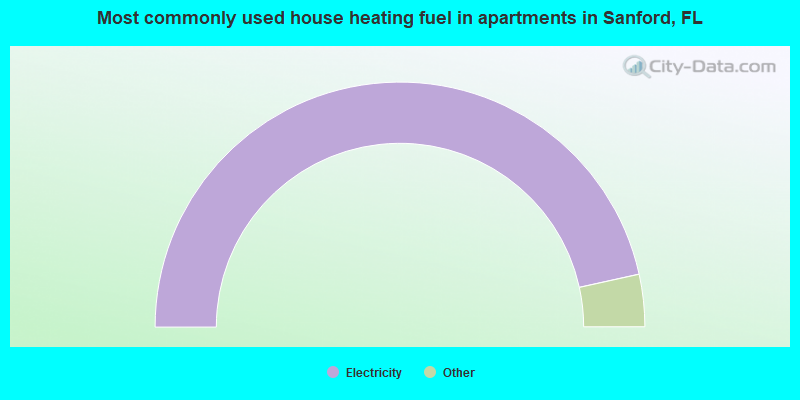
House heating fuel used in apartments - Utility gas (%)
House heating fuel used in apartments - Bottled, tank, or LP gas (%)
House heating fuel used in apartments - Electricity (%)
House heating fuel used in apartments - Fuel oil, kerosene, etc. (%)
House heating fuel used in apartments - Coal or coke (%)
House heating fuel used in apartments - Wood (%)
House heating fuel used in apartments - Solar energy (%)
House heating fuel used in apartments - Other fuel (%)
House heating fuel used in apartments - No fuel used (%)
Latest news about housing in Sanford, FL collected exclusively by city-data.com from local newspapers, TV, and radio stations
Median year house/condo built: 1989Median year apartment built: 1992Household type by relationship:
Households: 62,240
Male householders: 11,378 (3,130 living alone ), Female householders: 12,679 (4,020 living alone )8,956 spouses (8,777 opposite-sex spouses ), 2,213 unmarried partners , (2,127 opposite-sex unmarried partners ), 18,073 children (17,118 natural , 247 adopted , 707 stepchildren ), 1,823 grandchildren , 772 brothers or sisters , 1,351 parents , 5 foster children , 1,304 other relatives , 2,557 non-relatives In group quarters: 1,126
Size of family households: 5,490 2-persons , 3,160 3-persons , 3,456 4-persons , 1,668 5-persons , 603 6-persons , 250 7-or-more-persons .
Size of nonfamily households: 7,062 1-person , 2,062 2-persons , 472 3-persons , 339 4-persons , 1 5-persons , 50 7-or-more-persons .
6,404 married couples with children. single-parent households (800 men , 4,226 women ).
72.6% of residents of Sanford speak English at home. of residents speak Spanish at home (58% speak English very well , 17% speak English well , 19% speak English not well , 6% don't speak English at all ).of residents speak other Indo-European language at home (64% speak English very well , 31% speak English well , 4% speak English not well , 1% don't speak English at all ).of residents speak Asian or Pacific Island language at home (53% speak English very well , 18% speak English well , 23% speak English not well , 7% don't speak English at all ).of residents speak other language at home (70% speak English very well , 21% speak English well , 10% speak English not well ).
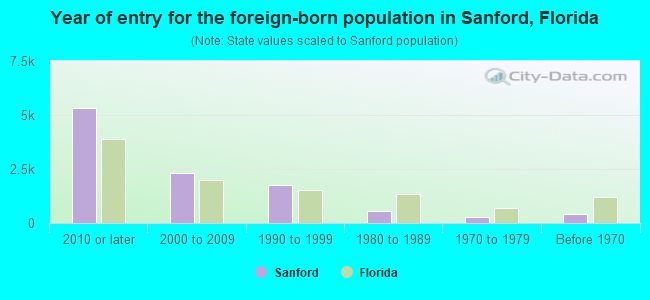
Foreign born population: 11,665 (18.7%)of them are naturalized citizens )
Median number of rooms in houses and condos:
Median number of rooms in apartments
Owner-occupied Renter-occupied
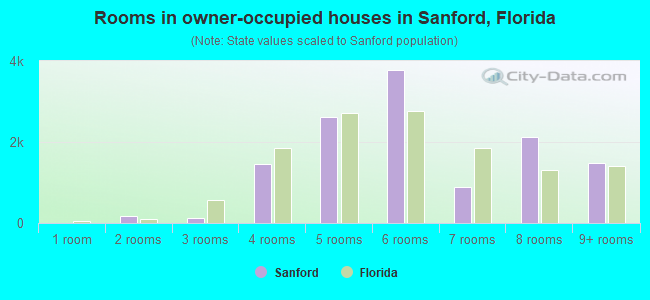
Rooms in owner-occupied houses in Sanford, Florida
48 1 room 170 2 rooms 569 3 rooms 1,352 4 rooms 2,610 5 rooms 3,054 6 rooms 1,457 7 rooms 1,634 8 rooms 1,733 9+ rooms
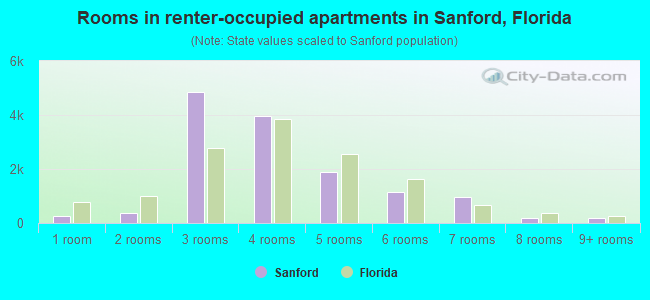
Rooms in renter-occupied apartments in Sanford, Florida
376 1 room 1,252 2 rooms 2,140 3 rooms 3,319 4 rooms 2,195 5 rooms 1,260 6 rooms 825 7 rooms 171 8 rooms 293 9+ rooms
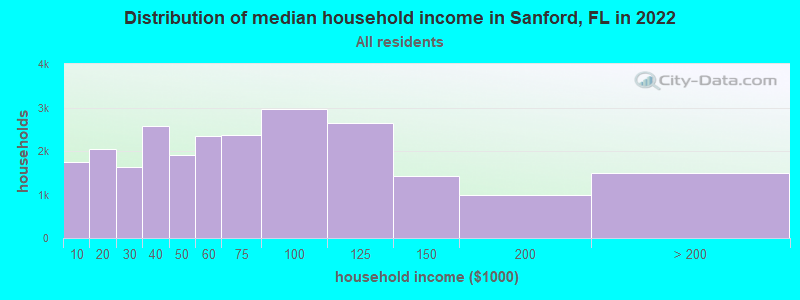
Sanford, FL household income distribution 1,737 Less than $10,0002,044 $10,000 to $19,9991,626 $20,000 to $29,9992,564 $30,000 to $39,9991,897 $40,000 to $49,9992,339 $50,000 to $59,9992,363 $60,000 to $74,9992,966 $75,000 to $99,9992,651 $100,000 to $124,9991,422 $125,000 to $149,999995 $150,000 to $199,9991,487 $200,000 or more
Home value of owner - occupied houses in 2022 in Sanford, FL 254 Less than $10,000261 $10,000 to $14,99929 $15,000 to $19,99976 $20,000 to $24,99959 $25,000 to $29,99971 $30,000 to $34,999192 $35,000 to $39,99947 $40,000 to $49,99973 $50,000 to $59,99944 $60,000 to $69,99924 $70,000 to $79,99983 $80,000 to $89,999117 $90,000 to $99,999388 $100,000 to $124,999378 $125,000 to $149,999612 $150,000 to $174,999720 $175,000 to $199,9991,343 $200,000 to $249,9991,600 $250,000 to $299,9992,060 $300,000 to $399,9991,146 $400,000 to $499,999524 $500,000 to $749,99972 $750,000 to $999,99964 $1,000,000 to $1,499,99919 $2,000,000 or moreRent paid by renters in 2022 in Sanford, FL 9 $100 to $14988 $150 to $1996 $250 to $29939 $400 to $44977 $450 to $499215 $500 to $54973 $550 to $599142 $600 to $64941 $650 to $699147 $700 to $74988 $750 to $799787 $800 to $899832 $900 to $9992,601 $1,000 to $1,2492,294 $1,250 to $1,4992,934 $1,500 to $1,999399 $2,000 to $2,49983 $2,500 to $2,999133 $3,000 to $3,499683 No cash rent
Percentage of workers working in this county: 82.1%Number of people working at home: 6,252 (19.8% of all workers )
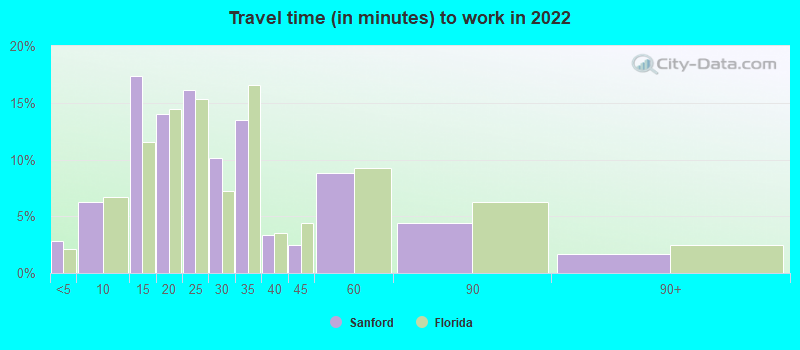
Travel time to work (commute)
Less than 5 minutes: 1,0205 to 9 minutes: 2,20110 to 14 minutes: 5,35015 to 19 minutes: 3,83420 to 24 minutes: 3,33525 to 29 minutes: 1,73730 to 34 minutes: 2,99835 to 39 minutes: 66840 to 44 minutes: 48345 to 59 minutes: 1,90960 to 89 minutes: 89790 or more minutes: 516
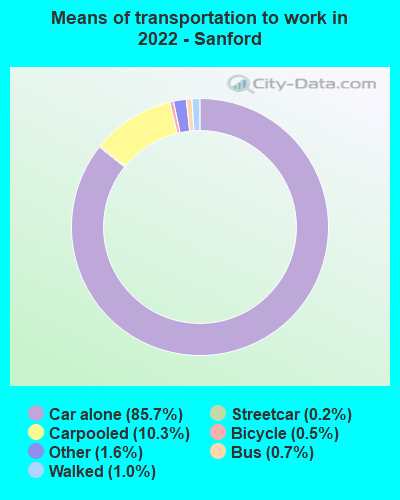
Means of transportation to work:
Drove a car alone: 29,780 (68.9%)Carpooled: 4,513 (10.4%)Bus : 227 (0.5%)Subway or elevated rail : 64 (0.1%)Long-distance train or commuter rail : 13 (0.0%)Taxi: 656 (1.5%)Bicycle: 174 (0.4%)Walked: 313 (0.7%)Worked at home: 6,252 (14.5%)
Unemployment by race in 2022
Unemployment rate for White non-Hispanic residents 2.6% Males5.2% FemalesUnemployment rate for Black residents 7.2% Males2.4% FemalesUnemployment rate for American Indian and Alaska Native residents 21.8% MalesUnemployment rate for Asian residents 1.2% Males1.4% FemalesUnemployment rate for other race residents 1.8% Males1.8% FemalesUnemployment rate for two or more race residents 5.0% Males2.0% FemalesUnemployment rate for Hispanic or Latino residents 2.4% Males1.6% Females
Year of entry for the foreign-born population in Sanford, Florida
5,732 2010 or later 2,447 2000 to 2009 2,126 1990 to 1999 542 1980 to 1989 278 1970 to 1979 430 Before 1970
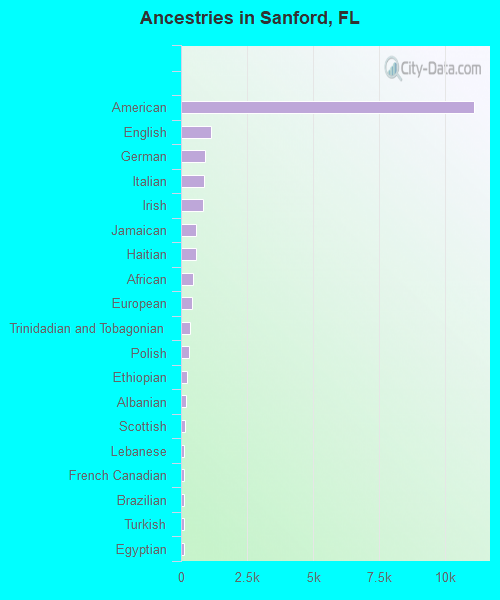
First ancestries reported:
American: 9,510 (23.8%)
English: 1,219 (3.1%)
German: 860 (2.2%)
Irish: 837 (2.1%)
Jamaican: 748 (1.9%)
Italian: 733 (1.8%)
Haitian: 542 (1.4%)
African: 417 (1.0%)
European: 405 (1.0%)
Nigerian: 338 (0.8%)
Polish: 261 (0.7%)
Ethiopian: 223 (0.6%)
Trinidadian and Tobagonian: 222 (0.6%)
Albanian: 211 (0.5%)
Egyptian: 179 (0.4%)
French Canadian: 157 (0.4%)
Lebanese: 155 (0.4%)
Brazilian: 125 (0.3%)
Scottish: 119 (0.3%)
Ukrainian: 110 (0.3%)
Turkish: 96 (0.2%)
West Indian: 89 (0.2%)
Scotch-Irish: 78 (0.2%)
Iranian: 72 (0.2%)
Russian: 66 (0.2%)
Hungarian: 63 (0.2%)
Welsh: 53 (0.1%)
Romanian: 51 (0.1%)
French: 46 (0.1%)
Guyanese: 45 (0.1%)
British: 39 (0.10%)
Greek: 36 (0.09%)
Swedish: 36 (0.09%)
Eastern European: 35 (0.09%)
Portuguese: 24 (0.06%)
Dutch: 24 (0.06%)
U.S. Virgin Islander: 20 (0.05%)
Austrian: 19 (0.05%)
Czech: 17 (0.04%)
Israeli: 16 (0.04%)
Arab: 16 (0.04%)
Danish: 15 (0.04%)
Norwegian: 13 (0.03%)
Bahamian: 13 (0.03%)
Canadian: 11 (0.03%)
British West Indian: 11 (0.03%)
Ghanaian: 10 (0.03%)
Palestinian: 9 (0.02%)
Croatian: 9 (0.02%)
Northern European: 4 (0.01%)
German Russian: 4 (0.01%)
Syrian: 3 (0.01%)
Lithuanian: 2 (0.01%)
Most common places of birth for foreign-born residents (%): Venezuela Sanford:
22.3% (2,515)Florida:
5.7% (262,042)
Colombia Sanford:
10.7% (1,211)Florida:
6.5% (298,669)
Mexico Sanford:
6.5% (731)Florida:
5.6% (257,152)
Jamaica Sanford:
6.5% (730)Florida:
5.0% (227,319)
Dominican Republic Sanford:
5.7% (644)Florida:
3.0% (137,727)
Guatemala Sanford:
4.6% (517)Florida:
2.1% (97,632)
Cuba Sanford:
4.5% (513)Florida:
22.0% (1,006,576)
India Sanford:
3.9% (442)Florida:
2.1% (94,349)
Haiti Sanford:
3.1% (347)Florida:
7.5% (342,375)
Ecuador Sanford:
2.7% (306)Florida:
1.2% (54,585)
China, excluding Hong Kong and Taiwan Sanford:
2.5% (287)Florida:
1.2% (56,071)
Vietnam Sanford:
2.4% (272)Florida:
1.3% (60,604)
Pakistan Sanford:
1.6% (177)Florida:
0.3% (13,569)
Place of birth for U.S.-born residents:
This state: 25,542Other state: 21,029Northeast: 9,548Midwest: 3,556South: 5,793West: 2,256 81.7% of Sanford residents lived in the same house 1 years ago.
Out of people who lived in different houses, 31.9% lived in this county.
Out of people who lived in different counties, 49.2% lived in Florida.
Sanford:
81.7%State average:
86.3%
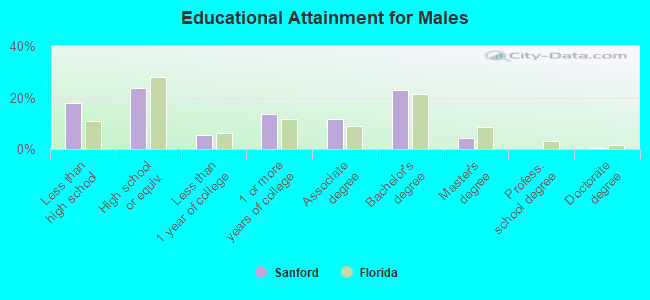
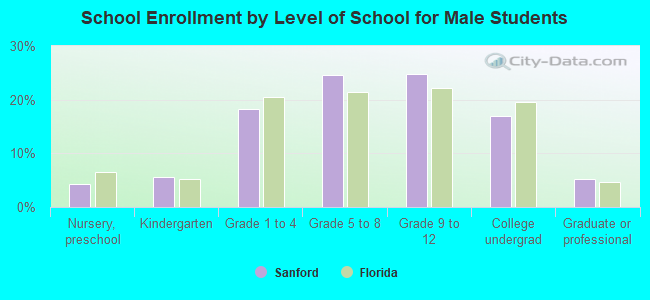
Education attainment for males 25 years and older:
No schooling: 265Nursery to 4th grade: 2405th and 6th grade: 1977th and 8th grade: 3259th grade: 21310th grade: 18411th grade: 27912th grade, no diploma: 569High school graduate (or equivalency): 8,028Less than 1 year of college: 1,119Some college more than 1 year, no degree: 2,527Associate degree: 1,945Bachelor's degree: 3,344Master's degree: 1,271Professional school degree: 335Doctorate degree: 101
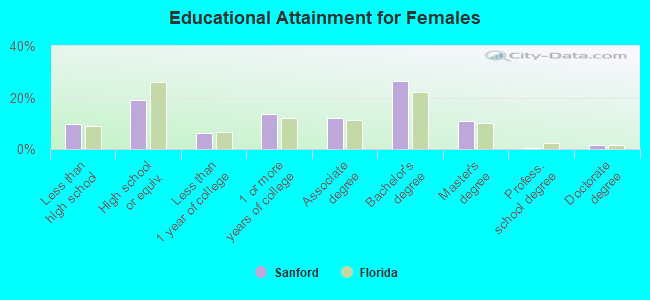
Education attainment for females 25 years and older:
No schooling: 284Nursery to 4th grade: 225th and 6th grade: 767th and 8th grade: 3649th grade: 10410th grade: 35011th grade: 39212th grade, no diploma: 740High school graduate (or equivalency): 6,656Less than 1 year of college: 1,580Some college more than 1 year, no degree: 2,943Associate degree: 3,106Bachelor's degree: 3,482Master's degree: 1,537Professional school degree: 333Doctorate degree: 128
Housing units in structures:
One, detached: 13,918One, attached: 2,272Two: 4133 or 4: 1,4785 to 9: 1,95310 to 19: 2,49520 to 49: 1,19850 or more: 1,557Mobile homes: 743Boats, RVs, vans, etc.: 101Housing units lacking complete plumbing facilities in 2022: 0.9%Housing units lacking complete kitchen facilities in 2022: 1.8%House/condo owner moved in on average 8 years ago
Renter moved in on average 3 years ago
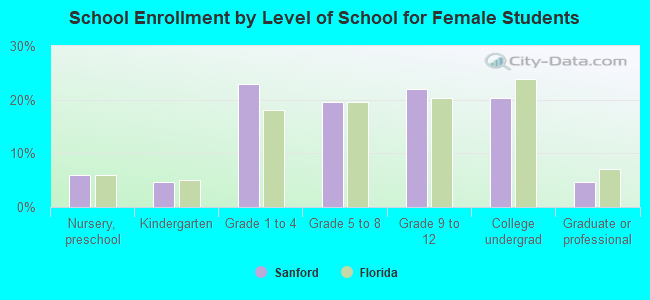
Private vs. public school enrollment:
Students in private schools in grades 1 to 8 (elementary and middle school): 263 Students in private schools in grades 9 to 12 (high school): 246 Students in private undergraduate colleges: 507