Housing density: 3,302 houses/condos per square mile
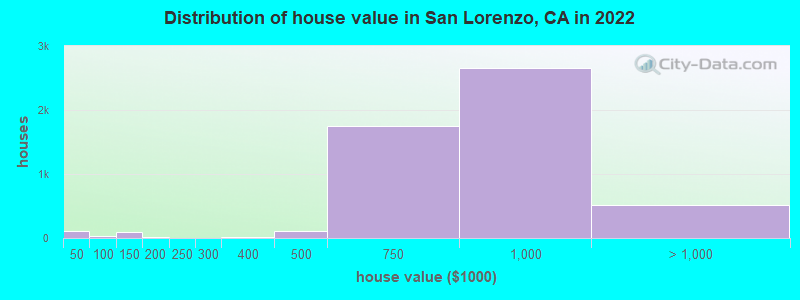
Median price asked for vacant for-sale houses and condos in 2022: $485,643.
Median contract rent in 2022: $1,923 (lower quartile is $1,209, upper quartile is over $2,000)
Median rent asked for vacant for-rent units in 2022: $1,982
Median gross rent in San Lorenzo, CA in 2022: over $2,000
Housing units in San Lorenzo with a mortgage: 4,084 (445 second mortgage, 29 home equity loan, 293 both second mortgage and home equity loan) Houses without a mortgage: 136
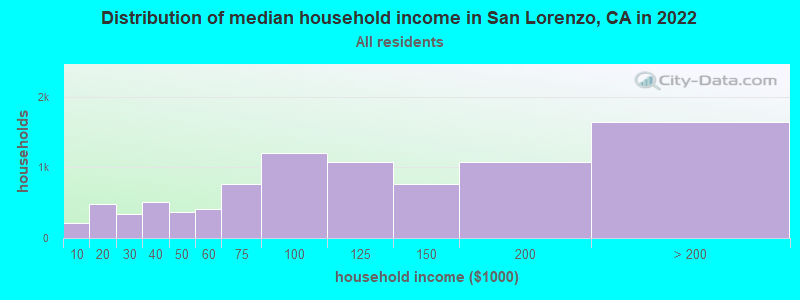
Median household income for houses/condos with a mortgage: $141,937
Median household income for apartments without a mortgage: $86,188
Median monthly housing costs: $2,121
Compare current foreclosures near San Lorenzo, CA:
3,605 married couples with children.
838 single-parent households (151 men, 687 women).
45.5% of residents of San Lorenzo speak English at home.
28.4% of residents speak Spanish at home (56% speak English very well, 20% speak English well, 17% speak English not well, 6% don't speak English at all).
2.7% of residents speak other Indo-European language at home (60% speak English very well, 18% speak English well, 22% speak English not well).
23.4% of residents speak Asian or Pacific Island language at home (45% speak English very well, 25% speak English well, 21% speak English not well, 9% don't speak English at all).
0.1% of residents speak other language at home (84% speak English very well, 8% speak English well, 8% speak English not well).
Foreign born population: 10,759 (36.9%)
(63.8% of them are naturalized citizens)
Percentage of workers working in this county: 76.6% Number of people working at home: 1,475 (10.2% of all workers)
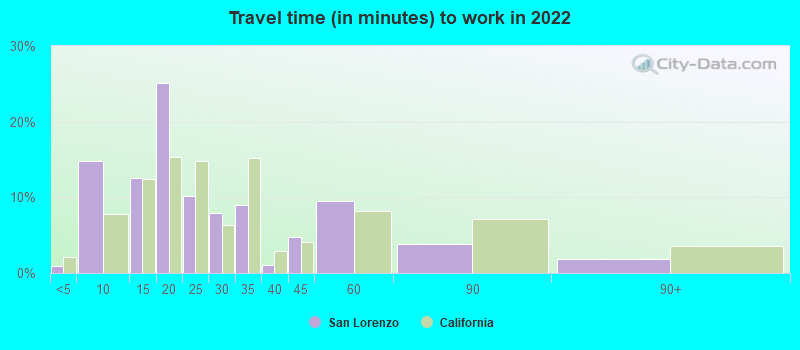
Travel time to work (commute)
Less than 5 minutes: 88
5 to 9 minutes: 627
10 to 14 minutes: 1,164
15 to 19 minutes: 2,123
20 to 24 minutes: 1,583
25 to 29 minutes: 623
30 to 34 minutes: 2,177
35 to 39 minutes: 353
40 to 44 minutes: 676
45 to 59 minutes: 1,669
60 to 89 minutes: 972
90 or more minutes: 218
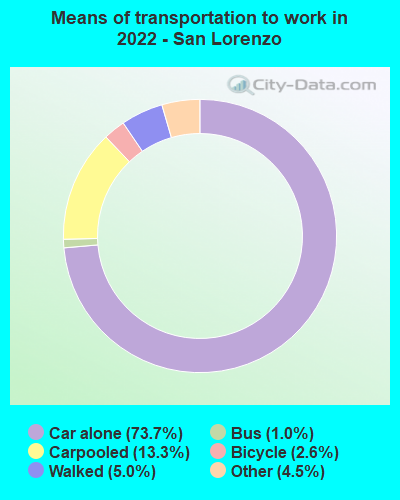
Means of transportation to work:
Drove a car alone: 2,135 (50.0%)
Carpooled: 402 (9.4%)
Bus: 23 (0.5%)
Taxi: 137 (3.2%)
Bicycle: 81 (1.9%)
Walked: 145 (3.4%)
Worked at home: 1,475 (34.6%)
Unemployment by race in 2022
Unemployment rate for White non-Hispanic residents
10.0%Males
2.7%Females
Unemployment rate for Black residents
0.5%Males
7.7%Females
Unemployment rate for American Indian and Alaska Native residents
8.1%Males
Unemployment rate for Asian residents
6.5%Males
1.3%Females
Unemployment rate for other race residents
4.9%Males
3.6%Females
Unemployment rate for two or more race residents
9.2%Males
0.7%Females
Unemployment rate for Hispanic or Latino residents
5.0%Males
2.2%Females
Year of entry for the foreign-born population in San Lorenzo, California
1,7412010 or later
2,3982000 to 2009
2,4091990 to 1999
1,5581980 to 1989
9091970 to 1979
646Before 1970
First ancestries reported:
German: 367 (2.1%)
American: 324 (1.8%)
European: 225 (1.3%)
English: 214 (1.2%)
Irish: 184 (1.0%)
Portuguese: 179 (1.0%)
Norwegian: 179 (1.0%)
Italian: 174 (1.0%)
Swedish: 72 (0.4%)
Polish: 55 (0.3%)
Northern European: 50 (0.3%)
Celtic: 43 (0.2%)
Kenyan: 39 (0.2%)
Russian: 30 (0.2%)
British: 25 (0.1%)
French: 25 (0.1%)
Scottish: 22 (0.1%)
Canadian: 20 (0.1%)
Cape Verdean: 17 (0.10%)
Scandinavian: 16 (0.09%)
Croatian: 14 (0.08%)
Iranian: 14 (0.08%)
Scotch-Irish: 13 (0.07%)
French Canadian: 13 (0.07%)
Greek: 13 (0.07%)
Yugoslavian: 11 (0.06%)
Pennsylvania German: 10 (0.06%)
Lebanese: 10 (0.06%)
Finnish: 9 (0.05%)
Czech: 8 (0.04%)
Ethiopian: 7 (0.04%)
Ukrainian: 7 (0.04%)
Armenian: 6 (0.03%)
Dutch: 6 (0.03%)
Bulgarian: 4 (0.02%)
African: 4 (0.02%)
Czechoslovakian: 4 (0.02%)
Nigerian: 2 (0.01%)
Most common places of birth for foreign-born residents (%):
Mexico
San Lorenzo:
28.5% (3,071)
California:
37.2% (3,881,193)
Philippines
San Lorenzo:
21.4% (2,299)
California:
7.8% (818,297)
China, excluding Hong Kong and Taiwan
San Lorenzo:
14.7% (1,580)
California:
6.6% (684,672)
Vietnam
San Lorenzo:
7.2% (780)
California:
4.9% (512,335)
Hong Kong
San Lorenzo:
4.2% (448)
California:
1.0% (105,215)
El Salvador
San Lorenzo:
3.7% (399)
California:
4.2% (440,287)
Nicaragua
San Lorenzo:
3.2% (346)
California:
0.6% (58,161)
India
San Lorenzo:
2.4% (255)
California:
5.2% (539,184)
Place of birth for U.S.-born residents:
This state: 15,196
Other state: 2,705
Northeast: 406
Midwest: 644
South: 506
West: 1,155
94.2% of San Lorenzo residents lived in the same house 1 years ago. Out of people who lived in different houses, 30.7% lived in this county. Out of people who lived in different counties, 68.1% lived in California.
San Lorenzo:
94.2%
State average:
88.9%
Education attainment for males 25 years and older:
No schooling: 540
Nursery to 4th grade: 90
5th and 6th grade: 289
7th and 8th grade: 113
9th grade: 300
10th grade: 55
11th grade: 126
12th grade, no diploma: 497
High school graduate (or equivalency): 2,756
Less than 1 year of college: 961
Some college more than 1 year, no degree: 1,609
Associate degree: 643
Bachelor's degree: 1,983
Master's degree: 293
Professional school degree: 126
Doctorate degree: 53
Education attainment for females 25 years and older:
No schooling: 561
Nursery to 4th grade: 132
5th and 6th grade: 370
7th and 8th grade: 88
9th grade: 106
10th grade: 49
11th grade: 125
12th grade, no diploma: 385
High school graduate (or equivalency): 2,433
Less than 1 year of college: 795
Some college more than 1 year, no degree: 1,242
Associate degree: 994
Bachelor's degree: 2,575
Master's degree: 472
Professional school degree: 122
Doctorate degree: 106
Housing units in structures:
One, detached: 7,131
One, attached: 567
3 or 4: 169
5 to 9: 302
10 to 19: 184
20 to 49: 97
50 or more: 662
Mobile homes: 37
Boats, RVs, vans, etc.: 6
Housing units lacking complete plumbing facilities in 2022: 0.9%
Housing units lacking complete kitchen facilities in 2022: 0.9%
House/condo owner moved in on average 16 years ago