San Fernando, CA (California) Houses and Residents
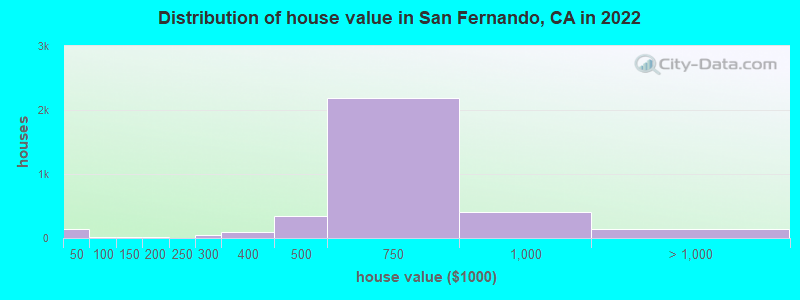
Estimated median house or condo value in 2022: $664,879 (it was $143,900 in 2000 )
San Fernando:
$664,879California:
$715,900
Lower value quartile - upper value quartile: $547,742 - $768,210Total population: 24,587 (Urban population: 23,534, Rural population: 0)
Houses: 6,764 (6,403 occupied: 3,847 owner occupied, 2,580 renter occupied )
% of renters here:
40%State:
44%
Housing density: 2,836 houses/condos per square mile
Median price asked for vacant for-sale houses and condos in 2022: $979,073.
Median contract rent in 2022: $1,463 (lower quartile is $1,153, upper quartile is $1,833)
Median rent asked for vacant for-rent units in 2022: $1,482
Median gross rent in San Fernando, CA in 2022: $1,636
Housing units in San Fernando with a mortgage: 2,518 (216 second mortgage, 0 home equity loan, 184 both second mortgage and home equity loan )Houses without a mortgage: 183
Median household income for houses/condos with a mortgage: $120,770
Median household income for apartments without a mortgage: $76,994
Median monthly housing costs: $1,653
Data:
Median house or condo value ($)
Median house or condo value ($ change since 2000)
Median house or condo value ($) - White
Median house or condo value ($) - Black or African American
Median house or condo value ($) - Asian
Median house or condo value ($) - Hispanic or Latino
Median house or condo value ($) - American Indian and Alaska Native
Median house or condo value ($) - Multirace
Median house or condo value ($) - Other Race
Median price asked for mobile homes ($)
Household density (households per square mile)
Mean house or condo value by units in structure - 1, detached ($)
Mean house or condo value by units in structure - 1, attached ($)
Mean house or condo value by units in structure - 2 ($)
Mean house or condo value by units in structure by units in structure - 3 or 4 ($)
Mean house or condo value by units in structure - 5 or more ($)
Mean house or condo value by units in structure - Boat, RV, van, etc. ($)
Mean house or condo value by units in structure - Mobile home ($)
Median contract rent ($)
Median contract rent - Lower quartile ($)
Median contract rent - Upper quartile ($)
Median gross rent ($)
Urban houses (%)
Rural houses (%)
Houses occupied (%)
Houses occupied (% change since 2000)
Houses owner occupied (%)
Houses owner occupied (% change since 2000)
Houses renter occupied (%)
Houses renter occupied (% change since 2000)
Vacant housing units - For rent (%)
Vacant housing units - For rent (% change since 2000)
Vacant housing units - For sale only (%)
Vacant housing units - For sale only (% change since 2000)
Vacant housing units - Rented or sold, not occupied (%)
Vacant housing units - Rented or sold, not occupied (% change since 2000)
Vacant housing units - For seasonal, recreational, or occasional use (%)
Vacant housing units - For seasonal, recreational, or occasional use (% change since 2000)
Vacant housing units - For migrant workers (%)
Vacant housing units - For migrant workers (% change since 2000)
Vacant housing units - Other vacant (%)
Vacant housing units - Other vacant (% change since 2000)
Median monthly housing costs ($)
Median household income for houses/condos with a mortgage ($)
Median household income for houses/condos without a mortgage ($)
Median household income ($)
Median household income ($) - White
Median household income ($) - Black or African American
Median household income ($) - Asian
Median household income ($) - Hispanic or Latino
Median household income ($) - American Indian and Alaska Native
Median household income ($) - Multirace
Median household income ($) - Other Race
Mortgage status - with mortgage (%)
Mortgage status - with second mortgage (%)
Mortgage status - with home equity loan (%)
Mortgage status - with both second mortgage and home equity loan (%)
Mortgage status - without a mortgage (%)
Median year house/condo built
Median year apartment built
Household type by relationship - Male householder living alone (%)
Household type by relationship - Male householder not living alone (%)
Household type by relationship - Female householder living alone (%)
Household type by relationship - Female householder not living alone (%)
Household type by relationship - Opposite-Sex spouse (%)
Household type by relationship - Same-Sex spouse (%)
Household type by relationship - Opposite-Sex unmarried partner (%)
Household type by relationship - Same-Sex unmarried partner (%)
Household type by relationship - In group quarters (%)
Size of family households - 2-person household (%)
Size of family households - 3-person household (%)
Size of family households - 4-person household (%)
Size of family households - 5-person household (%)
Size of family households - 6-person household (%)
Size of family households - 7-or-more-person household (%)
Size of nonfamily households - 1-person household (%)
Size of nonfamily households - 2-person household (%)
Size of nonfamily households - 3-person household (%)
Size of nonfamily households - 4-person household (%)
Size of nonfamily households - 5-person household (%)
Size of nonfamily households - 6-person household (%)
Size of nonfamily households - 7-or-moreperson household (%)
Year house built - Built 2010 or later (%)
Year house built - Built 2000 to 2009 (%)
Year house built - Built 1990 to 1999 (%)
Year house built - Built 1980 to 1989 (%)
Year house built - Built 1970 to 1979 (%)
Year house built - Built 1960 to 1969 (%)
Year house built - Built 1950 to 1959 (%)
Year house built - Built 1940 to 1949 (%)
Year house built - Built 1939 or earlier (%)
Median number of rooms in houses and condos
Median number of rooms in apartments
Median number of bedrooms in owner occupied houses
Mean number of bedrooms in owner occupied houses
Median number of bedrooms in renter occupied houses
Mean number of bedrooms in renter occupied houses
Median number of vehichles in owner occupied houses
Mean number of vehichles in owner occupied houses
Median number of vehichles in renter occupied houses
Mean number of vehichles in renter occupied houses
Rooms in owner-occupied houses - 1 room (%)
Rooms in owner-occupied houses - 2 rooms (%)
Rooms in owner-occupied houses - 3 rooms (%)
Rooms in owner-occupied houses - 4 rooms (%)
Rooms in owner-occupied houses - 5 rooms (%)
Rooms in owner-occupied houses - 6 rooms (%)
Rooms in owner-occupied houses - 7 rooms (%)
Rooms in owner-occupied houses - 8 rooms (%)
Rooms in owner-occupied houses - 9+ rooms (%)
Rooms in renter-occupied houses - 1 room (%)
Rooms in renter-occupied houses - 2 rooms (%)
Rooms in renter-occupied houses - 3 rooms (%)
Rooms in renter-occupied houses - 4 rooms (%)
Rooms in renter-occupied houses - 5 rooms (%)
Rooms in renter-occupied houses - 6 rooms (%)
Rooms in renter-occupied houses - 7 rooms (%)
Rooms in renter-occupied houses - 8 rooms (%)
Rooms in renter-occupied houses - 9+ rooms (%)
Bedrooms in owner-occupied houses - no bedrooms (%)
Bedrooms in owner-occupied houses - 1 bedroom (%)
Bedrooms in owner-occupied houses - 2 bedrooms (%)
Bedrooms in owner-occupied houses - 3 bedrooms (%)
Bedrooms in owner-occupied houses - 4 bedrooms (%)
Bedrooms in owner-occupied houses - 5+ bedrooms (%)
Bedrooms in renter-occupied houses - no bedrooms (%)
Bedrooms in renter-occupied houses - 1 bedroom (%)
Bedrooms in renter-occupied houses - 2 bedrooms (%)
Bedrooms in renter-occupied houses - 3 bedrooms (%)
Bedrooms in renter-occupied houses - 4 bedrooms (%)
Bedrooms in renter-occupied houses - 5+ bedrooms (%)
Vehicles available in owner-occupied houses - no vehicle available (%)
Vehicles available in owner-occupied houses - 1 vehicle available(%)
Vehicles available in owner-occupied houses - 2 Vehicles available (%)
Vehicles available in owner-occupied houses - 3 Vehicles available (%)
Vehicles available in owner-occupied houses - 4 Vehicles available (%)
Vehicles available in owner-occupied houses - 5+ Vehicles available (%)
Vehicles available in renter-occupied houses - no vehicle available (%)
Vehicles available in renter-occupied houses - 1 vehicle available (%)
Vehicles available in renter-occupied houses - 2 Vehicles available (%)
Vehicles available in renter-occupied houses - 3 Vehicles available (%)
Vehicles available in renter-occupied houses - 4 Vehicles available (%)
Vehicles available in renter-occupied houses - 5+ Vehicles available (%)
Housing units in structures - 1, detached (%)
Housing units in structures - 1, attached (%)
Housing units in structures - 2 (%)
Housing units in structures - 3 or 4 (%)
Housing units in structures - 5 to 9 (%)
Housing units in structures - 10 to 19 (%)
Housing units in structures - 20 to 49 (%)
Housing units in structures - 50 or more (%)
Housing units in structures - Mobile home (%)
Housing units in structures - Boat, RV, van, etc. (%)
Housing units in structures - Owners - 1, detached (%)
Housing units in structures - Owners - 1, attached (%)
Housing units in structures - Owners - 2 (%)
Housing units in structures - Owners - 3 or 4 (%)
Housing units in structures - Owners - 5 to 9 (%)
Housing units in structures - Owners - 10 to 19 (%)
Housing units in structures - Owners - 20 to 49 (%)
Housing units in structures - Owners - 50 or more (%)
Housing units in structures - Owners - Mobile home (%)
Housing units in structures - Owners - Boat, RV, van, etc. (%)
Housing units in structures - Renters - 1, detached (%)
Housing units in structures - Renters - 1, attached (%)
Housing units in structures - Renters - 2 (%)
Housing units in structures - Renters - 3 or 4 (%)
Housing units in structures - Renters - 5 to 9 (%)
Housing units in structures - Renters - 10 to 19 (%)
Housing units in structures - Renters - 20 to 49 (%)
Housing units in structures - Renters - 50 or more (%)
Housing units in structures - Renters - Mobile home (%)
Housing units in structures - Renters - Boat, RV, van, etc. (%)
House/condo owner moved in on average (years ago)
Renter moved in on average (years ago)
Year householder moved into unit - Moved in 1999 to March 2000 (%)
Year householder moved into unit - Moved in 1999 to March 2000 (%) - White
Year householder moved into unit - Moved in 1999 to March 2000 (%) - Black or African American
Year householder moved into unit - Moved in 1999 to March 2000 (%) - Asian
Year householder moved into unit - Moved in 1999 to March 2000 (%) - Hispanic or Latino
Year householder moved into unit - Moved in 1999 to March 2000 (%) - American Indian and Alaska Native
Year householder moved into unit - Moved in 1999 to March 2000 (%) - Multirace
Year householder moved into unit - Moved in 1999 to March 2000 (%) - Other Race
Year householder moved into unit - Moved in 1995 to 1998 (%)
Year householder moved into unit - Moved in 1995 to 1998 (%) - White
Year householder moved into unit - Moved in 1995 to 1998 (%) - Black or African American
Year householder moved into unit - Moved in 1995 to 1998 (%) - Asian
Year householder moved into unit - Moved in 1995 to 1998 (%) - Hispanic or Latino
Year householder moved into unit - Moved in 1995 to 1998 (%) - American Indian and Alaska Native
Year householder moved into unit - Moved in 1995 to 1998 (%) - Multirace
Year householder moved into unit - Moved in 1995 to 1998 (%) - Other Race
Year householder moved into unit - Moved in 1990 to 1994 (%)
Year householder moved into unit - Moved in 1990 to 1994 (%) - White
Year householder moved into unit - Moved in 1990 to 1994 (%) - Black or African American
Year householder moved into unit - Moved in 1990 to 1994 (%) - Asian
Year householder moved into unit - Moved in 1990 to 1994 (%) - Hispanic or Latino
Year householder moved into unit - Moved in 1990 to 1994 (%) - American Indian and Alaska Native
Year householder moved into unit - Moved in 1990 to 1994 (%) - Multirace
Year householder moved into unit - Moved in 1990 to 1994 (%) - Other Race
Year householder moved into unit - Moved in 1980 to 1989 (%)
Year householder moved into unit - Moved in 1980 to 1989 (%) - White
Year householder moved into unit - Moved in 1980 to 1989 (%) - Black or African American
Year householder moved into unit - Moved in 1980 to 1989 (%) - Asian
Year householder moved into unit - Moved in 1980 to 1989 (%) - Hispanic or Latino
Year householder moved into unit - Moved in 1980 to 1989 (%) - American Indian and Alaska Native
Year householder moved into unit - Moved in 1980 to 1989 (%) - Multirace
Year householder moved into unit - Moved in 1980 to 1989 (%) - Other Race
Year householder moved into unit - Moved in 1970 to 1979 (%)
Year householder moved into unit - Moved in 1970 to 1979 (%) - White
Year householder moved into unit - Moved in 1970 to 1979 (%) - Black or African American
Year householder moved into unit - Moved in 1970 to 1979 (%) - Asian
Year householder moved into unit - Moved in 1970 to 1979 (%) - Hispanic or Latino
Year householder moved into unit - Moved in 1970 to 1979 (%) - American Indian and Alaska Native
Year householder moved into unit - Moved in 1970 to 1979 (%) - Multirace
Year householder moved into unit - Moved in 1970 to 1979 (%) - Other Race
Year householder moved into unit - Moved in 1969 or earlier (%)
Year householder moved into unit - Moved in 1969 or earlier (%) - White
Year householder moved into unit - Moved in 1969 or earlier (%) - Black or African American
Year householder moved into unit - Moved in 1969 or earlier (%) - Asian
Year householder moved into unit - Moved in 1969 or earlier (%) - Hispanic or Latino
Year householder moved into unit - Moved in 1969 or earlier (%) - American Indian and Alaska Native
Year householder moved into unit - Moved in 1969 or earlier (%) - Multirace
Year householder moved into unit - Moved in 1969 or earlier (%) - Other Race
Housing units lacking complete plumbing facilities (%)
Housing units lacking complete kitchen facilities (%)
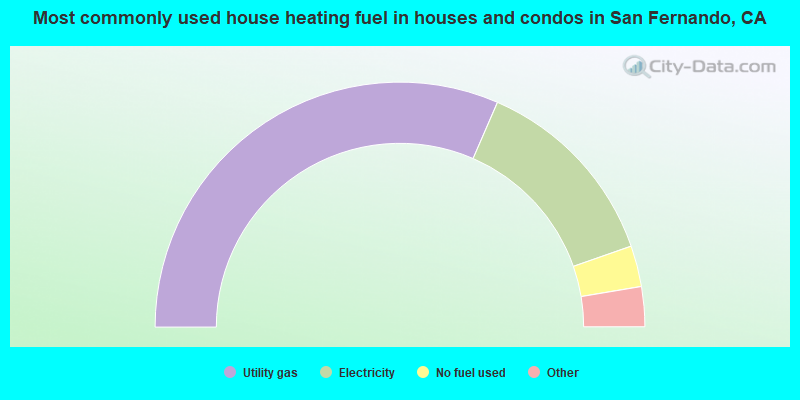
House heating fuel used in houses and condos - Utility gas (%)
House heating fuel used in houses and condos - Bottled, tank, or LP gas (%)
House heating fuel used in houses and condos - Electricity (%)
House heating fuel used in houses and condos - Fuel oil, kerosene, etc. (%)
House heating fuel used in houses and condos - Coal or coke (%)
House heating fuel used in houses and condos - Wood (%)
House heating fuel used in houses and condos - Solar energy (%)
House heating fuel used in houses and condos - Other fuel (%)
House heating fuel used in houses and condos - No fuel used (%)
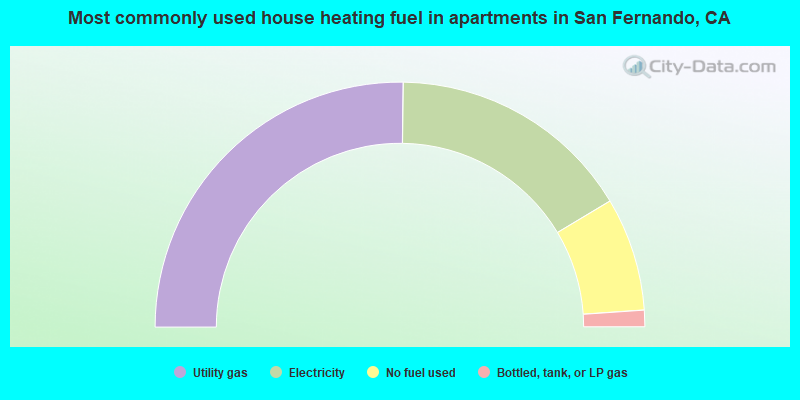
House heating fuel used in apartments - Utility gas (%)
House heating fuel used in apartments - Bottled, tank, or LP gas (%)
House heating fuel used in apartments - Electricity (%)
House heating fuel used in apartments - Fuel oil, kerosene, etc. (%)
House heating fuel used in apartments - Coal or coke (%)
House heating fuel used in apartments - Wood (%)
House heating fuel used in apartments - Solar energy (%)
House heating fuel used in apartments - Other fuel (%)
House heating fuel used in apartments - No fuel used (%)
Median year house/condo built: 1955Median year apartment built: 1964Household type by relationship:
Households: 23,438
Male householders: 3,164 (416 living alone ), Female householders: 3,026 (460 living alone )3,439 spouses (3,418 opposite-sex spouses ), 407 unmarried partners , (407 opposite-sex unmarried partners ), 8,268 children (7,972 natural , 117 adopted , 179 stepchildren ), 1,290 grandchildren , 969 brothers or sisters , 619 parents , 23 foster children , 1,485 other relatives , 619 non-relatives In group quarters: 123
Size of family households: 1,458 2-persons , 1,160 3-persons , 961 4-persons , 912 5-persons , 377 6-persons , 404 7-or-more-persons .
Size of nonfamily households: 941 1-person , 95 2-persons , 38 3-persons .
2,430 married couples with children. single-parent households (512 men , 719 women ).
26.6% of residents of San Fernando speak English at home. of residents speak Spanish at home (59% speak English very well , 19% speak English well , 16% speak English not well , 6% don't speak English at all ).of residents speak other Indo-European language at home (70% speak English very well , 13% speak English well , 17% speak English not well ).of residents speak Asian or Pacific Island language at home (61% speak English very well , 31% speak English well , 7% don't speak English at all ).of residents speak other language at home (62% speak English very well , 38% speak English not well ).
Foreign born population: 8,564 (36.5%)of them are naturalized citizens )
Median number of rooms in houses and condos:
Median number of rooms in apartments
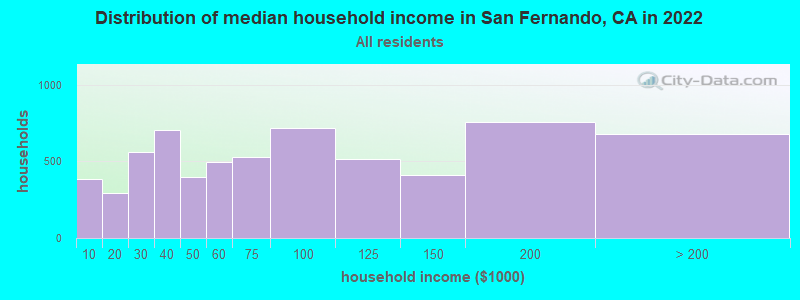
San Fernando, CA household income distribution 382 Less than $10,000291 $10,000 to $19,999558 $20,000 to $29,999704 $30,000 to $39,999399 $40,000 to $49,999494 $50,000 to $59,999528 $60,000 to $74,999718 $75,000 to $99,999512 $100,000 to $124,999410 $125,000 to $149,999756 $150,000 to $199,999677 $200,000 or more
Home value of owner - occupied houses in 2022 in San Fernando, CA 118 Less than $10,0007 $10,000 to $14,99918 $30,000 to $34,9996 $50,000 to $59,99915 $60,000 to $69,99913 $100,000 to $124,99911 $175,000 to $199,99946 $250,000 to $299,99991 $300,000 to $399,999347 $400,000 to $499,9992,193 $500,000 to $749,999400 $750,000 to $999,99981 $1,000,000 to $1,499,99948 $1,500,000 to $1,999,99913 $2,000,000 or moreRent paid by renters in 2022 in San Fernando, CA 18 $450 to $49932 $600 to $64935 $650 to $69926 $750 to $79982 $800 to $899102 $900 to $999496 $1,000 to $1,249481 $1,250 to $1,499833 $1,500 to $1,999236 $2,000 to $2,49969 $2,500 to $2,99929 $3,000 to $3,499152 No cash rent
Percentage of workers working in this county: 94.4%Number of people working at home: 556 (4.9% of all workers )
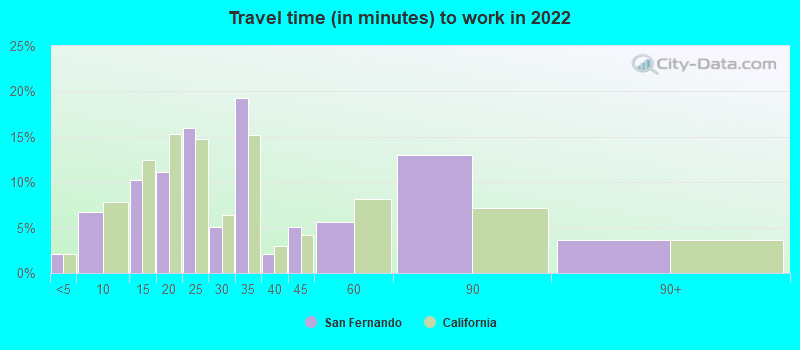
Travel time to work (commute)
Less than 5 minutes: 1405 to 9 minutes: 1,07410 to 14 minutes: 1,25215 to 19 minutes: 1,09520 to 24 minutes: 1,55325 to 29 minutes: 63230 to 34 minutes: 1,84435 to 39 minutes: 20440 to 44 minutes: 59445 to 59 minutes: 1,05460 to 89 minutes: 88790 or more minutes: 211
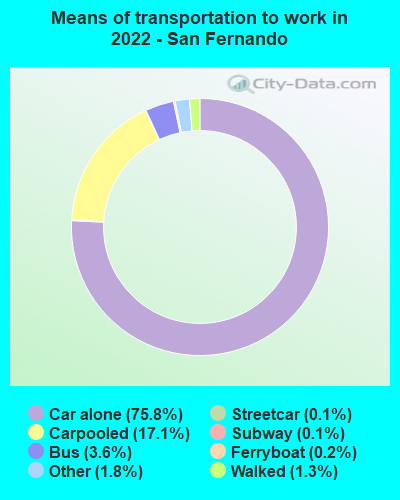
Means of transportation to work:
Drove a car alone: 12,727 (70.1%)Carpooled: 3,169 (17.5%)Bus : 554 (3.1%)Subway or elevated rail : 13 (0.1%)Long-distance train or commuter rail : 11 (0.1%)Ferryboat: 24 (0.1%)Taxi: 335 (1.8%)Walked: 240 (1.3%)Worked at home: 556 (3.1%)
Unemployment by race in 2022
Unemployment rate for White non-Hispanic residents 5.3% Males3.3% FemalesUnemployment rate for Black residents 76.5% MalesUnemployment rate for American Indian and Alaska Native residents 27.6% FemalesUnemployment rate for other race residents 7.2% Males7.9% FemalesUnemployment rate for two or more race residents 2.2% Males12.5% FemalesUnemployment rate for Hispanic or Latino residents 4.6% Males7.5% Females
Year of entry for the foreign-born population in San Fernando, California
769 2010 or later 1,463 2000 to 2009 1,589 1990 to 1999 3,237 1980 to 1989 2,788 1970 to 1979 1,140 Before 1970
First ancestries reported:
American: 93 (0.6%)
Irish: 61 (0.4%)
German: 41 (0.3%)
Polish: 37 (0.2%)
European: 31 (0.2%)
French: 26 (0.2%)
Armenian: 23 (0.2%)
Assyrian: 21 (0.1%)
English: 19 (0.1%)
Italian: 16 (0.1%)
Norwegian: 16 (0.1%)
Romanian: 16 (0.1%)
Scottish: 14 (0.09%)
Iranian: 11 (0.07%)
Danish: 7 (0.05%) Most common places of birth for foreign-born residents (%): Mexico San Fernando:
73.0% (6,254)California:
37.2% (3,881,193)
Guatemala San Fernando:
13.1% (1,124)California:
2.8% (290,436)
El Salvador San Fernando:
4.5% (383)California:
4.2% (440,287)
Philippines San Fernando:
3.3% (279)California:
7.8% (818,297)
Place of birth for U.S.-born residents:
This state: 13,520Other state: 968Northeast: 217Midwest: 163South: 274West: 300 92.7% of San Fernando residents lived in the same house 1 years ago.
Out of people who lived in different houses, 44.8% lived in this county.
Out of people who lived in different counties, 78.7% lived in California.
San Fernando:
92.7%State average:
88.9%
Education attainment for males 25 years and older:
No schooling: 695Nursery to 4th grade: 2455th and 6th grade: 6777th and 8th grade: 1409th grade: 54910th grade: 14111th grade: 15312th grade, no diploma: 591High school graduate (or equivalency): 2,368Less than 1 year of college: 463Some college more than 1 year, no degree: 882Associate degree: 261Bachelor's degree: 558Master's degree: 310Professional school degree: 74Doctorate degree: 18
Education attainment for females 25 years and older:
No schooling: 520Nursery to 4th grade: 2805th and 6th grade: 5977th and 8th grade: 1239th grade: 28510th grade: 30511th grade: 16812th grade, no diploma: 503High school graduate (or equivalency): 1,850Less than 1 year of college: 593Some college more than 1 year, no degree: 828Associate degree: 385Bachelor's degree: 1,097Master's degree: 252Professional school degree: 16Doctorate degree: 40
Housing units in structures:
One, detached: 4,774One, attached: 494Two: 2113 or 4: 2835 to 9: 41810 to 19: 21020 to 49: 19150 or more: 125Mobile homes: 54Housing units lacking complete plumbing facilities in 2022: 0.8%Housing units lacking complete kitchen facilities in 2022: 2.1%House/condo owner moved in on average 19 years ago
Renter moved in on average 6 years ago
Private vs. public school enrollment:
Students in private schools in grades 1 to 8 (elementary and middle school): 274 Here:
11.3%California:
10.5%
Students in private schools in grades 9 to 12 (high school): 105 Students in private undergraduate colleges: 147 Here:
9.6%California:
15.9%