Housing density: 2,166 houses/condos per square mile
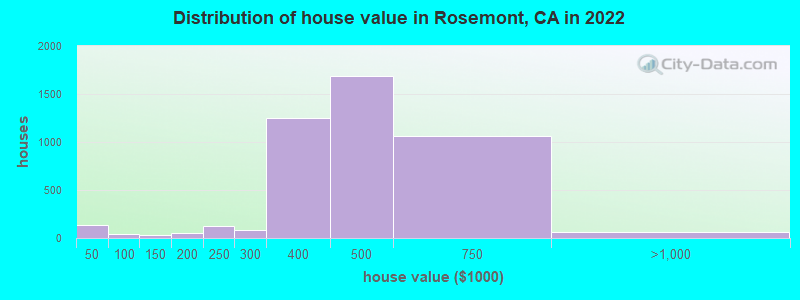
Median price asked for vacant for-sale houses and condos in 2022: $90,962.
Median contract rent in 2022: $1,517 (lower quartile is $1,180, upper quartile is $1,860)
Median rent asked for vacant for-rent units in 2022: $2,423
Median gross rent in Rosemont, CA in 2022: $1,730
Housing units in Rosemont with a mortgage: 3,960 (145 second mortgage, 0 home equity loan, 65 both second mortgage and home equity loan) Houses without a mortgage: 55
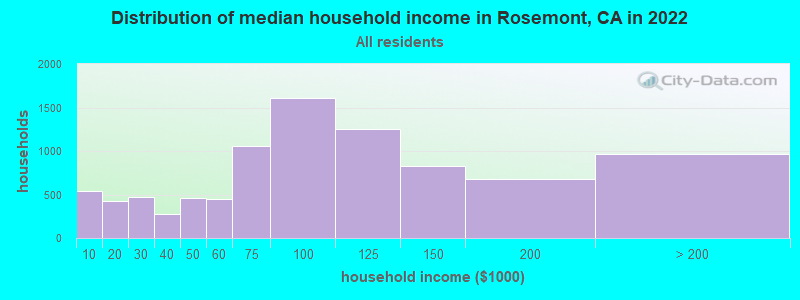
Median household income for houses/condos with a mortgage: $104,575
Median household income for apartments without a mortgage: $86,441
3,462 married couples with children.
1,320 single-parent households (361 men, 959 women).
70.5% of residents of Rosemont speak English at home.
11.6% of residents speak Spanish at home (73% speak English very well, 16% speak English well, 11% speak English not well, 1% don't speak English at all).
5.6% of residents speak other Indo-European language at home (54% speak English very well, 35% speak English well, 8% speak English not well, 2% don't speak English at all).
10.0% of residents speak Asian or Pacific Island language at home (53% speak English very well, 24% speak English well, 17% speak English not well, 6% don't speak English at all).
2.1% of residents speak other language at home (65% speak English very well, 26% speak English well, 6% speak English not well, 4% don't speak English at all).
Foreign born population: 4,284 (17.9%)
(66.3% of them are naturalized citizens)
Percentage of workers working in this county: 86.8% Number of people working at home: 1,761 (15.1% of all workers)
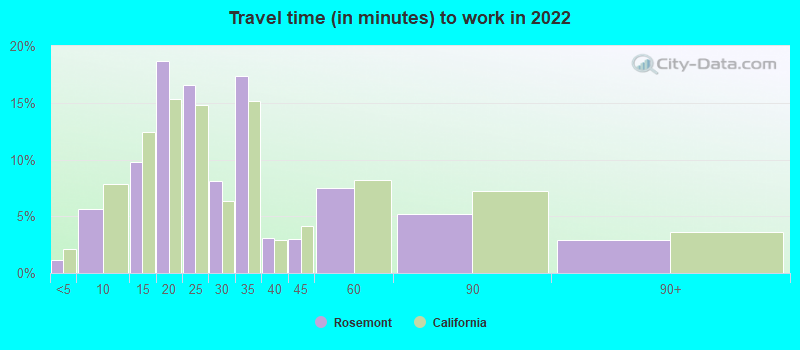
Travel time to work (commute)
Less than 5 minutes: 85
5 to 9 minutes: 635
10 to 14 minutes: 1,138
15 to 19 minutes: 1,790
20 to 24 minutes: 2,005
25 to 29 minutes: 592
30 to 34 minutes: 1,691
35 to 39 minutes: 278
40 to 44 minutes: 370
45 to 59 minutes: 615
60 to 89 minutes: 225
90 or more minutes: 304
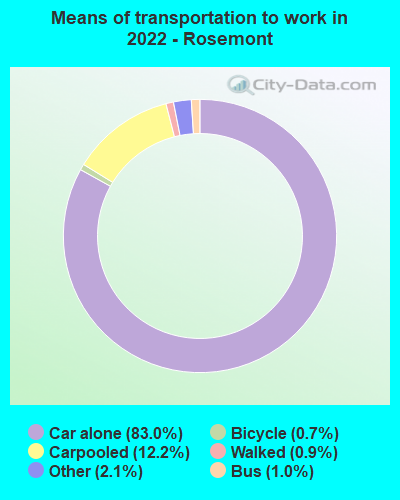
Means of transportation to work:
Drove a car alone: 5,744 (66.4%)
Carpooled: 869 (10.0%)
Bus: 37 (0.4%)
Subway or elevated rail: 3 (0.0%)
Light rail, streetcar or trolley: 2 (0.0%)
Taxi: 180 (2.1%)
Bicycle: 34 (0.4%)
Walked: 67 (0.8%)
Worked at home: 1,761 (20.4%)
Unemployment by race in 2022
Unemployment rate for White non-Hispanic residents
3.0%Males
6.4%Females
Unemployment rate for Black residents
3.9%Males
10.4%Females
Unemployment rate for Asian residents
1.4%Males
1.5%Females
Unemployment rate for other race residents
7.7%Males
7.7%Females
Unemployment rate for two or more race residents
14.0%Males
12.5%Females
Unemployment rate for Hispanic or Latino residents
6.9%Males
9.4%Females
Year of entry for the foreign-born population in Rosemont, California
1,0972010 or later
8642000 to 2009
1,2331990 to 1999
1,0711980 to 1989
5351970 to 1979
493Before 1970
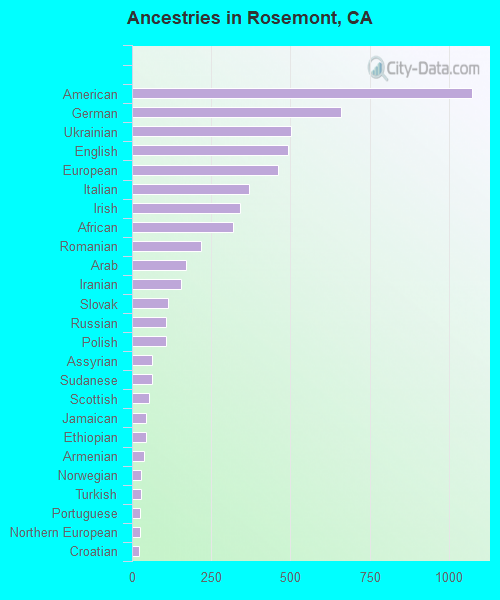
First ancestries reported:
American: 1,073 (8.7%)
German: 659 (5.3%)
Ukrainian: 502 (4.1%)
English: 492 (4.0%)
European: 462 (3.7%)
Italian: 368 (3.0%)
Irish: 342 (2.8%)
African: 319 (2.6%)
Romanian: 219 (1.8%)
Arab: 170 (1.4%)
Iranian: 155 (1.3%)
Slovak: 115 (0.9%)
Russian: 108 (0.9%)
Polish: 108 (0.9%)
Assyrian: 64 (0.5%)
Sudanese: 62 (0.5%)
Scottish: 55 (0.4%)
Jamaican: 45 (0.4%)
Ethiopian: 43 (0.3%)
Armenian: 38 (0.3%)
Norwegian: 29 (0.2%)
Turkish: 28 (0.2%)
Portuguese: 25 (0.2%)
Northern European: 24 (0.2%)
Croatian: 23 (0.2%)
Syrian: 21 (0.2%)
Eastern European: 20 (0.2%)
Yugoslavian: 16 (0.1%)
Slavic: 12 (0.10%)
Scotch-Irish: 11 (0.09%)
Swiss: 11 (0.09%)
Maltese: 11 (0.09%)
Haitian: 11 (0.09%)
Palestinian: 10 (0.08%)
Dutch: 9 (0.07%)
Egyptian: 9 (0.07%)
Greek: 9 (0.07%)
Moroccan: 8 (0.06%)
British: 5 (0.04%)
Scandinavian: 4 (0.03%)
Swedish: 2 (0.02%)
Most common places of birth for foreign-born residents (%):
Mexico
Rosemont:
10.1% (421)
California:
37.2% (3,881,193)
Guatemala
Rosemont:
9.1% (378)
California:
2.8% (290,436)
Korea
Rosemont:
8.6% (357)
California:
3.0% (315,248)
Vietnam
Rosemont:
8.2% (342)
California:
4.9% (512,335)
Ukraine
Rosemont:
6.6% (276)
California:
0.6% (60,761)
Philippines
Rosemont:
5.9% (247)
California:
7.8% (818,297)
China, excluding Hong Kong and Taiwan
Rosemont:
5.7% (237)
California:
6.6% (684,672)
Moldova
Rosemont:
5.5% (229)
California:
0.1% (10,171)
Laos
Rosemont:
4.3% (179)
California:
0.5% (48,911)
Iran
Rosemont:
4.0% (166)
California:
2.0% (206,004)
Kenya
Rosemont:
3.5% (145)
California:
0.1% (12,503)
Venezuela
Rosemont:
3.5% (145)
California:
0.2% (16,998)
Iraq
Rosemont:
2.9% (119)
California:
0.4% (40,941)
Japan
Rosemont:
2.6% (107)
California:
1.0% (103,575)
Democratic Republic of Congo (Zaire)
Rosemont:
2.1% (88)
California:
0.0% (1,613)
United Kingdom, excluding England and Scotland
Rosemont:
1.6% (67)
California:
0.6% (60,582)
Germany
Rosemont:
1.6% (66)
California:
0.7% (73,304)
Place of birth for U.S.-born residents:
This state: 15,567
Other state: 3,607
Northeast: 526
Midwest: 798
South: 1,464
West: 849
86.4% of Rosemont residents lived in the same house 1 years ago. Out of people who lived in different houses, 45.5% lived in this county. Out of people who lived in different counties, 87.8% lived in California.
Rosemont:
86.4%
State average:
88.9%
Education attainment for males 25 years and older:
No schooling: 251
Nursery to 4th grade: 0
5th and 6th grade: 8
7th and 8th grade: 2
9th grade: 33
10th grade: 21
11th grade: 26
12th grade, no diploma: 182
High school graduate (or equivalency): 1,839
Less than 1 year of college: 483
Some college more than 1 year, no degree: 1,176
Associate degree: 1,214
Bachelor's degree: 1,770
Master's degree: 523
Professional school degree: 117
Doctorate degree: 31
Education attainment for females 25 years and older:
No schooling: 176
Nursery to 4th grade: 52
5th and 6th grade: 90
7th and 8th grade: 26
9th grade: 0
10th grade: 28
11th grade: 37
12th grade, no diploma: 94
High school graduate (or equivalency): 1,914
Less than 1 year of college: 543
Some college more than 1 year, no degree: 2,033
Associate degree: 1,348
Bachelor's degree: 1,746
Master's degree: 608
Professional school degree: 140
Doctorate degree: 52
Housing units in structures:
One, detached: 6,404
One, attached: 675
Two: 103
3 or 4: 796
5 to 9: 273
10 to 19: 369
20 to 49: 129
50 or more: 526
Mobile homes: 19
Housing units lacking complete plumbing facilities in 2022: 0.2%
Housing units lacking complete kitchen facilities in 2022: 0.2%
House/condo owner moved in on average 12 years ago