Housing density: 432 houses/condos per square mile
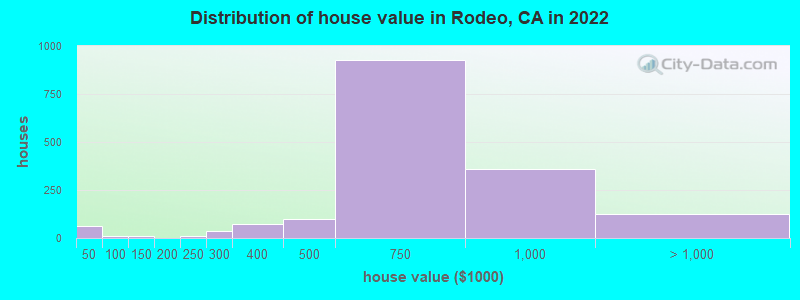
Median price asked for vacant for-sale houses and condos in 2022: $938,675.
Median contract rent in 2022: $1,614 (lower quartile is $1,046, upper quartile is over $2,000)
Median rent asked for vacant for-rent units in 2022: $2,027
Median gross rent in Rodeo, CA in 2022: $1,792
Housing units in Rodeo with a mortgage: 1,130 (104 second mortgage, 0 home equity loan, 111 both second mortgage and home equity loan) Houses without a mortgage: 1
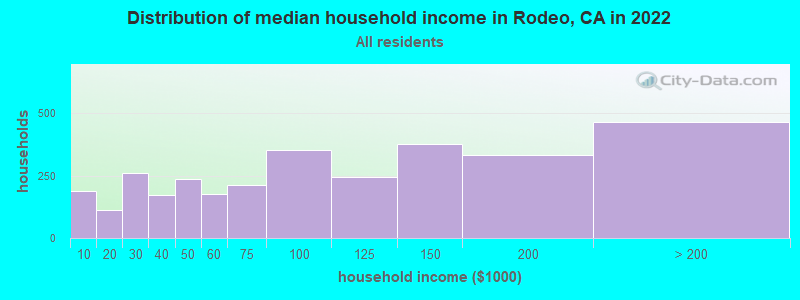
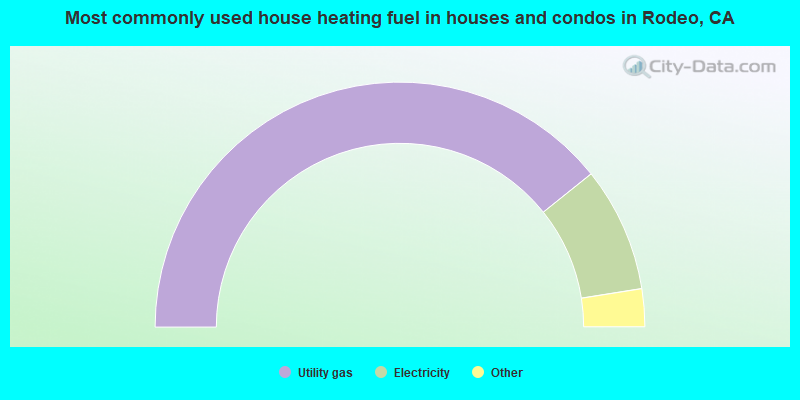
Median household income for houses/condos with a mortgage: $143,962
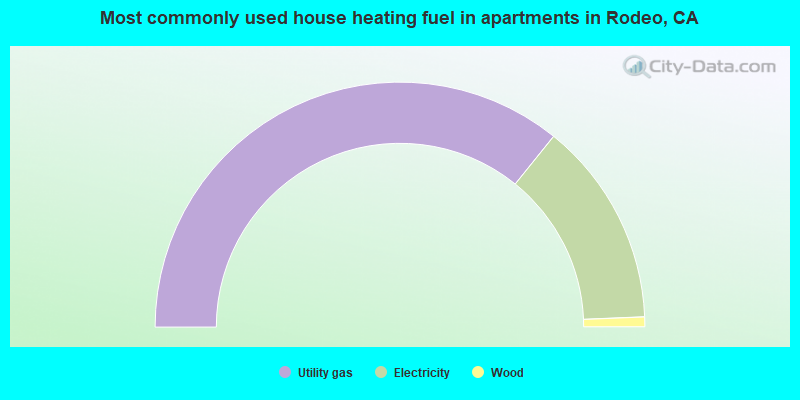
Median household income for apartments without a mortgage: $92,594
Size of family households: 1,018 2-persons, 536 3-persons, 354 4-persons, 223 5-persons, 225 6-persons, 56 7-or-more-persons.
Size of nonfamily households: 521 1-person, 191 2-persons.
992 married couples with children.
577 single-parent households (89 men, 488 women).
64.6% of residents of Rodeo speak English at home.
14.3% of residents speak Spanish at home (73% speak English very well, 11% speak English well, 9% speak English not well, 7% don't speak English at all).
5.6% of residents speak other Indo-European language at home (32% speak English very well, 49% speak English well, 7% speak English not well, 12% don't speak English at all).
12.5% of residents speak Asian or Pacific Island language at home (58% speak English very well, 25% speak English well, 15% speak English not well, 2% don't speak English at all).
2.6% of residents speak other language at home (73% speak English very well, 22% speak English well, 6% speak English not well).
Foreign born population: 2,282 (24.6%)
(75.4% of them are naturalized citizens)
Percentage of workers working in this county: 56.5% Number of people working at home: 397 (8.8% of all workers)
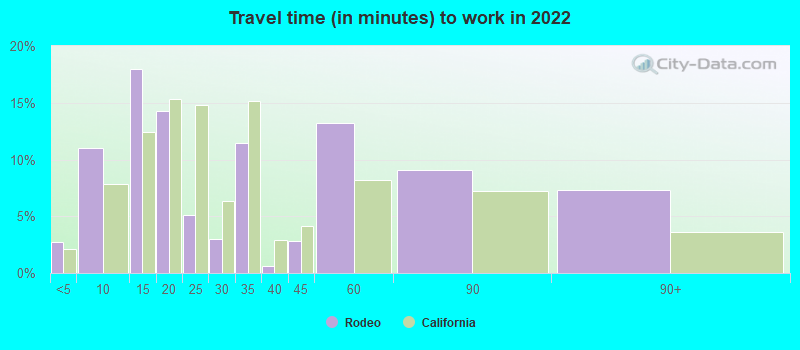
Travel time to work (commute)
Less than 5 minutes: 42
5 to 9 minutes: 421
10 to 14 minutes: 263
15 to 19 minutes: 443
20 to 24 minutes: 473
25 to 29 minutes: 166
30 to 34 minutes: 629
35 to 39 minutes: 135
40 to 44 minutes: 156
45 to 59 minutes: 584
60 to 89 minutes: 359
90 or more minutes: 272
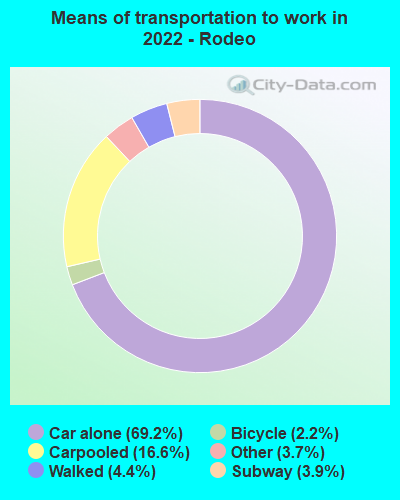
Means of transportation to work:
Drove a car alone: 1,116 (54.1%)
Carpooled: 299 (14.5%)
Long-distance train or commuter rail: 49 (2.4%)
Taxi: 64 (3.1%)
Bicycle: 25 (1.2%)
Walked: 99 (4.8%)
Worked at home: 397 (19.2%)
Unemployment by race in 2022
Unemployment rate for White non-Hispanic residents
1.0%Males
Unemployment rate for Black residents
4.1%Males
8.4%Females
Unemployment rate for Asian residents
5.7%Males
15.5%Females
Unemployment rate for other race residents
9.5%Males
13.8%Females
Unemployment rate for two or more race residents
4.0%Males
Unemployment rate for Hispanic or Latino residents
8.1%Males
10.6%Females
Year of entry for the foreign-born population in Rodeo, California
3162010 or later
6492000 to 2009
4461990 to 1999
5751980 to 1989
2901970 to 1979
281Before 1970
First ancestries reported:
Ethiopian: 154 (2.9%)
German: 145 (2.7%)
European: 140 (2.6%)
Irish: 129 (2.4%)
English: 96 (1.8%)
Portuguese: 65 (1.2%)
American: 60 (1.1%)
Greek: 40 (0.7%)
Guyanese: 36 (0.7%)
British: 33 (0.6%)
Iranian: 31 (0.6%)
Italian: 27 (0.5%)
Polish: 14 (0.3%)
Czech: 13 (0.2%)
Swiss: 8 (0.1%)
Danish: 6 (0.1%)
Dutch: 4 (0.07%)
Lithuanian: 3 (0.06%)
Most common places of birth for foreign-born residents (%):
Philippines
Rodeo:
31.8% (686)
California:
7.8% (818,297)
Mexico
Rodeo:
11.8% (255)
California:
37.2% (3,881,193)
India
Rodeo:
11.4% (246)
California:
5.2% (539,184)
El Salvador
Rodeo:
9.3% (201)
California:
4.2% (440,287)
Pakistan
Rodeo:
5.0% (107)
California:
0.5% (49,399)
Guatemala
Rodeo:
4.9% (106)
California:
2.8% (290,436)
Hong Kong
Rodeo:
2.9% (63)
California:
1.0% (105,215)
Nigeria
Rodeo:
2.5% (53)
California:
0.3% (35,557)
China, excluding Hong Kong and Taiwan
Rodeo:
2.1% (45)
California:
6.6% (684,672)
Japan
Rodeo:
1.9% (41)
California:
1.0% (103,575)
Peru
Rodeo:
1.7% (36)
California:
0.7% (74,025)
Laos
Rodeo:
1.6% (34)
California:
0.5% (48,911)
Ethiopia
Rodeo:
1.6% (34)
California:
0.2% (24,635)
Place of birth for U.S.-born residents:
This state: 5,897
Other state: 1,024
Northeast: 135
Midwest: 250
South: 451
West: 180
92.0% of Rodeo residents lived in the same house 1 years ago. Out of people who lived in different houses, 43.2% lived in this county. Out of people who lived in different counties, 100.0% lived in California.
Rodeo:
92.0%
State average:
88.9%
Education attainment for males 25 years and older:
No schooling: 153
Nursery to 4th grade: 12
5th and 6th grade: 0
7th and 8th grade: 0
9th grade: 79
10th grade: 0
11th grade: 96
12th grade, no diploma: 214
High school graduate (or equivalency): 726
Less than 1 year of college: 268
Some college more than 1 year, no degree: 564
Associate degree: 249
Bachelor's degree: 679
Master's degree: 185
Professional school degree: 37
Doctorate degree: 9
Education attainment for females 25 years and older:
No schooling: 158
Nursery to 4th grade: 86
5th and 6th grade: 0
7th and 8th grade: 0
9th grade: 42
10th grade: 5
11th grade: 83
12th grade, no diploma: 141
High school graduate (or equivalency): 834
Less than 1 year of college: 139
Some college more than 1 year, no degree: 502
Associate degree: 337
Bachelor's degree: 576
Master's degree: 378
Professional school degree: 24
Doctorate degree: 0
Housing units in structures:
One, detached: 2,387
One, attached: 189
Two: 58
3 or 4: 164
5 to 9: 159
10 to 19: 87
20 to 49: 22
50 or more: 96
Mobile homes: 18
Housing units lacking complete plumbing facilities in 2022: 0.6%
Housing units lacking complete kitchen facilities in 2022: 0.8%
House/condo owner moved in on average 18 years ago