Rio Vista, CA (California) Houses and Residents
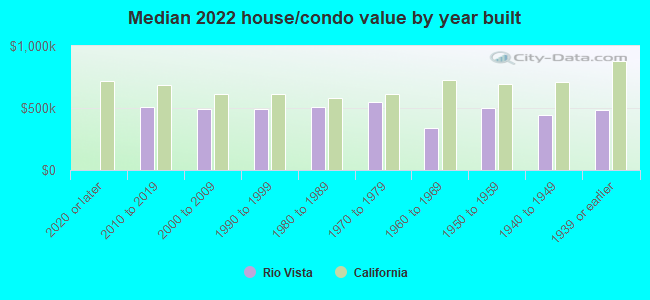
| Rio Vista: | $502,671 |
| California: | $715,900 |
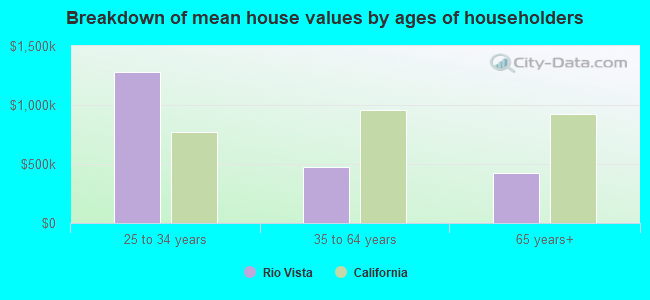
Mean price in 2022:
Detached houses: $505,064
Here: $505,064 State: $988,808 Mobile homes: $59,739
Here: $59,739 State: $184,506
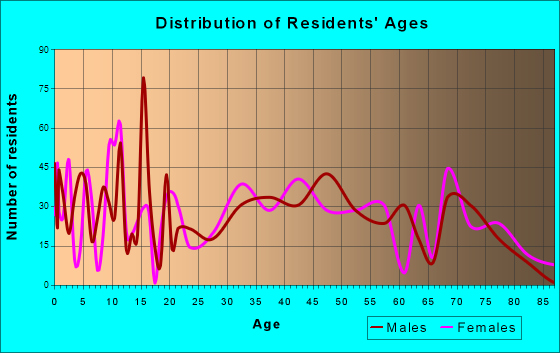
Total population: 8,070 (Urban population: 4,178 (all inside urban clusters), Rural population: 439 (9 farm, 430 nonfarm))
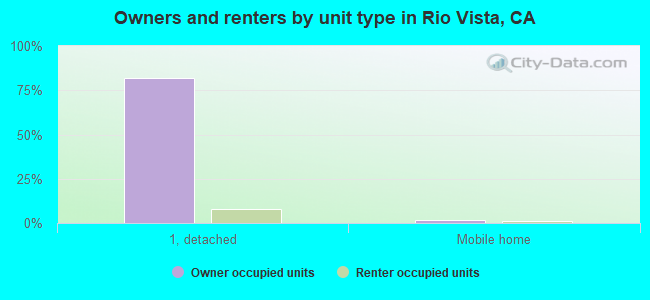
Houses: 5,356 (5,192 occupied: 4,230 owner occupied, 1,037 renter occupied)
| % of renters here: | 20% |
| State: | 44% |
Housing density: 793 houses/condos per square mile
Median price asked for vacant for-sale houses and condos in 2022 in this county: $511,355.
Median contract rent in 2022: $1,348 (lower quartile is $973, upper quartile is $1,729)
Median rent asked for vacant for-rent units in 2022: $2,499
Median gross rent in Rio Vista, CA in 2022: $1,474
Housing units in Rio Vista with a mortgage: 2,526 (226 second mortgage, 0 home equity loan, 207 both second mortgage and home equity loan)
Houses without a mortgage: 22
Median household income for houses/condos with a mortgage: $86,052
Median household income for apartments without a mortgage: $74,735
Median monthly housing costs: $1,409
Compare current foreclosures near Rio Vista, CA:
| Photo | Address | Area | Beds / Baths | Price | Details |
|---|---|---|---|---|---|

|
#1
Anglebrook
Rio Vista, CA 94571
|
1,439 sq. feet
|
2 baths 2 beds |
show details | |

|
#2
N 4th St
Rio Vista, CA 94571
|
1,271 sq. feet
|
1 baths 2 beds |
show details | |

|
#3
De Flores Cir
Rio Vista, CA 94571
|
1,617 sq. feet
|
2 baths 4 beds |
show details | |

|
#4
Shasta Dr
Rio Vista, CA 94571
|
1,218 sq. feet
|
2 baths 4 beds |
show details | |

|
#5
Gold Hills Dr
Rio Vista, CA 94571
|
2,048 sq. feet
|
2 baths 2 beds |
show details | |

|
#6
N 5th St
Rio Vista, CA 94571
|
1,372 sq. feet
|
2 baths 2 beds |
show details | |

|
#7
Brockton Pl
Rio Vista, CA 94571
|
1,420 sq. feet
|
2 baths 2 beds |
show details | |

|
#8
Shadow Creek Dr
Rio Vista, CA 94571
|
2,367 sq. feet
|
4 baths 3 beds |
show details | |

|
#9
Rubier Way
Rio Vista, CA 94571
|
1,617 sq. feet
|
2 baths 4 beds |
show details | |

|
#10
Cedar Ridge Dr
Rio Vista, CA 94571
|
1,105 sq. feet
|
2 baths 2 beds |
show details |
| Photo | Address | Area | Beds / Baths | Price | Details |
|---|---|---|---|---|---|

|
#11
Brockton Pl
Rio Vista, CA 94571
|
1,767 sq. feet
|
2 baths 2 beds |
show details | |

|
#12
Turnberry Ter
Rio Vista, CA 94571
|
970 sq. feet
|
2 baths 2 beds |
show details | |

|
#13
Flores Way
Rio Vista, CA 94571
|
1,161 sq. feet
|
2 baths 3 beds |
show details | |

|
#14
Palisades Dr
Rio Vista, CA 94571
|
1,172 sq. feet
|
2 baths 2 beds |
show details | |

|
#15
N 4th St
Rio Vista, CA 94571
|
2,236 sq. feet
|
1 baths 3 beds |
show details | |

|
#16
Deerfield Way
Rio Vista, CA 94571
|
950 sq. feet
|
2 baths 2 beds |
show details | |

|
#17
Elm Way
Rio Vista, CA 94571
|
1,674 sq. feet
|
2 baths 3 beds |
show details | |

|
#18
Laurel Way
Rio Vista, CA 94571
|
1,884 sq. feet
|
2 baths 3 beds |
show details | |

|
#19
Riviera Dr
Rio Vista, CA 94571
|
1,912 sq. feet
|
2 baths 2 beds |
show details | |

|
#20
Marianna Pl
Rio Vista, CA 94571
|
1,767 sq. feet
|
2 baths 2 beds |
show details |
| Photo | Address | Area | Beds / Baths | Price | Details |
|---|---|---|---|---|---|

|
#21
Crescent Dr
Rio Vista, CA 94571
|
- sq. feet
|
- baths - beds |
show details | |

|
#22
Saint Andrews Dr
Rio Vista, CA 94571
|
- sq. feet
|
- baths - beds |
show details | |

|
#23
David Lamoree Way
Rio Vista, CA 94571
|
- sq. feet
|
- baths - beds |
show details | |

|
#24
S 4th St
Rio Vista, CA 94571
|
- sq. feet
|
- baths - beds |
show details | |

|
#25
River Rd Spc 44
Rio Vista, CA 94571
|
- sq. feet
|
- baths - beds |
show details | |

|
#26
Marks Rd
Rio Vista, CA 94571
|
- sq. feet
|
- baths - beds |
show details | |

|
#27
E 12th St
Pittsburg, CA 94565
|
1,345 sq. feet
|
1 baths 2 beds |
$519,000
|
show details |

|
#28
Doolittle Way
Antioch, CA 94509
|
2,318 sq. feet
|
3 baths 4 beds |
show details | |

|
#29
Sea Point Way
Pittsburg, CA 94565
|
1,643 sq. feet
|
2 baths 3 beds |
show details | |

|
#30
Cub Ct
Antioch, CA 94531
|
3,150 sq. feet
|
3 baths 5 beds |
show details |
| Photo | Address | Area | Beds / Baths | Price | Details |
|---|---|---|---|---|---|

|
#31
San Jose Dr Unit 228
Antioch, CA 94509
|
830 sq. feet
|
2 baths 2 beds |
show details | |

|
#32
Mare Ct
Antioch, CA 94531
|
- sq. feet
|
3 baths 5 beds |
show details | |

|
#33
Morro Dr
Antioch, CA 94531
|
1,067 sq. feet
|
2 baths 3 beds |
show details | |

|
#34
Washington Ave
Courtland, CA 95615
|
810 sq. feet
|
1 baths 2 beds |
show details | |

|
#35
Starlight Ln Apt 165
Antioch, CA 94509
|
944 sq. feet
|
2 baths 2 beds |
show details | |

|
#36
Doyle Rd
Oakley, CA 94561
|
2,067 sq. feet
|
2 baths 4 beds |
show details | |

|
#37
Washington Ave
Courtland, CA 95615
|
1,694 sq. feet
|
2 baths 3 beds |
show details | |

|
#38
Canada Hills Way
Antioch, CA 94531
|
1,680 sq. feet
|
2 baths 4 beds |
show details | |

|
#39
Hampton Ct
Oakley, CA 94561
|
2,349 sq. feet
|
2 baths 4 beds |
show details | |

|
#40
Poplar Dr
Oakley, CA 94561
|
3,341 sq. feet
|
3 baths 4 beds |
show details |
| Photo | Address | Area | Beds / Baths | Price | Details |
|---|---|---|---|---|---|

|
#41
W 15th St
Antioch, CA 94509
|
1,338 sq. feet
|
2 baths 3 beds |
show details | |

|
#42
Sonora Ct
Oakley, CA 94561
|
3,852 sq. feet
|
3 baths 5 beds |
show details | |

|
#43
Beede Way
Antioch, CA 94509
|
2,228 sq. feet
|
2 baths 2 beds |
show details | |

|
#44
Yellowstone Dr
Antioch, CA 94509
|
2,128 sq. feet
|
3 baths 4 beds |
show details | |

|
#45
Beede Way
Antioch, CA 94509
|
1,740 sq. feet
|
2 baths 2 beds |
show details | |

|
#46
Merrill Dr
Antioch, CA 94509
|
2,113 sq. feet
|
3 baths 3 beds |
show details | |

|
#47
Shetland Way
Antioch, CA 94531
|
3,249 sq. feet
|
3 baths 5 beds |
show details | |

|
#48
Meredith Way
Antioch, CA 94509
|
1,508 sq. feet
|
2 baths 3 beds |
show details | |

|
#49
Rocky Point Dr
Antioch, CA 94531
|
3,937 sq. feet
|
4 baths 6 beds |
show details | |

|
Check over 1 million property listings on Foreclosure.com!
|
browse all offers | |||


 | Relocating and Househunting (48 replies) |
| Mystery company has methodically spent $1B to purchase all the land surround Travis AFB (108 replies) |
| Moving to Modesto before end of November. (51 replies) |
| Apartments in Mission Valley (Any recommendations???) (11 replies) |
| If You Had to Move to Either Texas or Mexico, Which Would You Pick? (89 replies) |
| Questions about FAIRFIELD, CA (9 replies) |
Median year apartment built: 1963
Household type by relationship:
Households: 10,023- Male householders: 2,320 (675 living alone), Female householders: 2,779 (1,279 living alone)
2,308 spouses (2,299 opposite-sex spouses), 399 unmarried partners, (399 opposite-sex unmarried partners), 1,314 children (991 natural, 150 adopted, 173 stepchildren), 106 grandchildren, 60 brothers or sisters, 382 parents, 0 foster children, 258 other relatives, 86 non-relatives
- In group quarters: 6
Size of family households: 2,369 2-persons, 320 3-persons, 214 4-persons, 14 6-persons, 84 7-or-more-persons.
Size of nonfamily households: 2,170 1-person, 275 2-persons.
377 married couples with children.
64 single-parent households (35 men, 29 women).
84.0% of residents of Rio Vista speak English at home.
15.2% of residents speak Spanish at home (38% speak English very well, 46% speak English well, 16% speak English not well).
0.8% of residents speak other Indo-European language at home (100% speak English very well).
2.9% of residents speak Asian or Pacific Island language at home (44% speak English very well, 24% speak English well, 26% speak English not well, 6% don't speak English at all).
0.2% of residents speak other language at home (100% speak English very well).
Foreign born population: 1,073 (10.7%)
(71.8% of them are naturalized citizens)
| Here: | 5.4 |
| State: | 6.0 |
| Here: | 4.2 |
| State: | 3.9 |
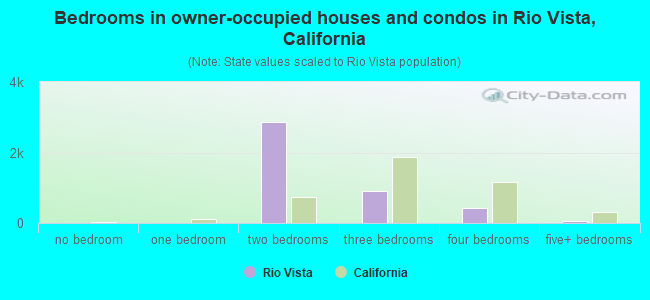
- Bedrooms in owner-occupied houses and condos in Rio Vista, California
- 0no bedroom
- 01 bedroom
- 2,8642 bedrooms
- 8943 bedrooms
- 4154 bedrooms
- 575+ bedrooms
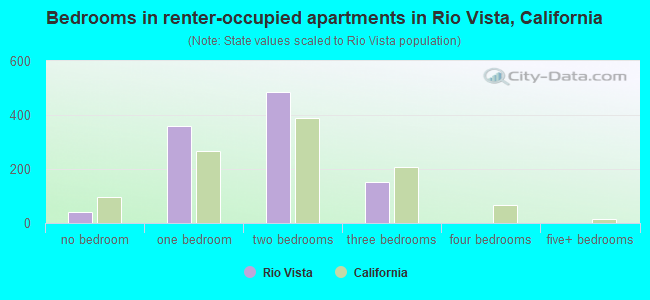
- Bedrooms in renter-occupied apartments in Rio Vista, California
- 42no bedroom
- 3581 bedroom
- 4842 bedrooms
- 1533 bedrooms
- 04 bedrooms
- 05+ bedrooms
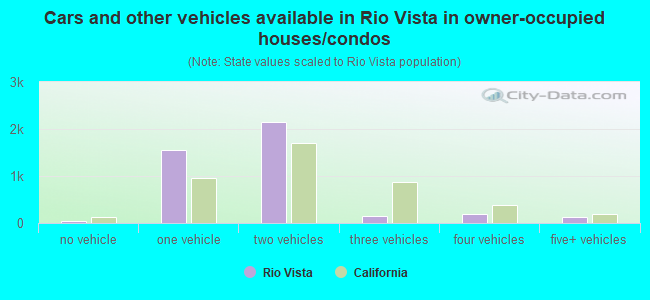
- Cars and other vehicles available in Rio Vista in owner-occupied houses/condos
- 46no vehicle
- 1,5581 vehicle
- 2,1502 vehicles
- 1443 vehicles
- 1984 vehicles
- 1345+ vehicles
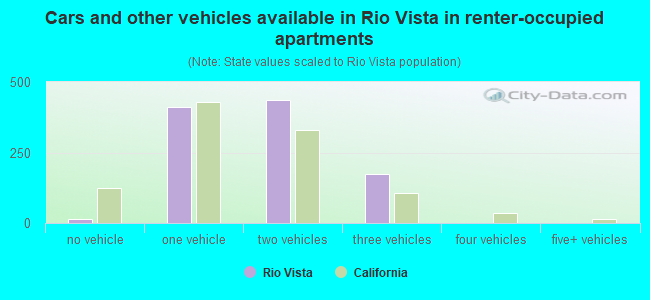
- Cars and other vehicles available in Rio Vista in renter-occupied apartments
- 13no vehicle
- 4131 vehicle
- 4372 vehicles
- 1743 vehicles
- 04 vehicles
- 05+ vehicles
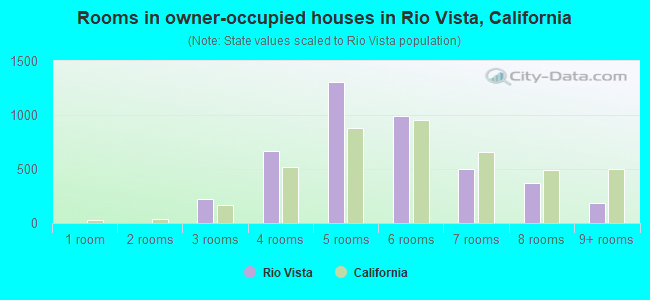
- Rooms in owner-occupied houses in Rio Vista, California
- 01 room
- 02 rooms
- 2183 rooms
- 6694 rooms
- 1,3035 rooms
- 9876 rooms
- 5007 rooms
- 3718 rooms
- 1839+ rooms
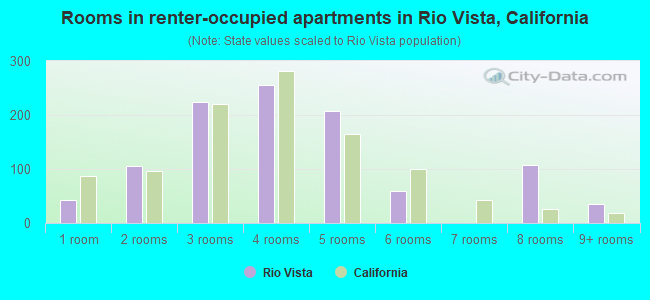
- Rooms in renter-occupied apartments in Rio Vista, California
- 421 room
- 1062 rooms
- 2243 rooms
- 2554 rooms
- 2085 rooms
- 606 rooms
- 07 rooms
- 1088 rooms
- 359+ rooms
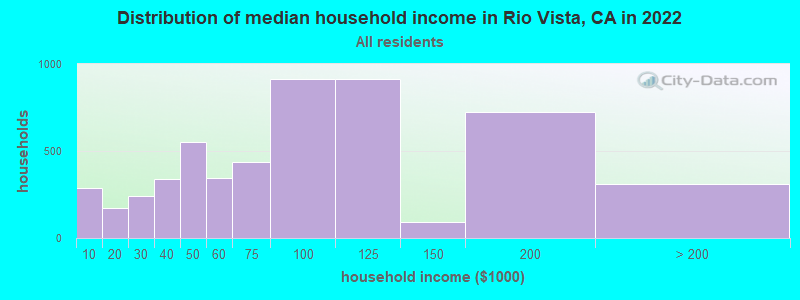
Rio Vista, CA household income distribution

- 290Less than $10,000
- 170$10,000 to $19,999
- 239$20,000 to $29,999
- 338$30,000 to $39,999
- 554$40,000 to $49,999
- 345$50,000 to $59,999
- 439$60,000 to $74,999
- 914$75,000 to $99,999
- 913$100,000 to $124,999
- 93$125,000 to $149,999
- 727$150,000 to $199,999
- 311$200,000 or more
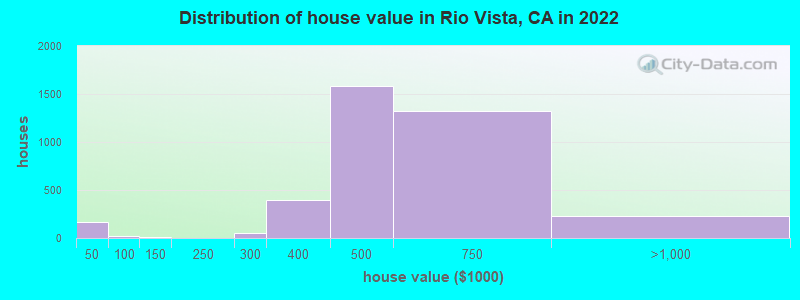
Home value of owner - occupied houses in 2022 in Rio Vista, CA
-
- 73Less than $10,000
- 56$20,000 to $24,999
- 39$35,000 to $39,999
- 25$50,000 to $59,999
- 8$125,000 to $149,999
- 49$250,000 to $299,999
- 391$300,000 to $399,999
- 1,582$400,000 to $499,999
- 1,322$500,000 to $749,999
- 202$750,000 to $999,999
- 22$1,000,000 to $1,499,999
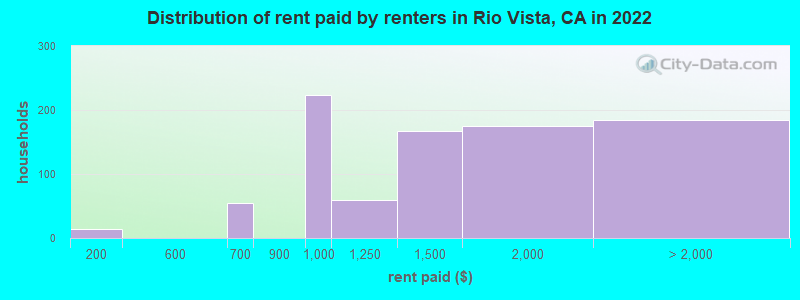
Rent paid by renters in 2022 in Rio Vista, CA
-
- 14$100 to $149
- 30$600 to $649
- 24$650 to $699
- 224$900 to $999
- 58$1,000 to $1,249
- 166$1,250 to $1,499
- 175$1,500 to $1,999
- 109$2,000 to $2,499
- 27$2,500 to $2,999
- 47No cash rent
Percentage of workers working in this county: 62.7%
Number of people working at home: 534 (17.1% of all workers)
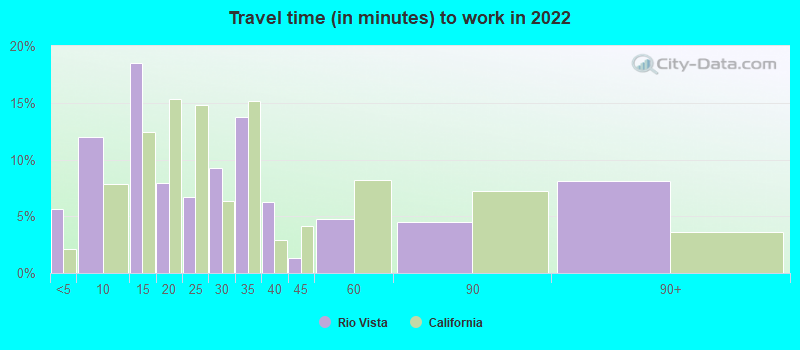
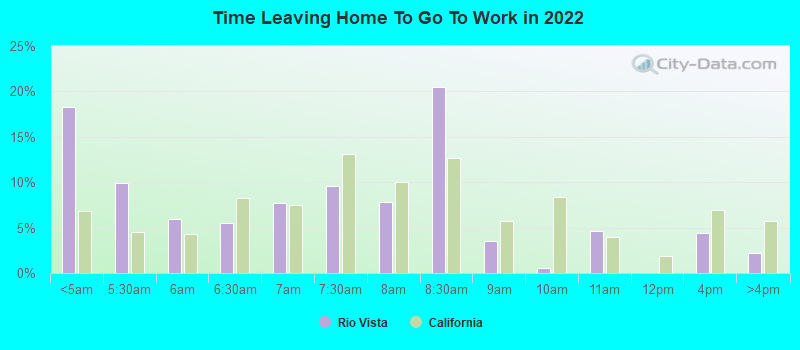
Travel time to work (commute)
- Less than 5 minutes: 110
- 5 to 9 minutes: 192
- 10 to 14 minutes: 372
- 15 to 19 minutes: 108
- 20 to 24 minutes: 28
- 25 to 29 minutes: 42
- 30 to 34 minutes: 415
- 35 to 39 minutes: 118
- 40 to 44 minutes: 48
- 45 to 59 minutes: 724
- 60 to 89 minutes: 372
- 90 or more minutes: 102
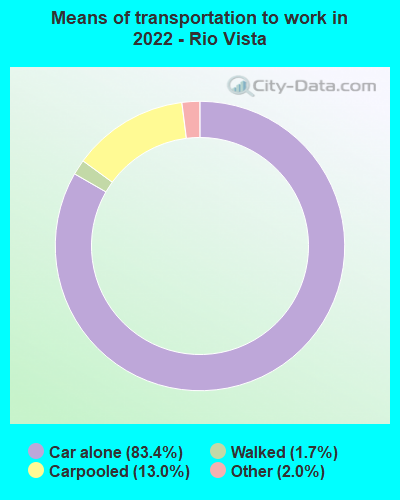
Means of transportation to work:
- Drove a car alone: 1,517 (64.8%)
- Carpooled: 282 (12.1%)
- Taxi: 32 (1.4%)
- Walked: 27 (1.2%)
- Worked at home: 534 (22.8%)
- Unemployment by race in 2022
- Unemployment rate for White non-Hispanic residents
- 10.8%Males
- 24.2%Females
- Unemployment rate for other race residents
- 46.4%Females
- Unemployment rate for Hispanic or Latino residents
- 20.5%Females
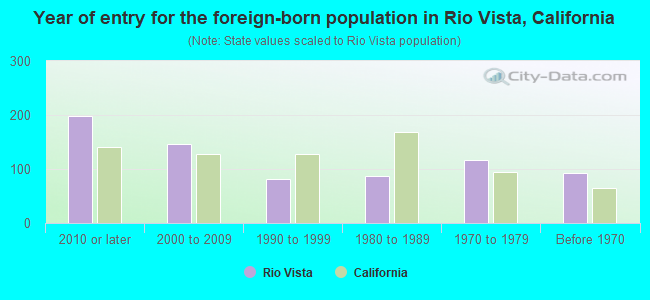
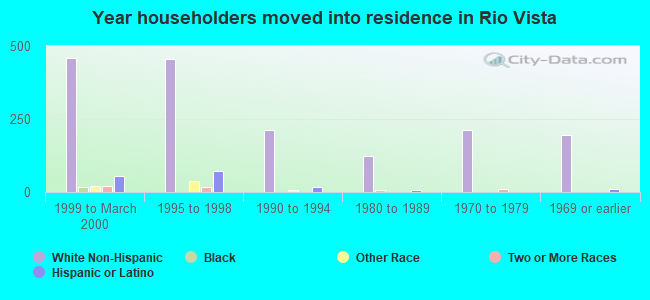
- Year of entry for the foreign-born population in Rio Vista, California
- 1982010 or later
- 1472000 to 2009
- 811990 to 1999
- 871980 to 1989
- 1161970 to 1979
- 92Before 1970
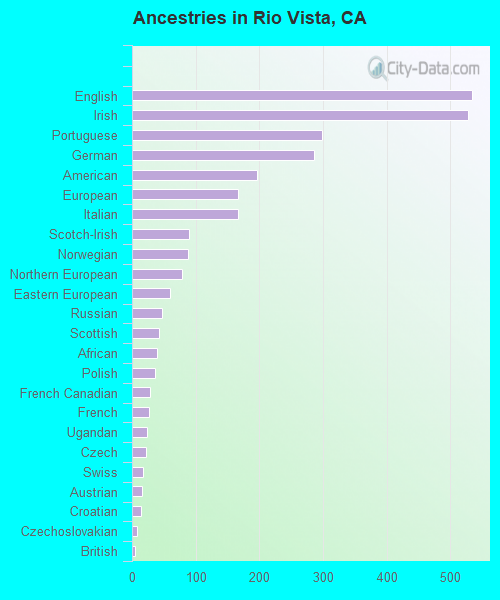
First ancestries reported:
- English: 534 (10.4%)
- Irish: 527 (10.3%)
- Portuguese: 299 (5.8%)
- German: 286 (5.6%)
- American: 197 (3.8%)
- European: 166 (3.2%)
- Italian: 166 (3.2%)
- Scotch-Irish: 89 (1.7%)
- Norwegian: 88 (1.7%)
- Northern European: 79 (1.5%)
- Eastern European: 59 (1.2%)
- Russian: 47 (0.9%)
- Scottish: 43 (0.8%)
- African: 39 (0.8%)
- Polish: 36 (0.7%)
- French Canadian: 28 (0.5%)
- French: 27 (0.5%)
- Ugandan: 24 (0.5%)
- Czech: 22 (0.4%)
- Swiss: 17 (0.3%)
- Austrian: 15 (0.3%)
- Croatian: 14 (0.3%)
- Czechoslovakian: 8 (0.2%)
- British: 5 (0.10%)
Most common places of birth for foreign-born residents (%):
| Rio Vista: | 32.4% (330) |
| California: | 37.2% (3,881,193) |
| Rio Vista: | 12.8% (131) |
| California: | 7.8% (818,297) |
| Rio Vista: | 12.0% (122) |
| California: | 0.5% (53,222) |
| Rio Vista: | 10.1% (103) |
| California: | 6.6% (684,672) |
| Rio Vista: | 9.0% (92) |
| California: | 0.1% (12,623) |
| Rio Vista: | 4.0% (41) |
| California: | 0.1% (15,357) |
| Rio Vista: | 3.2% (33) |
| California: | 4.2% (440,287) |
| Rio Vista: | 2.6% (27) |
| California: | 0.4% (40,224) |
| Rio Vista: | 2.5% (25) |
| California: | 1.7% (176,274) |
| Rio Vista: | 2.2% (22) |
| California: | 0.0% (4,329) |
| Rio Vista: | 1.7% (17) |
| California: | 0.5% (48,911) |
| Rio Vista: | 1.7% (17) |
| California: | 0.3% (33,960) |
| Rio Vista: | 1.6% (16) |
| California: | 0.7% (71,932) |
| Rio Vista: | 1.6% (16) |
| California: | 0.7% (73,304) |
Place of birth for U.S.-born residents:
- This state: 5,762
- Other state: 2,998
- Northeast: 616
- Midwest: 1,038
- South: 886
- West: 478
89.2% of Rio Vista residents lived in the same house 1 years ago.
Out of people who lived in different houses, 23.1% lived in this county.
Out of people who lived in different counties, 77.2% lived in California.
| Rio Vista: | 89.2% |
| State average: | 88.9% |
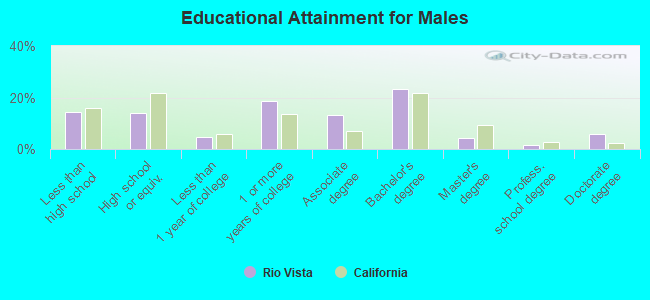
Education attainment for males 25 years and older:
- No schooling: 41
- Nursery to 4th grade: 32
- 5th and 6th grade: 0
- 7th and 8th grade: 11
- 9th grade: 7
- 10th grade: 375
- 11th grade: 41
- 12th grade, no diploma: 91
- High school graduate (or equivalency): 581
- Less than 1 year of college: 199
- Some college more than 1 year, no degree: 762
- Associate degree: 550
- Bachelor's degree: 956
- Master's degree: 180
- Professional school degree: 66
- Doctorate degree: 239
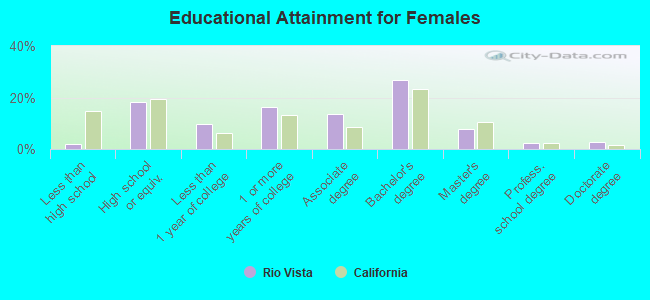
Education attainment for females 25 years and older:
- No schooling: 0
- Nursery to 4th grade: 0
- 5th and 6th grade: 0
- 7th and 8th grade: 16
- 9th grade: 0
- 10th grade: 4
- 11th grade: 1
- 12th grade, no diploma: 77
- High school graduate (or equivalency): 899
- Less than 1 year of college: 479
- Some college more than 1 year, no degree: 793
- Associate degree: 663
- Bachelor's degree: 1,322
- Master's degree: 388
- Professional school degree: 115
- Doctorate degree: 142
Housing units in structures:
- One, detached: 4,601
- One, attached: 104
- Two: 199
- 3 or 4: 74
- 5 to 9: 240
- Mobile homes: 135
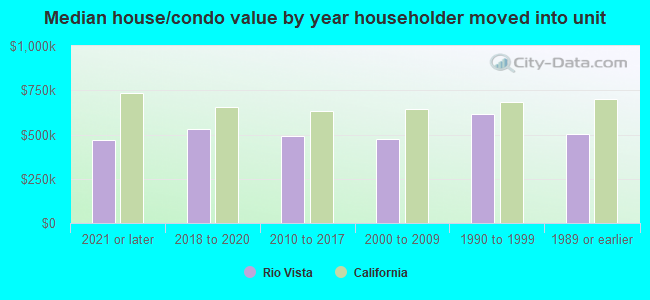
House/condo owner moved in on average 7 years ago
Renter moved in on average 1 years ago
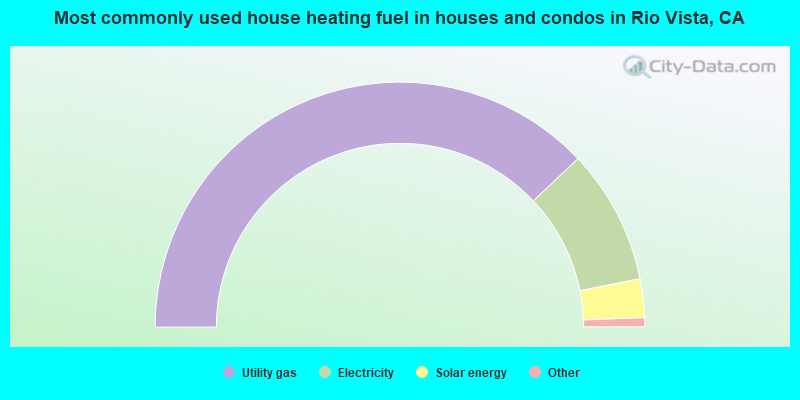
- 75.9%Utility gas
- 17.8%Electricity
- 5.1%Solar energy
- 0.7%No fuel used
- 0.6%Wood
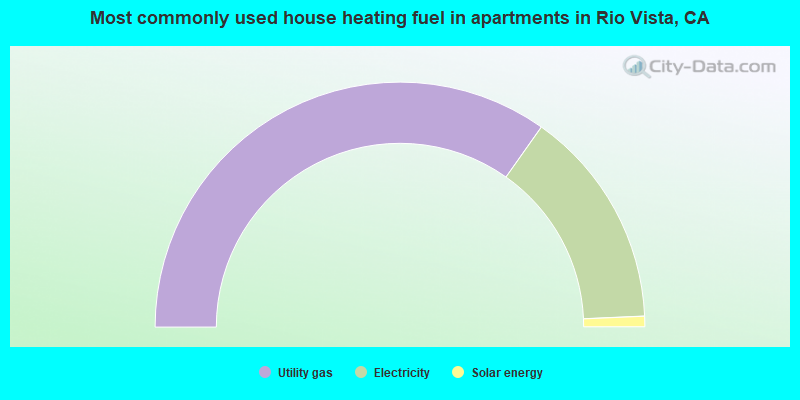
- 69.6%Utility gas
- 29.0%Electricity
- 1.4%Solar energy
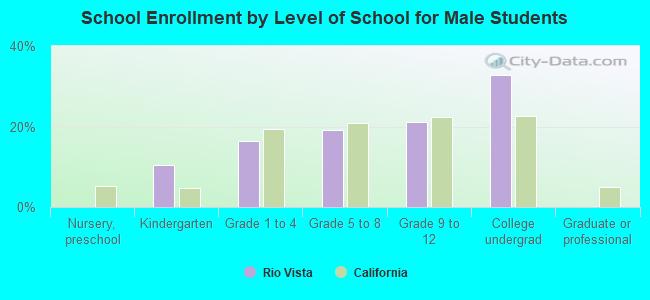
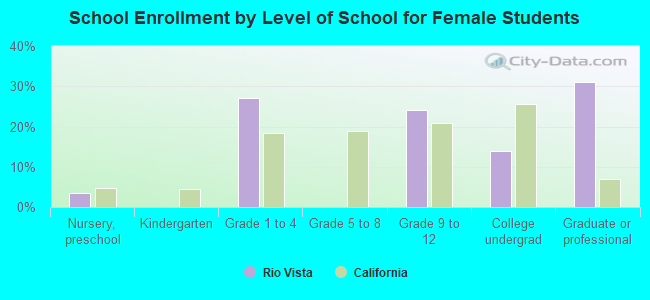
Private vs. public school enrollment:
| Here: | 28.1% |
| California: | 10.5% |
| Here: | 0.0% |
| California: | 8.5% |
| Here: | 0.0% |
| California: | 15.9% |