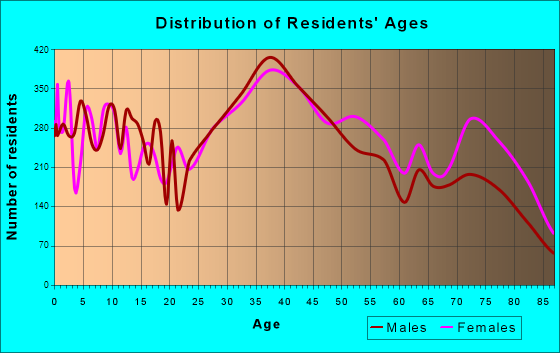
Pinellas Park, FL (Florida) Houses and Residents
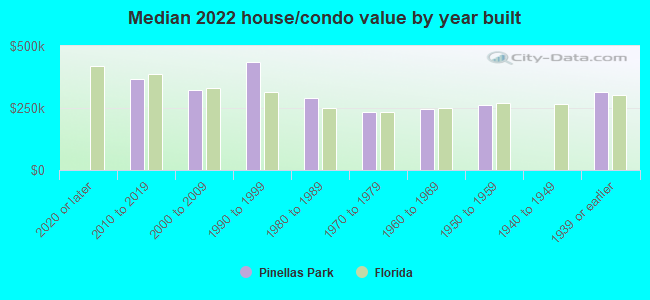
| Pinellas Park: | $285,194 |
| Florida: | $354,100 |
Mean price in 2022:
Detached houses: $235,501
Here: $235,501 State: $500,941 Townhouses or other attached units: $174,334
Here: $174,334 State: $370,869 In 2-unit structures: $217,751
Here: $217,751 State: $423,188 In 3-to-4-unit structures: $177,304
Here: $177,304 State: $309,944 In 5-or-more-unit structures: $210,565
Here: $210,565 State: $447,145 Mobile homes: $35,309
Here: $35,309 State: $113,202 Occupied boats, RVs, vans, etc.: $124,005
Here: $124,005 State: $73,933
Total population: 50,946 (Urban population: 45,414, Rural population: 0)
Houses: 25,162 (21,439 occupied: 15,263 owner occupied, 6,359 renter occupied)
| % of renters here: | 29% |
| State: | 33% |
Housing density: 1,706 houses/condos per square mile
Median price asked for vacant for-sale houses and condos in 2022: $192,440.
Median contract rent in 2022: $1,244 (lower quartile is $836, upper quartile is $1,596)
Median rent asked for vacant for-rent units in 2022: $1,434
Median gross rent in Pinellas Park, FL in 2022: $1,443
Housing units in Pinellas Park with a mortgage: 8,321 (613 second mortgage, 0 home equity loan, 456 both second mortgage and home equity loan)
Houses without a mortgage: 48
Median household income for houses/condos with a mortgage: $94,701
Median household income for apartments without a mortgage: $47,203
Median monthly housing costs: $1,194
Compare current foreclosures in Pinellas Park, FL:
| Photo | Address | Area | Beds / Baths | Price | Details |
|---|---|---|---|---|---|

|
#1
66th Ave N
Pinellas Park, FL 33781
|
920 sq. feet
|
1 baths - beds |
show details | |

|
#2
106th Ave N
Pinellas Park, FL 33782
|
1,728 sq. feet
|
2 baths - beds |
show details | |

|
#3
62nd St N
Pinellas Park, FL 33782
|
1,128 sq. feet
|
2 baths - beds |
show details | |

|
#4
116th Ave N
Pinellas Park, FL 33782
|
1,848 sq. feet
|
2 baths - beds |
show details | |

|
#5
87th Ave N
Pinellas Park, FL 33782
|
1,737 sq. feet
|
2 baths - beds |
show details | |

|
#6
42nd Way N
Pinellas Park, FL 33781
|
1,664 sq. feet
|
2 baths - beds |
show details | |

|
#7
Oakhaven Dr N
Pinellas Park, FL 33782
|
1,371 sq. feet
|
2 baths - beds |
show details | |

|
#8
98th Ter N
Pinellas Park, FL 33782
|
1,008 sq. feet
|
1 baths - beds |
show details | |

|
#9
79th Ave N
Pinellas Park, FL 33781
|
1,150 sq. feet
|
2 baths - beds |
show details | |

|
#10
58th Ln N
Pinellas Park, FL 33782
|
1,170 sq. feet
|
2 baths - beds |
show details |
| Photo | Address | Area | Beds / Baths | Price | Details |
|---|---|---|---|---|---|

|
#11
58th St N
Pinellas Park, FL 33782
|
1,561 sq. feet
|
2 baths - beds |
show details | |

|
#12
63rd St N
Pinellas Park, FL 33781
|
1,372 sq. feet
|
1 baths - beds |
show details | |

|
#13
59th St N
Pinellas Park, FL 33781
|
1,520 sq. feet
|
2 baths - beds |
show details | |

|
#14
47th St N
Pinellas Park, FL 33781
|
966 sq. feet
|
1 baths - beds |
show details | |

|
#15
94th Ave N
Pinellas Park, FL 33782
|
1,075 sq. feet
|
2 baths - beds |
show details | |

|
#16
55th St N
Pinellas Park, FL 33782
|
965 sq. feet
|
2 baths - beds |
show details | |

|
#17
56th St
Pinellas Park, FL 33782
|
1,819 sq. feet
|
3 baths - beds |
show details | |

|
#18
70th St
Pinellas Park, FL 33781
|
1,125 sq. feet
|
2 baths - beds |
show details | |

|
#19
70th Ave
Pinellas Park, FL 33781
|
1,008 sq. feet
|
1 baths - beds |
show details | |

|
#20
Waterash Ln N
Pinellas Park, FL 33782
|
6,087 sq. feet
|
7 baths - beds |
show details |
| Photo | Address | Area | Beds / Baths | Price | Details |
|---|---|---|---|---|---|

|
#21
102nd Ter N
Pinellas Park, FL 33782
|
1,336 sq. feet
|
2 baths - beds |
show details | |

|
#22
69th Ave N
Pinellas Park, FL 33781
|
864 sq. feet
|
1 baths - beds |
show details | |

|
#23
82nd Ave N
Pinellas Park, FL 33781
|
1,635 sq. feet
|
2 baths - beds |
show details | |

|
#24
62nd St N
Pinellas Park, FL 33782
|
858 sq. feet
|
2 baths - beds |
show details | |

|
#25
60th St N
Pinellas Park, FL 33782
|
1,320 sq. feet
|
3 baths - beds |
show details | |

|
#26
67th St N
Pinellas Park, FL 33782
|
1,140 sq. feet
|
2 baths - beds |
show details | |

|
#27
106th Ave N
Pinellas Park, FL 33782
|
1,413 sq. feet
|
2 baths - beds |
show details | |

|
#28
76th Ave N
Pinellas Park, FL 33781
|
1,735 sq. feet
|
2 baths - beds |
show details | |

|
#29
62nd St N
Pinellas Park, FL 33782
|
1,201 sq. feet
|
1 baths - beds |
show details | |

|
#30
45th St N
Pinellas Park, FL 33782
|
1,023 sq. feet
|
1 baths - beds |
show details |
| Photo | Address | Area | Beds / Baths | Price | Details |
|---|---|---|---|---|---|

|
#31
84th Ave N
Pinellas Park, FL 33781
|
1,574 sq. feet
|
1 baths - beds |
show details | |

|
#32
72nd Ave N
Pinellas Park, FL 33781
|
1,127 sq. feet
|
2 baths - beds |
show details | |

|
#33
109th Ave N
Pinellas Park, FL 33782
|
2,188 sq. feet
|
2 baths - beds |
show details | |

|
#34
Elmhurst Dr N
Pinellas Park, FL 33782
|
1,242 sq. feet
|
2 baths - beds |
show details | |

|
#35
Beechwood Ter N
Pinellas Park, FL 33781
|
1,272 sq. feet
|
1 baths - beds |
show details | |

|
#36
67th St N
Pinellas Park, FL 33781
|
1,075 sq. feet
|
1 baths - beds |
show details | |

|
#37
47th St N
Pinellas Park, FL 33781
|
1,210 sq. feet
|
- baths - beds |
show details | |

|
#38
55th Way N
Pinellas Park, FL 33782
|
1,020 sq. feet
|
1 baths - beds |
show details | |

|
#39
72nd Ave N
Pinellas Park, FL 33781
|
980 sq. feet
|
1 baths - beds |
show details | |

|
#40
92nd Ave N
Pinellas Park, FL 33782
|
1,152 sq. feet
|
2 baths - beds |
show details |
| Photo | Address | Area | Beds / Baths | Price | Details |
|---|---|---|---|---|---|

|
#41
Rose Pl N
Pinellas Park, FL 33782
|
850 sq. feet
|
- baths - beds |
show details | |

|
#42
71st St N
Pinellas Park, FL 33781
|
1,049 sq. feet
|
- baths - beds |
show details | |

|
#43
63rd St N
Pinellas Park, FL 33781
|
1,156 sq. feet
|
2 baths - beds |
show details | |

|
#44
86th Ave N
Pinellas Park, FL 33782
|
1,268 sq. feet
|
1 baths - beds |
show details | |

|
#45
55th St N
Pinellas Park, FL 33782
|
743 sq. feet
|
1 baths - beds |
show details | |

|
#46
58th St N
Pinellas Park, FL 33782
|
1,650 sq. feet
|
3 baths - beds |
show details | |

|
#47
Canal Dr N
Pinellas Park, FL 33781
|
854 sq. feet
|
2 baths - beds |
show details | |

|
#48
55th St N
Pinellas Park, FL 33782
|
1,080 sq. feet
|
1 baths - beds |
show details | |

|
#49
Mainlands Blvd W
Pinellas Park, FL 33782
|
1,292 sq. feet
|
2 baths - beds |
show details | |

|
Check over 1 million property listings on Foreclosure.com!
|
browse all offers | |||


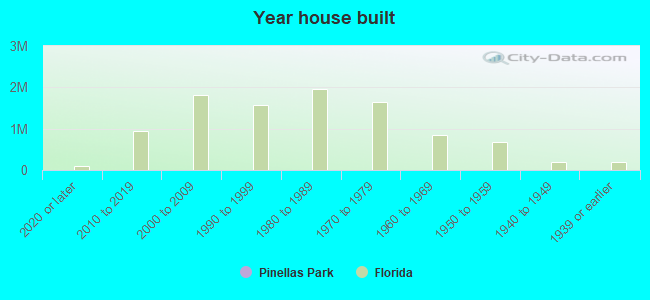
Median year apartment built: 1980
Household type by relationship:
Households: 53,453- Male householders: 10,377 (2,785 living alone), Female householders: 10,953 (4,148 living alone)
9,177 spouses (8,968 opposite-sex spouses), 1,997 unmarried partners, (1,838 opposite-sex unmarried partners), 13,325 children (12,053 natural, 409 adopted, 861 stepchildren), 877 grandchildren, 831 brothers or sisters, 1,854 parents, 113 foster children, 648 other relatives, 2,276 non-relatives
- In group quarters: 1,019
Size of family households: 6,313 2-persons, 2,557 3-persons, 1,787 4-persons, 745 5-persons, 445 6-persons, 79 7-or-more-persons.
Size of nonfamily households: 7,510 1-person, 1,729 2-persons, 182 3-persons, 19 4-persons, 36 5-persons, 20 6-persons.
5,751 married couples with children.
2,173 single-parent households (716 men, 1,457 women).
75.2% of residents of Pinellas Park speak English at home.
10.4% of residents speak Spanish at home (54% speak English very well, 27% speak English well, 18% speak English not well, 2% don't speak English at all).
4.6% of residents speak other Indo-European language at home (65% speak English very well, 24% speak English well, 10% speak English not well, 2% don't speak English at all).
8.8% of residents speak Asian or Pacific Island language at home (35% speak English very well, 29% speak English well, 22% speak English not well, 14% don't speak English at all).
0.6% of residents speak other language at home (53% speak English very well, 13% speak English well, 34% speak English not well).
Foreign born population: 9,048 (16.9%)
(59.8% of them are naturalized citizens)
| Here: | 5.4 |
| State: | 5.9 |
| Here: | 3.9 |
| State: | 4.2 |
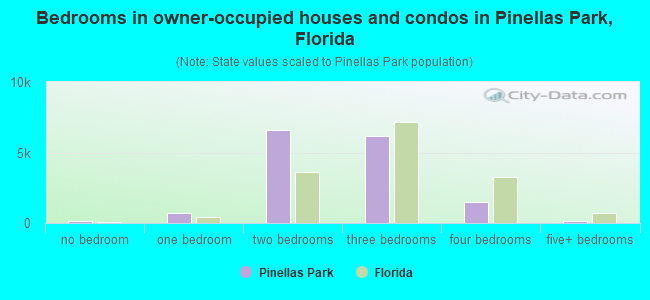
- Bedrooms in owner-occupied houses and condos in Pinellas Park, Florida
- 175no bedroom
- 7431 bedroom
- 6,5702 bedrooms
- 6,1423 bedrooms
- 1,4984 bedrooms
- 1355+ bedrooms
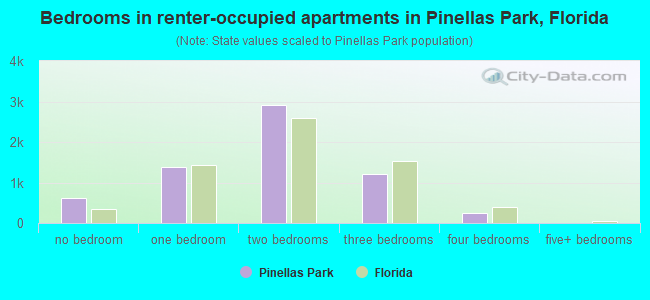
- Bedrooms in renter-occupied apartments in Pinellas Park, Florida
- 606no bedroom
- 1,3841 bedroom
- 2,9242 bedrooms
- 1,2043 bedrooms
- 2424 bedrooms
- 05+ bedrooms
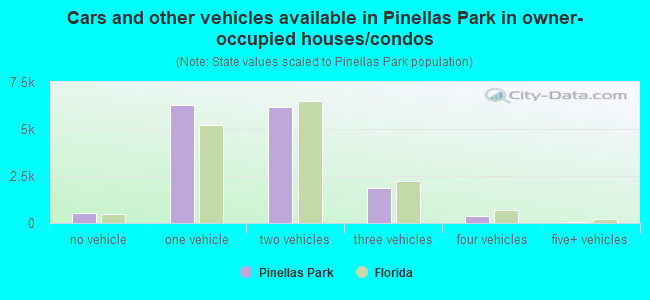
- Cars and other vehicles available in Pinellas Park in owner-occupied houses/condos
- 550no vehicle
- 6,2661 vehicle
- 6,1912 vehicles
- 1,8393 vehicles
- 3864 vehicles
- 305+ vehicles
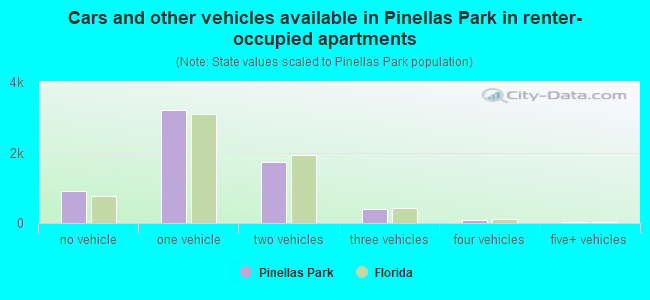
- Cars and other vehicles available in Pinellas Park in renter-occupied apartments
- 920no vehicle
- 3,1921 vehicle
- 1,7392 vehicles
- 4053 vehicles
- 794 vehicles
- 245+ vehicles
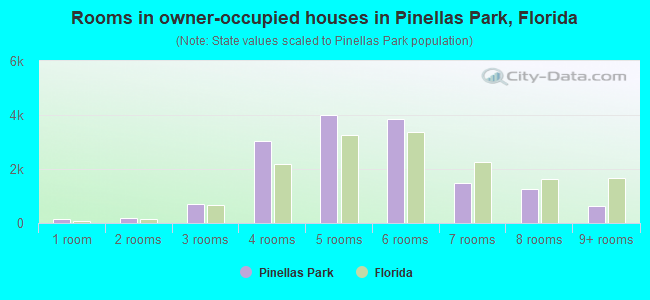
- Rooms in owner-occupied houses in Pinellas Park, Florida
- 1471 room
- 1982 rooms
- 7163 rooms
- 3,0214 rooms
- 3,9935 rooms
- 3,8356 rooms
- 1,4647 rooms
- 1,2678 rooms
- 6229+ rooms
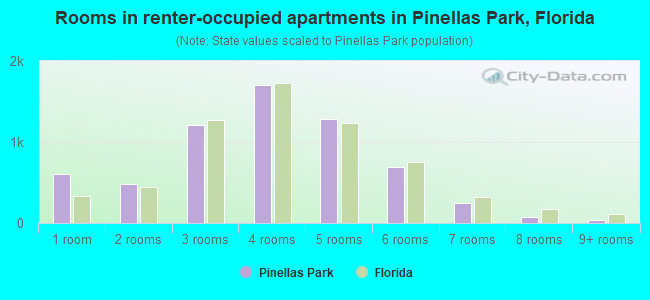
- Rooms in renter-occupied apartments in Pinellas Park, Florida
- 5991 room
- 4862 rooms
- 1,2163 rooms
- 1,7084 rooms
- 1,2865 rooms
- 6966 rooms
- 2517 rooms
- 778 rooms
- 419+ rooms
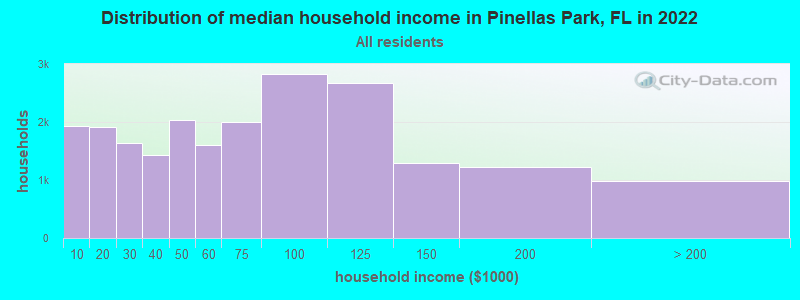
Pinellas Park, FL household income distribution

- 1,927Less than $10,000
- 1,910$10,000 to $19,999
- 1,639$20,000 to $29,999
- 1,427$30,000 to $39,999
- 2,043$40,000 to $49,999
- 1,607$50,000 to $59,999
- 2,008$60,000 to $74,999
- 2,819$75,000 to $99,999
- 2,669$100,000 to $124,999
- 1,301$125,000 to $149,999
- 1,216$150,000 to $199,999
- 984$200,000 or more
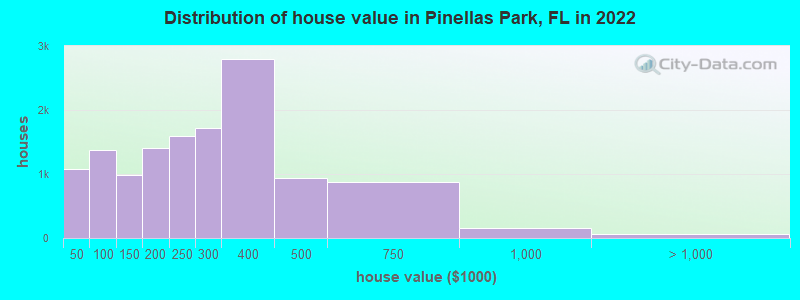
Home value of owner - occupied houses in 2022 in Pinellas Park, FL
-
- 194Less than $10,000
- 132$10,000 to $14,999
- 119$15,000 to $19,999
- 249$20,000 to $24,999
- 99$25,000 to $29,999
- 77$30,000 to $34,999
- 46$35,000 to $39,999
- 160$40,000 to $49,999
- 407$50,000 to $59,999
- 169$60,000 to $69,999
- 184$70,000 to $79,999
- 281$80,000 to $89,999
- 168$90,000 to $99,999
- 647$100,000 to $124,999
- 344$125,000 to $149,999
- 719$150,000 to $174,999
- 693$175,000 to $199,999
- 1,589$200,000 to $249,999
- 1,726$250,000 to $299,999
- 2,792$300,000 to $399,999
- 944$400,000 to $499,999
- 871$500,000 to $749,999
- 154$750,000 to $999,999
- 8$1,000,000 to $1,499,999
- 47$1,500,000 to $1,999,999
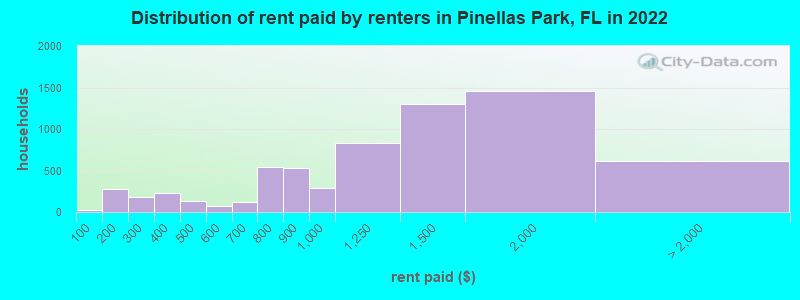
Rent paid by renters in 2022 in Pinellas Park, FL
-
- 26Less than $100
- 277$150 to $199
- 106$200 to $249
- 76$250 to $299
- 118$300 to $349
- 105$350 to $399
- 91$400 to $449
- 35$450 to $499
- 60$500 to $549
- 10$550 to $599
- 29$600 to $649
- 88$650 to $699
- 306$700 to $749
- 236$750 to $799
- 528$800 to $899
- 284$900 to $999
- 828$1,000 to $1,249
- 1,297$1,250 to $1,499
- 1,456$1,500 to $1,999
- 298$2,000 to $2,499
- 41$2,500 to $2,999
- 269No cash rent
Percentage of workers working in this county: 88.4%
Number of people working at home: 3,272 (12.9% of all workers)

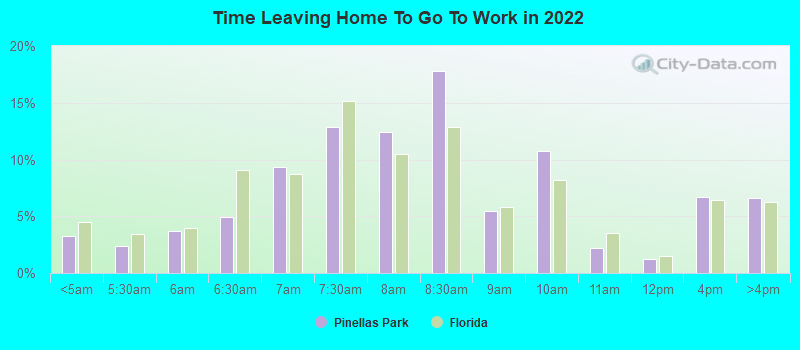
Travel time to work (commute)
- Less than 5 minutes: 311
- 5 to 9 minutes: 1,410
- 10 to 14 minutes: 2,746
- 15 to 19 minutes: 5,677
- 20 to 24 minutes: 3,857
- 25 to 29 minutes: 1,325
- 30 to 34 minutes: 2,599
- 35 to 39 minutes: 426
- 40 to 44 minutes: 663
- 45 to 59 minutes: 798
- 60 to 89 minutes: 987
- 90 or more minutes: 507
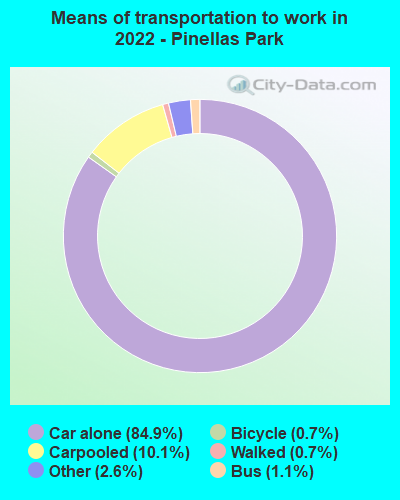
Means of transportation to work:
- Drove a car alone: 27,777 (72.6%)
- Carpooled: 3,835 (10.0%)
- Bus: 388 (1.0%)
- Taxi: 1,029 (2.7%)
- Bicycle: 269 (0.7%)
- Walked: 244 (0.6%)
- Worked at home: 3,272 (8.6%)
- Unemployment by race in 2022
- Unemployment rate for White non-Hispanic residents
- 5.6%Males
- 4.5%Females
- Unemployment rate for Black residents
- 2.4%Males
- Unemployment rate for American Indian and Alaska Native residents
- 43.8%Females
- Unemployment rate for Asian residents
- 3.4%Males
- Unemployment rate for other race residents
- 4.6%Males
- Unemployment rate for two or more race residents
- 3.3%Males
- 4.2%Females
- Unemployment rate for Hispanic or Latino residents
- 4.7%Males
- 4.1%Females
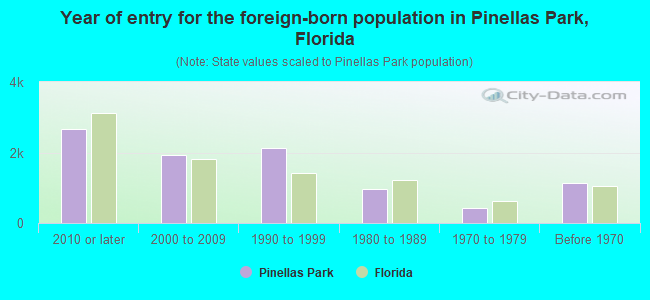
- Year of entry for the foreign-born population in Pinellas Park, Florida
- 2,6542010 or later
- 1,9352000 to 2009
- 2,1401990 to 1999
- 9641980 to 1989
- 4341970 to 1979
- 1,125Before 1970
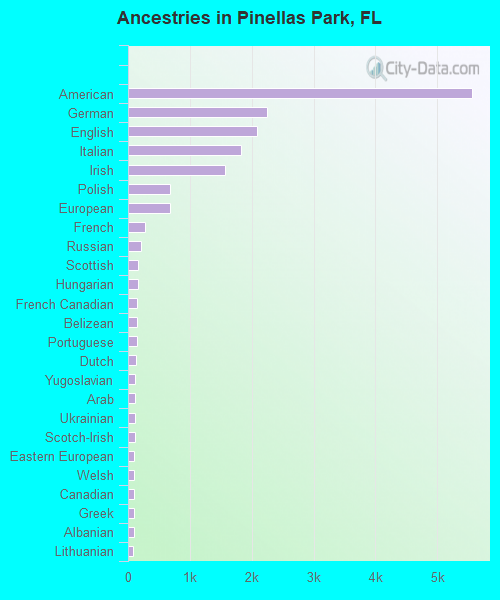
First ancestries reported:
- American: 5,557 (19.1%)
- German: 2,242 (7.7%)
- English: 2,088 (7.2%)
- Italian: 1,822 (6.3%)
- Irish: 1,571 (5.4%)
- Polish: 682 (2.3%)
- European: 680 (2.3%)
- French: 278 (1.0%)
- Russian: 204 (0.7%)
- Scottish: 162 (0.6%)
- Hungarian: 159 (0.5%)
- French Canadian: 146 (0.5%)
- Belizean: 146 (0.5%)
- Portuguese: 143 (0.5%)
- Dutch: 129 (0.4%)
- Yugoslavian: 118 (0.4%)
- Arab: 109 (0.4%)
- Ukrainian: 108 (0.4%)
- Scotch-Irish: 107 (0.4%)
- Eastern European: 104 (0.4%)
- Welsh: 95 (0.3%)
- Canadian: 93 (0.3%)
- Greek: 93 (0.3%)
- Albanian: 92 (0.3%)
- Lithuanian: 80 (0.3%)
- Swedish: 60 (0.2%)
- Serbian: 56 (0.2%)
- Finnish: 44 (0.2%)
- Iranian: 39 (0.1%)
- Brazilian: 38 (0.1%)
- Slovak: 35 (0.1%)
- Northern European: 34 (0.1%)
- Czech: 33 (0.1%)
- Norwegian: 32 (0.1%)
- Palestinian: 31 (0.1%)
- Romanian: 27 (0.09%)
- Trinidadian and Tobagonian: 21 (0.07%)
- Bulgarian: 19 (0.07%)
- Jamaican: 18 (0.06%)
- Croatian: 17 (0.06%)
- British: 15 (0.05%)
- Australian: 15 (0.05%)
- Swiss: 11 (0.04%)
- Syrian: 10 (0.03%)
- Slovene: 10 (0.03%)
- Danish: 10 (0.03%)
- Austrian: 10 (0.03%)
- Turkish: 5 (0.02%)
Most common places of birth for foreign-born residents (%):
| Pinellas Park: | 29.7% (2,712) |
| Florida: | 1.3% (60,604) |
| Pinellas Park: | 9.3% (846) |
| Florida: | 22.0% (1,006,576) |
| Pinellas Park: | 4.8% (443) |
| Florida: | 1.8% (84,403) |
| Pinellas Park: | 4.3% (395) |
| Florida: | 5.6% (257,152) |
| Pinellas Park: | 4.0% (369) |
| Florida: | 2.1% (94,349) |
| Pinellas Park: | 3.4% (314) |
| Florida: | 1.2% (54,272) |
| Pinellas Park: | 3.4% (307) |
| Florida: | 6.5% (298,669) |
| Pinellas Park: | 3.2% (292) |
| Florida: | 2.4% (109,132) |
| Pinellas Park: | 2.8% (259) |
| Florida: | 0.2% (8,695) |
| Pinellas Park: | 2.4% (222) |
| Florida: | 0.1% (4,073) |
| Pinellas Park: | 2.1% (195) |
| Florida: | 5.7% (262,042) |
| Pinellas Park: | 2.1% (189) |
| Florida: | 1.2% (56,071) |
| Pinellas Park: | 1.9% (173) |
| Florida: | 2.7% (122,906) |
| Pinellas Park: | 1.8% (168) |
| Florida: | 0.3% (12,303) |
Place of birth for U.S.-born residents:
- This state: 19,242
- Other state: 23,736
- Northeast: 10,138
- Midwest: 7,887
- South: 4,329
- West: 1,406
87.3% of Pinellas Park residents lived in the same house 1 years ago.
Out of people who lived in different houses, 34.2% lived in this county.
Out of people who lived in different counties, 32.8% lived in Florida.
| Pinellas Park: | 87.3% |
| State average: | 86.3% |
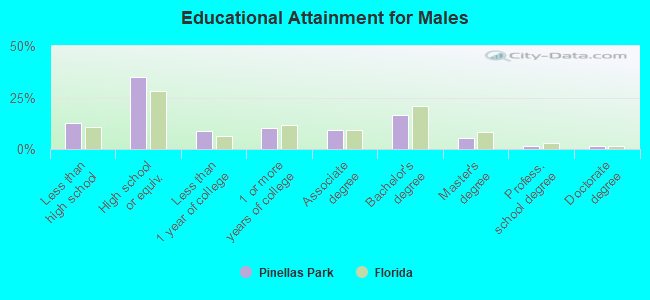
Education attainment for males 25 years and older:
- No schooling: 858
- Nursery to 4th grade: 159
- 5th and 6th grade: 229
- 7th and 8th grade: 256
- 9th grade: 99
- 10th grade: 296
- 11th grade: 205
- 12th grade, no diploma: 356
- High school graduate (or equivalency): 6,854
- Less than 1 year of college: 1,724
- Some college more than 1 year, no degree: 1,977
- Associate degree: 1,831
- Bachelor's degree: 3,232
- Master's degree: 1,097
- Professional school degree: 241
- Doctorate degree: 255
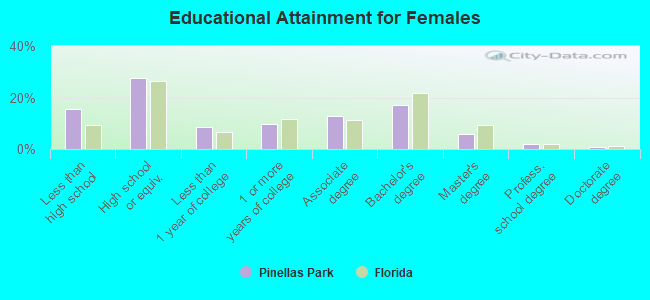
Education attainment for females 25 years and older:
- No schooling: 958
- Nursery to 4th grade: 14
- 5th and 6th grade: 316
- 7th and 8th grade: 442
- 9th grade: 223
- 10th grade: 329
- 11th grade: 567
- 12th grade, no diploma: 455
- High school graduate (or equivalency): 5,768
- Less than 1 year of college: 1,793
- Some college more than 1 year, no degree: 2,066
- Associate degree: 2,673
- Bachelor's degree: 3,566
- Master's degree: 1,262
- Professional school degree: 426
- Doctorate degree: 166
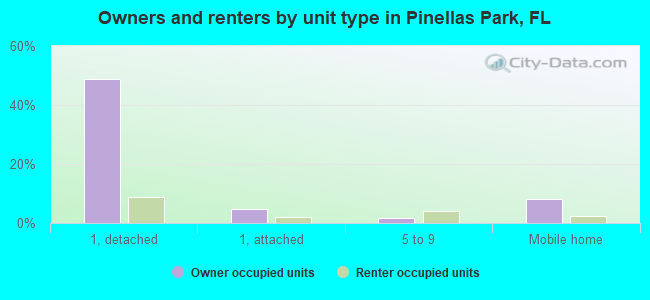
Housing units in structures:
- One, detached: 13,667
- One, attached: 1,815
- Two: 622
- 3 or 4: 981
- 5 to 9: 1,205
- 10 to 19: 1,151
- 20 to 49: 716
- 50 or more: 1,140
- Mobile homes: 3,795
- Boats, RVs, vans, etc.: 64
Median worth of mobile homes: $67,531
Housing units lacking complete kitchen facilities in 2022: 1.6%
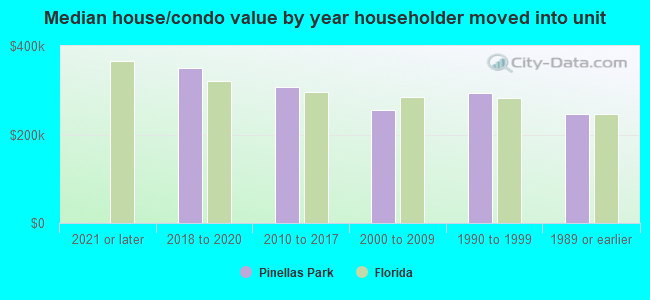
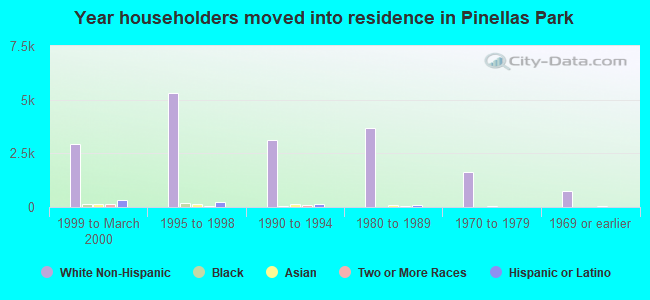
House/condo owner moved in on average 8 years ago
Renter moved in on average 2 years ago
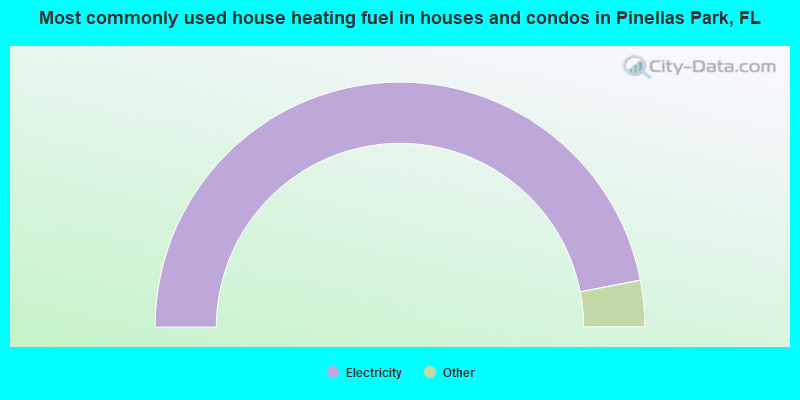
- 93.9%Electricity
- 2.3%Utility gas
- 1.3%No fuel used
- 1.0%Solar energy
- 1.0%Fuel oil, kerosene, etc.
- 0.5%Bottled, tank, or LP gas
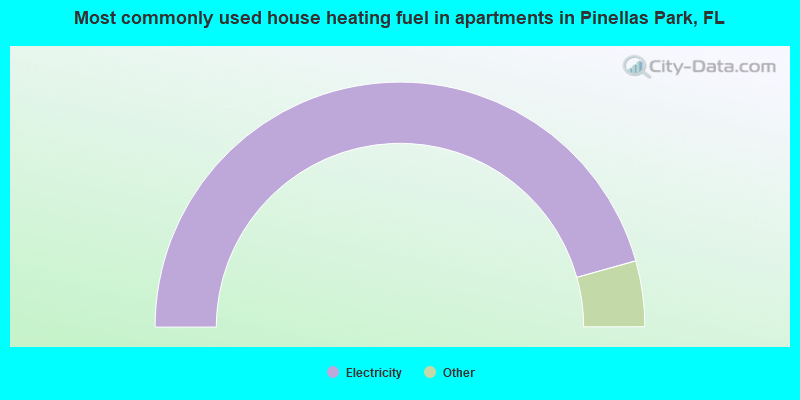
- 91.3%Electricity
- 3.4%Utility gas
- 3.2%No fuel used
- 1.8%Bottled, tank, or LP gas
- 0.3%Other fuel
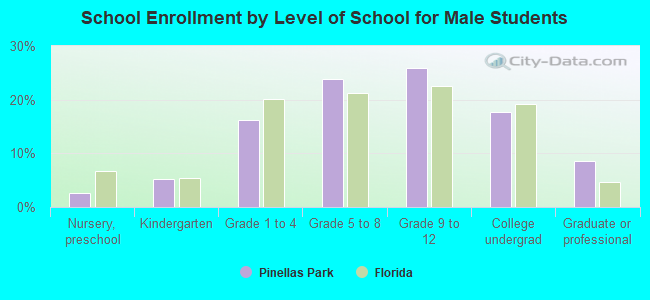
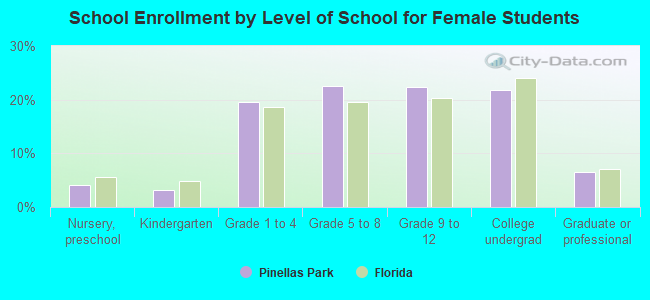
Private vs. public school enrollment:
| Here: | 15.4% |
| Florida: | 15.8% |
| Here: | 8.8% |
| Florida: | 12.9% |
| Here: | 19.0% |
| Florida: | 23.6% |