Pine Hills, FL (Florida) Houses and Residents
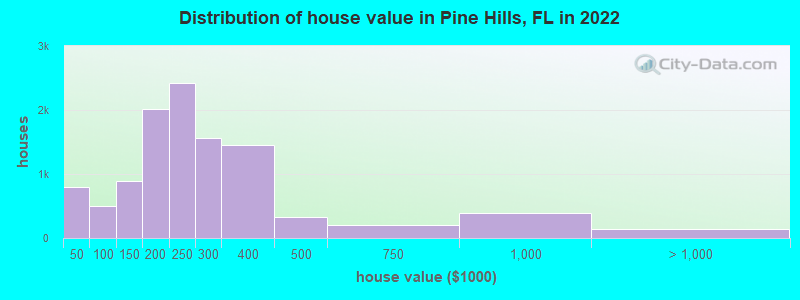
Estimated median house or condo value in 2022: $246,800 (it was $78,800 in 2000 )
Pine Hills:
$246,800Florida:
$354,100
Lower value quartile - upper value quartile: $182,100 - $344,400Mean price in 2022: Detached houses: $219,841 Here:
$219,841State:
$500,941
Townhouses or other attached units: $147,682 Here:
$147,682State:
$370,869
In 3-to-4-unit structures: $104,306 Here:
$104,306State:
$309,944
In 5-or-more-unit structures: $245,108 Here:
$245,108State:
$447,145
Mobile homes: $111,304 Here:
$111,304State:
$113,202
Total population: 60,076 (Urban population: 41,985, Rural population: 0)
Houses: 24,533 (24,183 occupied: 13,342 owner occupied, 10,841 renter occupied )
% of renters here:
45%State:
33%
Housing density: 3,194 houses/condos per square mile
Median price asked for vacant for-sale houses and condos in 2022: $308,333.
Median contract rent in 2022: $1,150 (lower quartile is $945, upper quartile is $1,466)
Median rent asked for vacant for-rent units in 2022: $1,074
Median gross rent in Pine Hills, FL in 2022: $1,395
Housing units in Pine Hills with a mortgage: 9,767 (811 second mortgage, 15 home equity loan, 479 both second mortgage and home equity loan )Houses without a mortgage: 423
Median household income for houses/condos with a mortgage: $54,124
Median household income for apartments without a mortgage: $46,504
Median monthly housing costs: $1,312
Data:
Median house or condo value ($)
Median house or condo value ($ change since 2000)
Median house or condo value ($) - White
Median house or condo value ($) - Black or African American
Median house or condo value ($) - Asian
Median house or condo value ($) - Hispanic or Latino
Median house or condo value ($) - American Indian and Alaska Native
Median house or condo value ($) - Multirace
Median house or condo value ($) - Other Race
Median price asked for mobile homes ($)
Household density (households per square mile)
Mean house or condo value by units in structure - 1, detached ($)
Mean house or condo value by units in structure - 1, attached ($)
Mean house or condo value by units in structure - 2 ($)
Mean house or condo value by units in structure by units in structure - 3 or 4 ($)
Mean house or condo value by units in structure - 5 or more ($)
Mean house or condo value by units in structure - Boat, RV, van, etc. ($)
Mean house or condo value by units in structure - Mobile home ($)
Median contract rent ($)
Median contract rent - Lower quartile ($)
Median contract rent - Upper quartile ($)
Median gross rent ($)
Urban houses (%)
Rural houses (%)
Houses occupied (%)
Houses occupied (% change since 2000)
Houses owner occupied (%)
Houses owner occupied (% change since 2000)
Houses renter occupied (%)
Houses renter occupied (% change since 2000)
Vacant housing units - For rent (%)
Vacant housing units - For rent (% change since 2000)
Vacant housing units - For sale only (%)
Vacant housing units - For sale only (% change since 2000)
Vacant housing units - Rented or sold, not occupied (%)
Vacant housing units - Rented or sold, not occupied (% change since 2000)
Vacant housing units - For seasonal, recreational, or occasional use (%)
Vacant housing units - For seasonal, recreational, or occasional use (% change since 2000)
Vacant housing units - For migrant workers (%)
Vacant housing units - For migrant workers (% change since 2000)
Vacant housing units - Other vacant (%)
Vacant housing units - Other vacant (% change since 2000)
Median monthly housing costs ($)
Median household income for houses/condos with a mortgage ($)
Median household income for houses/condos without a mortgage ($)
Median household income ($)
Median household income ($) - White
Median household income ($) - Black or African American
Median household income ($) - Asian
Median household income ($) - Hispanic or Latino
Median household income ($) - American Indian and Alaska Native
Median household income ($) - Multirace
Median household income ($) - Other Race
Mortgage status - with mortgage (%)
Mortgage status - with second mortgage (%)
Mortgage status - with home equity loan (%)
Mortgage status - with both second mortgage and home equity loan (%)
Mortgage status - without a mortgage (%)
Median year house/condo built
Median year apartment built
Household type by relationship - Male householder living alone (%)
Household type by relationship - Male householder not living alone (%)
Household type by relationship - Female householder living alone (%)
Household type by relationship - Female householder not living alone (%)
Household type by relationship - Opposite-Sex spouse (%)
Household type by relationship - Same-Sex spouse (%)
Household type by relationship - Opposite-Sex unmarried partner (%)
Household type by relationship - Same-Sex unmarried partner (%)
Household type by relationship - In group quarters (%)
Size of family households - 2-person household (%)
Size of family households - 3-person household (%)
Size of family households - 4-person household (%)
Size of family households - 5-person household (%)
Size of family households - 6-person household (%)
Size of family households - 7-or-more-person household (%)
Size of nonfamily households - 1-person household (%)
Size of nonfamily households - 2-person household (%)
Size of nonfamily households - 3-person household (%)
Size of nonfamily households - 4-person household (%)
Size of nonfamily households - 5-person household (%)
Size of nonfamily households - 6-person household (%)
Size of nonfamily households - 7-or-moreperson household (%)
Year house built - Built 2010 or later (%)
Year house built - Built 2000 to 2009 (%)
Year house built - Built 1990 to 1999 (%)
Year house built - Built 1980 to 1989 (%)
Year house built - Built 1970 to 1979 (%)
Year house built - Built 1960 to 1969 (%)
Year house built - Built 1950 to 1959 (%)
Year house built - Built 1940 to 1949 (%)
Year house built - Built 1939 or earlier (%)
Median number of rooms in houses and condos
Median number of rooms in apartments
Median number of bedrooms in owner occupied houses
Mean number of bedrooms in owner occupied houses
Median number of bedrooms in renter occupied houses
Mean number of bedrooms in renter occupied houses
Median number of vehichles in owner occupied houses
Mean number of vehichles in owner occupied houses
Median number of vehichles in renter occupied houses
Mean number of vehichles in renter occupied houses
Rooms in owner-occupied houses - 1 room (%)
Rooms in owner-occupied houses - 2 rooms (%)
Rooms in owner-occupied houses - 3 rooms (%)
Rooms in owner-occupied houses - 4 rooms (%)
Rooms in owner-occupied houses - 5 rooms (%)
Rooms in owner-occupied houses - 6 rooms (%)
Rooms in owner-occupied houses - 7 rooms (%)
Rooms in owner-occupied houses - 8 rooms (%)
Rooms in owner-occupied houses - 9+ rooms (%)
Rooms in renter-occupied houses - 1 room (%)
Rooms in renter-occupied houses - 2 rooms (%)
Rooms in renter-occupied houses - 3 rooms (%)
Rooms in renter-occupied houses - 4 rooms (%)
Rooms in renter-occupied houses - 5 rooms (%)
Rooms in renter-occupied houses - 6 rooms (%)
Rooms in renter-occupied houses - 7 rooms (%)
Rooms in renter-occupied houses - 8 rooms (%)
Rooms in renter-occupied houses - 9+ rooms (%)
Bedrooms in owner-occupied houses - no bedrooms (%)
Bedrooms in owner-occupied houses - 1 bedroom (%)
Bedrooms in owner-occupied houses - 2 bedrooms (%)
Bedrooms in owner-occupied houses - 3 bedrooms (%)
Bedrooms in owner-occupied houses - 4 bedrooms (%)
Bedrooms in owner-occupied houses - 5+ bedrooms (%)
Bedrooms in renter-occupied houses - no bedrooms (%)
Bedrooms in renter-occupied houses - 1 bedroom (%)
Bedrooms in renter-occupied houses - 2 bedrooms (%)
Bedrooms in renter-occupied houses - 3 bedrooms (%)
Bedrooms in renter-occupied houses - 4 bedrooms (%)
Bedrooms in renter-occupied houses - 5+ bedrooms (%)
Vehicles available in owner-occupied houses - no vehicle available (%)
Vehicles available in owner-occupied houses - 1 vehicle available(%)
Vehicles available in owner-occupied houses - 2 Vehicles available (%)
Vehicles available in owner-occupied houses - 3 Vehicles available (%)
Vehicles available in owner-occupied houses - 4 Vehicles available (%)
Vehicles available in owner-occupied houses - 5+ Vehicles available (%)
Vehicles available in renter-occupied houses - no vehicle available (%)
Vehicles available in renter-occupied houses - 1 vehicle available (%)
Vehicles available in renter-occupied houses - 2 Vehicles available (%)
Vehicles available in renter-occupied houses - 3 Vehicles available (%)
Vehicles available in renter-occupied houses - 4 Vehicles available (%)
Vehicles available in renter-occupied houses - 5+ Vehicles available (%)
Housing units in structures - 1, detached (%)
Housing units in structures - 1, attached (%)
Housing units in structures - 2 (%)
Housing units in structures - 3 or 4 (%)
Housing units in structures - 5 to 9 (%)
Housing units in structures - 10 to 19 (%)
Housing units in structures - 20 to 49 (%)
Housing units in structures - 50 or more (%)
Housing units in structures - Mobile home (%)
Housing units in structures - Boat, RV, van, etc. (%)
Housing units in structures - Owners - 1, detached (%)
Housing units in structures - Owners - 1, attached (%)
Housing units in structures - Owners - 2 (%)
Housing units in structures - Owners - 3 or 4 (%)
Housing units in structures - Owners - 5 to 9 (%)
Housing units in structures - Owners - 10 to 19 (%)
Housing units in structures - Owners - 20 to 49 (%)
Housing units in structures - Owners - 50 or more (%)
Housing units in structures - Owners - Mobile home (%)
Housing units in structures - Owners - Boat, RV, van, etc. (%)
Housing units in structures - Renters - 1, detached (%)
Housing units in structures - Renters - 1, attached (%)
Housing units in structures - Renters - 2 (%)
Housing units in structures - Renters - 3 or 4 (%)
Housing units in structures - Renters - 5 to 9 (%)
Housing units in structures - Renters - 10 to 19 (%)
Housing units in structures - Renters - 20 to 49 (%)
Housing units in structures - Renters - 50 or more (%)
Housing units in structures - Renters - Mobile home (%)
Housing units in structures - Renters - Boat, RV, van, etc. (%)
House/condo owner moved in on average (years ago)
Renter moved in on average (years ago)
Year householder moved into unit - Moved in 1999 to March 2000 (%)
Year householder moved into unit - Moved in 1999 to March 2000 (%) - White
Year householder moved into unit - Moved in 1999 to March 2000 (%) - Black or African American
Year householder moved into unit - Moved in 1999 to March 2000 (%) - Asian
Year householder moved into unit - Moved in 1999 to March 2000 (%) - Hispanic or Latino
Year householder moved into unit - Moved in 1999 to March 2000 (%) - American Indian and Alaska Native
Year householder moved into unit - Moved in 1999 to March 2000 (%) - Multirace
Year householder moved into unit - Moved in 1999 to March 2000 (%) - Other Race
Year householder moved into unit - Moved in 1995 to 1998 (%)
Year householder moved into unit - Moved in 1995 to 1998 (%) - White
Year householder moved into unit - Moved in 1995 to 1998 (%) - Black or African American
Year householder moved into unit - Moved in 1995 to 1998 (%) - Asian
Year householder moved into unit - Moved in 1995 to 1998 (%) - Hispanic or Latino
Year householder moved into unit - Moved in 1995 to 1998 (%) - American Indian and Alaska Native
Year householder moved into unit - Moved in 1995 to 1998 (%) - Multirace
Year householder moved into unit - Moved in 1995 to 1998 (%) - Other Race
Year householder moved into unit - Moved in 1990 to 1994 (%)
Year householder moved into unit - Moved in 1990 to 1994 (%) - White
Year householder moved into unit - Moved in 1990 to 1994 (%) - Black or African American
Year householder moved into unit - Moved in 1990 to 1994 (%) - Asian
Year householder moved into unit - Moved in 1990 to 1994 (%) - Hispanic or Latino
Year householder moved into unit - Moved in 1990 to 1994 (%) - American Indian and Alaska Native
Year householder moved into unit - Moved in 1990 to 1994 (%) - Multirace
Year householder moved into unit - Moved in 1990 to 1994 (%) - Other Race
Year householder moved into unit - Moved in 1980 to 1989 (%)
Year householder moved into unit - Moved in 1980 to 1989 (%) - White
Year householder moved into unit - Moved in 1980 to 1989 (%) - Black or African American
Year householder moved into unit - Moved in 1980 to 1989 (%) - Asian
Year householder moved into unit - Moved in 1980 to 1989 (%) - Hispanic or Latino
Year householder moved into unit - Moved in 1980 to 1989 (%) - American Indian and Alaska Native
Year householder moved into unit - Moved in 1980 to 1989 (%) - Multirace
Year householder moved into unit - Moved in 1980 to 1989 (%) - Other Race
Year householder moved into unit - Moved in 1970 to 1979 (%)
Year householder moved into unit - Moved in 1970 to 1979 (%) - White
Year householder moved into unit - Moved in 1970 to 1979 (%) - Black or African American
Year householder moved into unit - Moved in 1970 to 1979 (%) - Asian
Year householder moved into unit - Moved in 1970 to 1979 (%) - Hispanic or Latino
Year householder moved into unit - Moved in 1970 to 1979 (%) - American Indian and Alaska Native
Year householder moved into unit - Moved in 1970 to 1979 (%) - Multirace
Year householder moved into unit - Moved in 1970 to 1979 (%) - Other Race
Year householder moved into unit - Moved in 1969 or earlier (%)
Year householder moved into unit - Moved in 1969 or earlier (%) - White
Year householder moved into unit - Moved in 1969 or earlier (%) - Black or African American
Year householder moved into unit - Moved in 1969 or earlier (%) - Asian
Year householder moved into unit - Moved in 1969 or earlier (%) - Hispanic or Latino
Year householder moved into unit - Moved in 1969 or earlier (%) - American Indian and Alaska Native
Year householder moved into unit - Moved in 1969 or earlier (%) - Multirace
Year householder moved into unit - Moved in 1969 or earlier (%) - Other Race
Housing units lacking complete plumbing facilities (%)
Housing units lacking complete kitchen facilities (%)
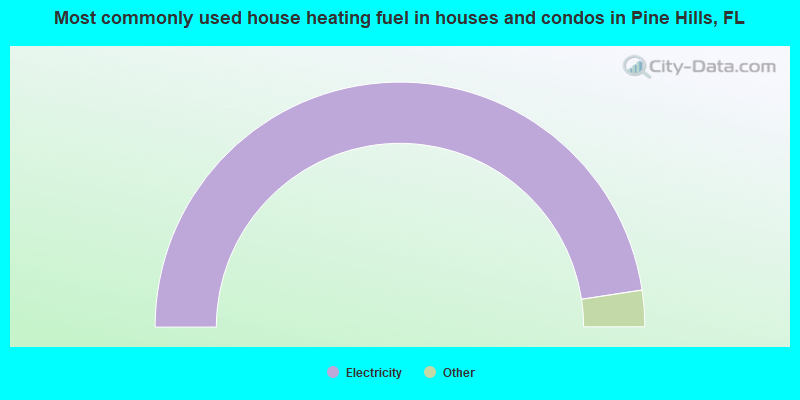
House heating fuel used in houses and condos - Utility gas (%)
House heating fuel used in houses and condos - Bottled, tank, or LP gas (%)
House heating fuel used in houses and condos - Electricity (%)
House heating fuel used in houses and condos - Fuel oil, kerosene, etc. (%)
House heating fuel used in houses and condos - Coal or coke (%)
House heating fuel used in houses and condos - Wood (%)
House heating fuel used in houses and condos - Solar energy (%)
House heating fuel used in houses and condos - Other fuel (%)
House heating fuel used in houses and condos - No fuel used (%)
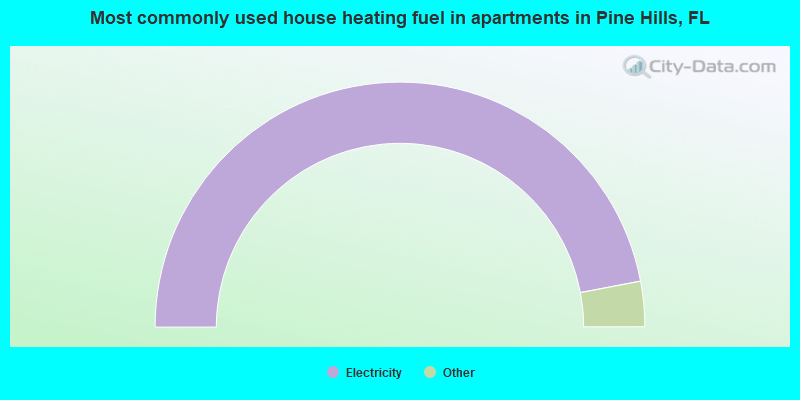
House heating fuel used in apartments - Utility gas (%)
House heating fuel used in apartments - Bottled, tank, or LP gas (%)
House heating fuel used in apartments - Electricity (%)
House heating fuel used in apartments - Fuel oil, kerosene, etc. (%)
House heating fuel used in apartments - Coal or coke (%)
House heating fuel used in apartments - Wood (%)
House heating fuel used in apartments - Solar energy (%)
House heating fuel used in apartments - Other fuel (%)
House heating fuel used in apartments - No fuel used (%)
Median year house/condo built: 1981Median year apartment built: 1975Household type by relationship:
Households: 72,291
Male householders: 9,427 (1,895 living alone ), Female householders: 14,756 (4,430 living alone )8,156 spouses (7,863 opposite-sex spouses ), 1,504 unmarried partners , (1,504 opposite-sex unmarried partners ), 25,595 children (23,757 natural , 576 adopted , 1,262 stepchildren ), 3,784 grandchildren , 2,535 brothers or sisters , 1,010 parents , 0 foster children , 2,985 other relatives , 2,179 non-relatives In group quarters: 360
Size of family households: 4,829 2-persons , 3,953 3-persons , 3,875 4-persons , 2,788 5-persons , 668 6-persons , 777 7-or-more-persons .
Size of nonfamily households: 6,325 1-person , 442 2-persons , 356 3-persons , 170 4-persons .
8,638 married couples with children. single-parent households (2,354 men , 7,191 women ).
63.3% of residents of Pine Hills speak English at home. of residents speak Spanish at home (49% speak English very well , 19% speak English well , 18% speak English not well , 14% don't speak English at all ).of residents speak other Indo-European language at home (63% speak English very well , 19% speak English well , 14% speak English not well , 5% don't speak English at all ).of residents speak Asian or Pacific Island language at home (31% speak English very well , 23% speak English well , 43% speak English not well , 2% don't speak English at all ).of residents speak other language at home (94% speak English very well , 6% speak English not well ).
Foreign born population: 25,928 (35.9%)of them are naturalized citizens )
Median number of rooms in houses and condos:
Median number of rooms in apartments
Owner-occupied Renter-occupied
Rooms in owner-occupied houses in Pine Hills, Florida
0 1 room 0 2 rooms 154 3 rooms 963 4 rooms 2,240 5 rooms 3,829 6 rooms 3,200 7 rooms 1,862 8 rooms 1,094 9+ rooms
Rooms in renter-occupied apartments in Pine Hills, Florida
348 1 room 367 2 rooms 2,219 3 rooms 1,362 4 rooms 1,572 5 rooms 2,238 6 rooms 1,428 7 rooms 751 8 rooms 556 9+ rooms
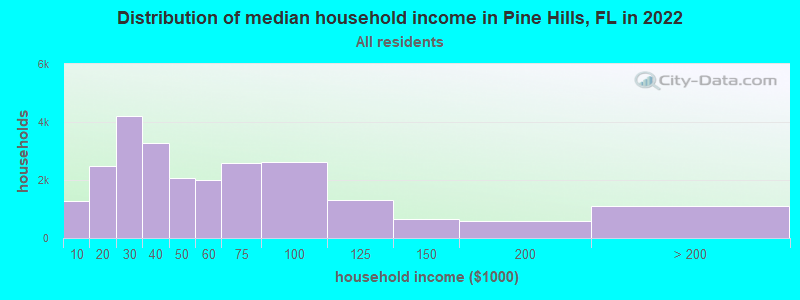
Pine Hills, FL household income distribution 1,282 Less than $10,0002,498 $10,000 to $19,9994,197 $20,000 to $29,9993,260 $30,000 to $39,9992,075 $40,000 to $49,9991,999 $50,000 to $59,9992,584 $60,000 to $74,9992,619 $75,000 to $99,9991,321 $100,000 to $124,999657 $125,000 to $149,999603 $150,000 to $199,9991,088 $200,000 or more
Home value of owner - occupied houses in 2022 in Pine Hills, FL 248 Less than $10,00097 $10,000 to $14,99973 $15,000 to $19,999116 $20,000 to $24,999105 $25,000 to $29,99925 $30,000 to $34,999104 $35,000 to $39,99928 $40,000 to $49,99976 $50,000 to $59,99996 $60,000 to $69,999152 $80,000 to $89,999138 $90,000 to $99,999581 $100,000 to $124,999315 $125,000 to $149,999990 $150,000 to $174,9991,023 $175,000 to $199,9992,425 $200,000 to $249,9991,555 $250,000 to $299,9991,447 $300,000 to $399,999324 $400,000 to $499,999203 $500,000 to $749,999389 $750,000 to $999,99924 $1,000,000 to $1,499,99959 $1,500,000 to $1,999,99962 $2,000,000 or moreRent paid by renters in 2022 in Pine Hills, FL 17 $100 to $14994 $200 to $249134 $300 to $34937 $350 to $399172 $400 to $44977 $450 to $499261 $500 to $549108 $550 to $599123 $600 to $649282 $650 to $699696 $700 to $749236 $750 to $799661 $800 to $8991,172 $900 to $9992,604 $1,000 to $1,2491,959 $1,250 to $1,4991,806 $1,500 to $1,999284 $2,000 to $2,499182 No cash rent
Percentage of workers working in this county: 89.6%Number of people working at home: 4,789 (12.7% of all workers )
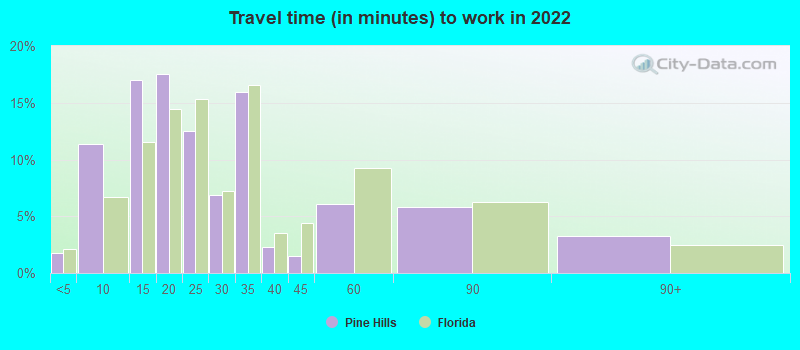
Travel time to work (commute)
Less than 5 minutes: 5075 to 9 minutes: 44010 to 14 minutes: 3,71615 to 19 minutes: 2,49520 to 24 minutes: 6,15825 to 29 minutes: 2,14430 to 34 minutes: 5,58035 to 39 minutes: 1,01040 to 44 minutes: 96745 to 59 minutes: 2,01960 to 89 minutes: 1,15190 or more minutes: 823
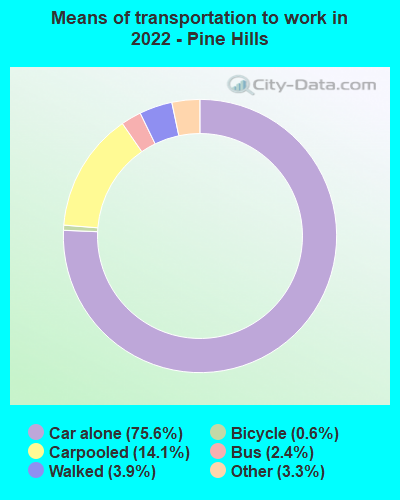
Means of transportation to work:
Drove a car alone: 5,426 (49.5%)Carpooled: 1,071 (9.8%)Bus : 189 (1.7%)Taxi: 253 (2.3%)Bicycle: 32 (0.3%)Walked: 374 (3.4%)Worked at home: 4,789 (43.7%)
Unemployment by race in 2022
Unemployment rate for White non-Hispanic residents 1.2% Males4.8% FemalesUnemployment rate for Black residents 13.8% Males5.8% FemalesUnemployment rate for Asian residents 3.6% Males12.7% FemalesUnemployment rate for other race residents 2.7% Males2.4% FemalesUnemployment rate for two or more race residents 12.3% Males4.4% FemalesUnemployment rate for Hispanic or Latino residents 7.6% Males10.0% Females
Year of entry for the foreign-born population in Pine Hills, Florida
11,610 2010 or later 5,976 2000 to 2009 4,784 1990 to 1999 3,125 1980 to 1989 1,108 1970 to 1979 685 Before 1970
First ancestries reported:
Haitian: 16,053 (28.8%)
Jamaican: 6,504 (11.7%)
American: 1,786 (3.2%)
Guyanese: 1,478 (2.6%)
African: 1,038 (1.9%)
British West Indian: 583 (1.0%)
West Indian: 454 (0.8%)
Italian: 421 (0.8%)
English: 382 (0.7%)
German: 253 (0.5%)
Nigerian: 218 (0.4%)
Trinidadian and Tobagonian: 218 (0.4%)
European: 196 (0.4%)
Romanian: 183 (0.3%)
Irish: 176 (0.3%)
Brazilian: 101 (0.2%)
French: 75 (0.1%)
Bahamian: 55 (0.10%)
Portuguese: 47 (0.08%)
Polish: 43 (0.08%)
Swedish: 42 (0.08%)
Scotch-Irish: 37 (0.07%)
Scottish: 33 (0.06%)
Slovak: 31 (0.06%)
Canadian: 27 (0.05%)
Finnish: 21 (0.04%)
British: 19 (0.03%)
Eastern European: 13 (0.02%)
Russian: 11 (0.02%)
Austrian: 5 (0.01%)
Welsh: 5 (0.01%)
Dutch: 3 (0.01%)
Greek: 3 (0.01%) Most common places of birth for foreign-born residents (%): Haiti Pine Hills:
48.6% (14,319)Florida:
7.5% (342,375)
Jamaica Pine Hills:
22.1% (6,510)Florida:
5.0% (227,319)
Guyana Pine Hills:
5.5% (1,625)Florida:
0.7% (33,556)
Mexico Pine Hills:
3.0% (888)Florida:
5.6% (257,152)
Dominican Republic Pine Hills:
2.6% (777)Florida:
3.0% (137,727)
Guatemala Pine Hills:
2.5% (735)Florida:
2.1% (97,632)
Vietnam Pine Hills:
2.3% (674)Florida:
1.3% (60,604)
El Salvador Pine Hills:
1.6% (464)Florida:
1.1% (49,838)
Place of birth for U.S.-born residents:
This state: 25,618Other state: 16,949Northeast: 5,883Midwest: 3,021South: 7,674West: 371 83.0% of Pine Hills residents lived in the same house 1 years ago.
Out of people who lived in different houses, 37.8% lived in this county.
Out of people who lived in different counties, 60.4% lived in Florida.
Pine Hills:
83.0%State average:
86.3%
Education attainment for males 25 years and older:
No schooling: 2,198Nursery to 4th grade: 05th and 6th grade: 1047th and 8th grade: 3999th grade: 26410th grade: 32311th grade: 1,21812th grade, no diploma: 687High school graduate (or equivalency): 6,859Less than 1 year of college: 1,328Some college more than 1 year, no degree: 2,164Associate degree: 1,175Bachelor's degree: 2,462Master's degree: 346Professional school degree: 0Doctorate degree: 72
Education attainment for females 25 years and older:
No schooling: 2,334Nursery to 4th grade: 05th and 6th grade: 07th and 8th grade: 1549th grade: 75810th grade: 69911th grade: 69012th grade, no diploma: 932High school graduate (or equivalency): 8,370Less than 1 year of college: 1,923Some college more than 1 year, no degree: 3,549Associate degree: 2,740Bachelor's degree: 2,257Master's degree: 653Professional school degree: 60Doctorate degree: 0
Housing units in structures:
One, detached: 17,566One, attached: 6693 or 4: 8345 to 9: 1,06210 to 19: 3,05120 to 49: 16050 or more: 310Mobile homes: 881Median worth of mobile homes: $19,420
House/condo owner moved in on average 12 years ago
Renter moved in on average 2 years ago
Private vs. public school enrollment:
Students in private schools in grades 1 to 8 (elementary and middle school): 2,532 Students in private schools in grades 9 to 12 (high school): 475 Students in private undergraduate colleges: 1,051