Peachtree City, GA (Georgia) Houses and Residents
| Peachtree City: | $507,242 |
| Georgia: | $297,400 |
Total population: 35,063 (Urban population: 31,516, Rural population: 380 (all nonfarm))
Houses: 16,163 (15,003 occupied: 11,243 owner occupied, 3,853 renter occupied)
| % of renters here: | 26% |
| State: | 34% |
Housing density: 694 houses/condos per square mile
Median price asked for vacant for-sale houses and condos in 2022: $508,519.
Median contract rent in 2022: $1,707 (lower quartile is $1,556, upper quartile is $1,951)
Median rent asked for vacant for-rent units in 2022: $1,990
Median gross rent in Peachtree City, GA in 2022: $1,927
Housing units in Peachtree City with a mortgage: 7,440 (635 second mortgage, 0 home equity loan, 487 both second mortgage and home equity loan)
Houses without a mortgage: 50
Median household income for houses/condos with a mortgage: $162,287
Median household income for apartments without a mortgage: $105,384
Median monthly housing costs: $1,849
Compare current foreclosures near Peachtree City, GA:
| Photo | Address | Area | Beds / Baths | Price | Details |
|---|---|---|---|---|---|

|
#1
Kimmer Rd
Peachtree City, GA 30269
|
2,182 sq. feet
|
2 baths 4 beds |
show details | |

|
#2
Merrick Dr
Peachtree City, GA 30269
|
- sq. feet
|
- baths - beds |
show details | |

|
#3
N Peachtree Pkwy # 223
Peachtree City, GA 30269
|
- sq. feet
|
- baths - beds |
show details | |

|
#4
Elkins Pl
Peachtree City, GA 30269
|
- sq. feet
|
- baths - beds |
show details | |

|
#5
Wood Rdg
Peachtree City, GA 30269
|
1,215 sq. feet
|
- baths - beds |
show details | |

|
#6
Hyacinth Ln
Peachtree City, GA 30269
|
- sq. feet
|
- baths - beds |
show details | |

|
#7
Berrycheck Hl
Peachtree City, GA 30269
|
- sq. feet
|
- baths - beds |
show details | |

|
#8
Stevens Entry Apt J214
Peachtree City, GA 30269
|
- sq. feet
|
- baths - beds |
show details | |

|
#9
Twiggs Cor
Peachtree City, GA 30269
|
1,058 sq. feet
|
- baths - beds |
show details | |

|
#10
Lighthouse Ln
Peachtree City, GA 30269
|
3,167 sq. feet
|
- baths - beds |
show details |
| Photo | Address | Area | Beds / Baths | Price | Details |
|---|---|---|---|---|---|

|
#11
Blue Smoke Trl
Peachtree City, GA 30269
|
2,348 sq. feet
|
- baths - beds |
show details | |

|
#12
Pepperwood Dr
Peachtree City, GA 30269
|
1,750 sq. feet
|
- baths - beds |
show details | |

|
#13
Barberry Ln
Peachtree City, GA 30269
|
- sq. feet
|
- baths - beds |
show details | |

|
#14
Doubletrace Ln
Peachtree City, GA 30269
|
2,070 sq. feet
|
- baths - beds |
show details | |

|
#15
Camden Cope
Peachtree City, GA 30269
|
- sq. feet
|
- baths - beds |
show details | |

|
#16
Hampton Grn
Peachtree City, GA 30269
|
1,916 sq. feet
|
- baths - beds |
show details | |

|
#17
Brookgrove Ln
Peachtree City, GA 30269
|
2,765 sq. feet
|
- baths - beds |
show details | |

|
#18
Kings Ridge Dr
Peachtree City, GA 30269
|
1,250 sq. feet
|
- baths - beds |
show details | |

|
#19
Sweetbriar St
Peachtree City, GA 30269
|
2,022 sq. feet
|
- baths - beds |
show details | |

|
#20
Denham Sq
Peachtree City, GA 30269
|
- sq. feet
|
- baths - beds |
show details |
| Photo | Address | Area | Beds / Baths | Price | Details |
|---|---|---|---|---|---|

|
#21
Edgewater Way
Peachtree City, GA 30269
|
2,175 sq. feet
|
- baths - beds |
show details | |

|
#22
Cloister Dr
Peachtree City, GA 30269
|
3,059 sq. feet
|
- baths - beds |
show details | |

|
#23
Planceer Pl
Peachtree City, GA 30269
|
1,933 sq. feet
|
- baths - beds |
show details | |

|
#24
Long Leaf
Peachtree City, GA 30269
|
- sq. feet
|
- baths - beds |
show details | |

|
#25
Golf View Dr
Peachtree City, GA 30269
|
2,548 sq. feet
|
- baths - beds |
show details | |

|
#26
Merrick Dr
Peachtree City, GA 30269
|
- sq. feet
|
- baths - beds |
show details | |

|
#27
Stevens Entry, Apt E
Peachtree City, GA 30269
|
- sq. feet
|
- baths - beds |
show details | |

|
#28
Blacktop Ct
Fairburn, GA 30213
|
3,244 sq. feet
|
3 baths 5 beds |
$326,900
|
show details |

|
#29
Saint David St
Fairburn, GA 30213
|
1,855 sq. feet
|
2 baths 3 beds |
show details | |

|
#30
Bigwood Trl
Atlanta, GA 30349
|
1,856 sq. feet
|
2 baths 3 beds |
show details |
| Photo | Address | Area | Beds / Baths | Price | Details |
|---|---|---|---|---|---|

|
#31
Dunmoreland Ter
Atlanta, GA 30349
|
1,269 sq. feet
|
1 baths 3 beds |
show details | |

|
#32
Partridge Pt
Fayetteville, GA 30215
|
1,916 sq. feet
|
2 baths 4 beds |
show details | |

|
#33
Macedonia Rd
Newnan, GA 30263
|
1,998 sq. feet
|
2 baths 3 beds |
show details | |

|
#34
Kon Tiki Ln
Jonesboro, GA 30236
|
1,818 sq. feet
|
2 baths 4 beds |
show details | |

|
#35
Paul Ct
Riverdale, GA 30274
|
1,275 sq. feet
|
2 baths 3 beds |
show details | |

|
#36
Seminole Rd
Jonesboro, GA 30236
|
2,086 sq. feet
|
2 baths 4 beds |
show details | |

|
#37
Hastings Manor Ln
Hampton, GA 30228
|
2,208 sq. feet
|
1 baths 4 beds |
show details | |

|
#38
Devon Chase Rd
Atlanta, GA 30349
|
2,098 sq. feet
|
2 baths 3 beds |
show details | |

|
#39
Granada Dr
Atlanta, GA 30349
|
2,994 sq. feet
|
3 baths 4 beds |
show details | |

|
#40
Peridot Pl
Atlanta, GA 30349
|
1,450 sq. feet
|
2 baths 3 beds |
show details |
| Photo | Address | Area | Beds / Baths | Price | Details |
|---|---|---|---|---|---|

|
#41
Alveston Dr
Atlanta, GA 30349
|
2,364 sq. feet
|
2 baths 4 beds |
show details | |

|
#42
Creel Rd
Atlanta, GA 30349
|
1,820 sq. feet
|
3 baths 3 beds |
show details | |

|
#43
Redona Dr
Atlanta, GA 30349
|
1,797 sq. feet
|
2 baths 3 beds |
show details | |

|
#44
Glenridge Dr
Newnan, GA 30265
|
3,156 sq. feet
|
3 baths 4 beds |
show details | |

|
#45
Hightower Trl
Riverdale, GA 30274
|
2,768 sq. feet
|
3 baths 4 beds |
show details | |

|
#46
Winona Dr
Fayetteville, GA 30214
|
1,123 sq. feet
|
2 baths 3 beds |
show details | |

|
#47
Old Fig Ln
Fairburn, GA 30213
|
4,429 sq. feet
|
4 baths 5 beds |
show details | |

|
#48
Lilfield Lane
Atlanta, GA 30349
|
- sq. feet
|
3 baths 4 beds |
show details | |

|
#49
Graywind Trl
Atlanta, GA 30349
|
3,089 sq. feet
|
4 baths 4 beds |
show details | |

|
Check over 1 million property listings on Foreclosure.com!
|
browse all offers | |||


 | New England to Peachtree City (39 replies) |
| Hoschton vs Peachtree City (3 replies) |
| Finding rental homes in Peachtree City, Georgia (4 replies) |
| Realtor.com: Peachtree City among the nation's 11 best family friendly suburbs (4 replies) |
| Home buying in Atlanta discouraging... (101 replies) |
| Peachtree City lower end homes? (20 replies) |

Median year apartment built: 2000
Household type by relationship:
Households: 39,306- Male householders: 8,374 (1,251 living alone), Female householders: 6,563 (1,968 living alone)
9,651 spouses (9,506 opposite-sex spouses), 262 unmarried partners, (199 opposite-sex unmarried partners), 12,028 children (11,588 natural, 251 adopted, 188 stepchildren), 469 grandchildren, 215 brothers or sisters, 348 parents, 0 foster children, 395 other relatives, 735 non-relatives
- In group quarters: 260
Size of family households: 5,237 2-persons, 2,552 3-persons, 2,984 4-persons, 464 5-persons, 275 6-persons, 150 7-or-more-persons.
Size of nonfamily households: 2,895 1-person, 583 2-persons, 49 3-persons.
7,104 married couples with children.
2,319 single-parent households (321 men, 1,998 women).
83.3% of residents of Peachtree City speak English at home.
5.8% of residents speak Spanish at home (72% speak English very well, 20% speak English well, 6% speak English not well, 2% don't speak English at all).
5.8% of residents speak other Indo-European language at home (86% speak English very well, 7% speak English well, 7% speak English not well).
4.9% of residents speak Asian or Pacific Island language at home (38% speak English very well, 39% speak English well, 22% speak English not well).
0.5% of residents speak other language at home (17% speak English very well, 49% speak English well, 34% speak English not well).
Foreign born population: 6,143 (15.6%)
(48.2% of them are naturalized citizens)
| Here: | 7.8 |
| State: | 6.8 |
| Here: | 4.4 |
| State: | 4.6 |

- Bedrooms in owner-occupied houses and condos in Peachtree City, Georgia
- 0no bedroom
- 241 bedroom
- 9552 bedrooms
- 3,6803 bedrooms
- 4,5754 bedrooms
- 2,0105+ bedrooms

- Bedrooms in renter-occupied apartments in Peachtree City, Georgia
- 132no bedroom
- 7521 bedroom
- 1,1282 bedrooms
- 1,1723 bedrooms
- 6484 bedrooms
- 215+ bedrooms

- Cars and other vehicles available in Peachtree City in owner-occupied houses/condos
- 384no vehicle
- 2,2481 vehicle
- 5,1672 vehicles
- 2,5093 vehicles
- 6404 vehicles
- 2965+ vehicles

- Cars and other vehicles available in Peachtree City in renter-occupied apartments
- 467no vehicle
- 1,8631 vehicle
- 1,2502 vehicles
- 1983 vehicles
- 604 vehicles
- 165+ vehicles

- Rooms in owner-occupied houses in Peachtree City, Georgia
- 01 room
- 242 rooms
- 333 rooms
- 4354 rooms
- 1,1525 rooms
- 1,6266 rooms
- 1,6137 rooms
- 1,9258 rooms
- 4,4369+ rooms

- Rooms in renter-occupied apartments in Peachtree City, Georgia
- 1321 room
- 2202 rooms
- 5183 rooms
- 6204 rooms
- 9975 rooms
- 3586 rooms
- 5677 rooms
- 2728 rooms
- 1699+ rooms


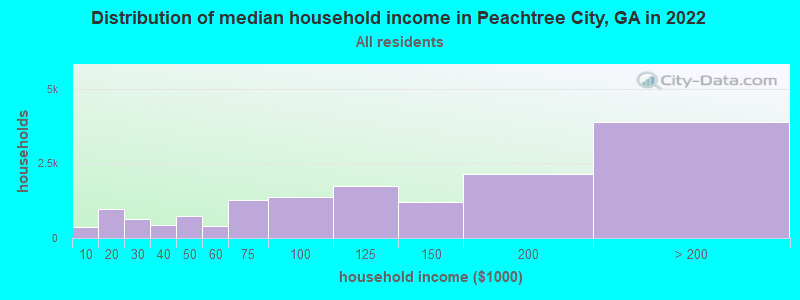
Peachtree City, GA household income distribution

- 359Less than $10,000
- 985$10,000 to $19,999
- 625$20,000 to $29,999
- 422$30,000 to $39,999
- 746$40,000 to $49,999
- 401$50,000 to $59,999
- 1,267$60,000 to $74,999
- 1,388$75,000 to $99,999
- 1,748$100,000 to $124,999
- 1,194$125,000 to $149,999
- 2,134$150,000 to $199,999
- 3,888$200,000 or more
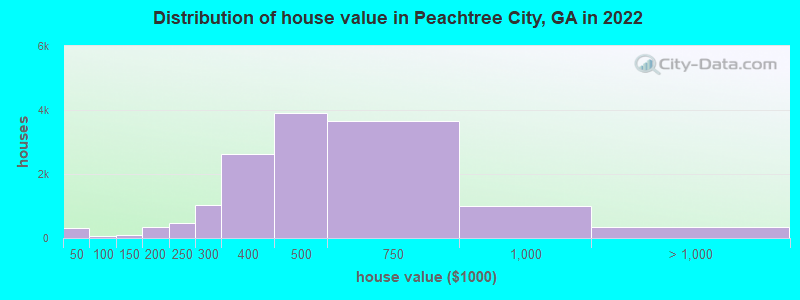
Home value of owner - occupied houses in 2022 in Peachtree City, GA
-
- 112Less than $10,000
- 27$20,000 to $24,999
- 20$25,000 to $29,999
- 132$30,000 to $34,999
- 15$40,000 to $49,999
- 4$50,000 to $59,999
- 15$60,000 to $69,999
- 39$70,000 to $79,999
- 38$100,000 to $124,999
- 42$125,000 to $149,999
- 225$150,000 to $174,999
- 105$175,000 to $199,999
- 473$200,000 to $249,999
- 1,034$250,000 to $299,999
- 2,620$300,000 to $399,999
- 3,906$400,000 to $499,999
- 3,650$500,000 to $749,999
- 1,000$750,000 to $999,999
- 269$1,000,000 to $1,499,999
- 36$1,500,000 to $1,999,999
- 28$2,000,000 or more
Rent paid by renters in 2022 in Peachtree City, GA
-
- 41$150 to $199
- 27$300 to $349
- 13$350 to $399
- 98$650 to $699
- 84$800 to $899
- 100$900 to $999
- 282$1,000 to $1,249
- 693$1,250 to $1,499
- 2,197$1,500 to $1,999
- 433$2,000 to $2,499
- 187$2,500 to $2,999
- 60$3,000 to $3,499
- 119$3,500 or more
- 34No cash rent


Percentage of workers working in this county: 57.1%
Number of people working at home: 5,171 (29.1% of all workers)
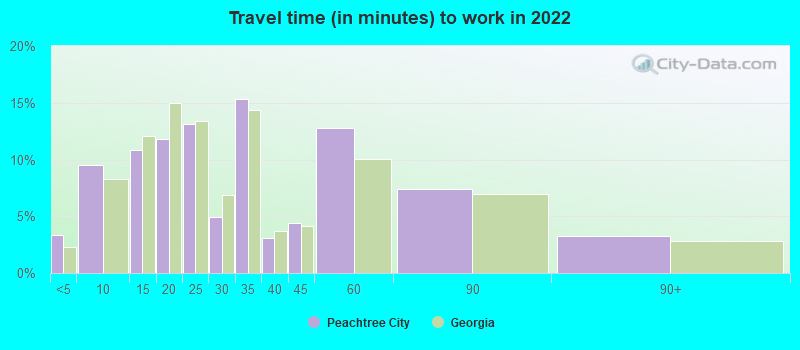
Travel time to work (commute)
- Less than 5 minutes: 515
- 5 to 9 minutes: 1,729
- 10 to 14 minutes: 1,358
- 15 to 19 minutes: 1,148
- 20 to 24 minutes: 648
- 25 to 29 minutes: 509
- 30 to 34 minutes: 2,280
- 35 to 39 minutes: 561
- 40 to 44 minutes: 878
- 45 to 59 minutes: 1,864
- 60 to 89 minutes: 1,464
- 90 or more minutes: 277
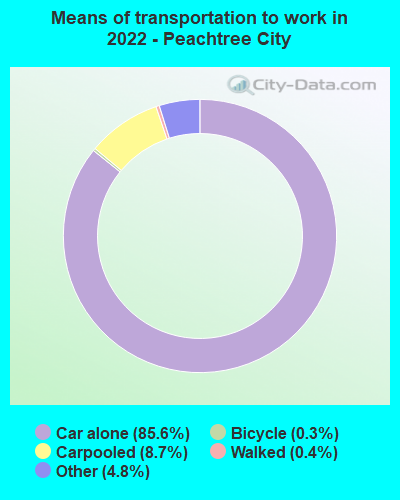
Means of transportation to work:
- Drove a car alone: 18,218 (69.4%)
- Carpooled: 1,937 (7.4%)
- Bus: 13 (0.0%)
- Long-distance train or commuter rail: 6 (0.0%)
- Light rail, streetcar or trolley: 19 (0.1%)
- Taxi: 1,072 (4.1%)
- Bicycle: 66 (0.3%)
- Walked: 91 (0.3%)
- Worked at home: 5,171 (19.7%)

- Unemployment by race in 2022
- Unemployment rate for White non-Hispanic residents
- 1.4%Males
- 6.6%Females
- Unemployment rate for Black residents
- 3.5%Males
- 18.8%Females
- Unemployment rate for Asian residents
- 11.5%Females
- Unemployment rate for other race residents
- 1.3%Females
- Unemployment rate for two or more race residents
- 1.9%Females
- Unemployment rate for Hispanic or Latino residents
- 0.8%Males
- 1.9%Females

- Year of entry for the foreign-born population in Peachtree City, Georgia
- 3,0742010 or later
- 1,1912000 to 2009
- 9271990 to 1999
- 4281980 to 1989
- 2631970 to 1979
- 480Before 1970

First ancestries reported:
- English: 2,798 (14.8%)
- American: 1,435 (7.6%)
- German: 1,283 (6.8%)
- Irish: 1,223 (6.5%)
- European: 961 (5.1%)
- Italian: 563 (3.0%)
- Albanian: 483 (2.6%)
- Nigerian: 300 (1.6%)
- Scottish: 265 (1.4%)
- Norwegian: 260 (1.4%)
- Dutch: 219 (1.2%)
- Polish: 188 (1.0%)
- Hungarian: 164 (0.9%)
- French: 131 (0.7%)
- British: 128 (0.7%)
- Northern European: 128 (0.7%)
- Swedish: 124 (0.7%)
- Scotch-Irish: 114 (0.6%)
- South African: 97 (0.5%)
- African: 86 (0.5%)
- Jamaican: 79 (0.4%)
- Scandinavian: 71 (0.4%)
- Czech: 59 (0.3%)
- Zimbabwean: 55 (0.3%)
- Eastern European: 51 (0.3%)
- Slovak: 44 (0.2%)
- Belgian: 29 (0.2%)
- Ukrainian: 28 (0.1%)
- Trinidadian and Tobagonian: 28 (0.1%)
- Greek: 23 (0.1%)
- Egyptian: 18 (0.10%)
- Iranian: 18 (0.10%)
- Welsh: 17 (0.09%)
- Russian: 16 (0.08%)
- French Canadian: 16 (0.08%)
- Danish: 14 (0.07%)
- Portuguese: 13 (0.07%)
- Canadian: 12 (0.06%)
- Cajun: 11 (0.06%)
- Austrian: 11 (0.06%)
- Latvian: 11 (0.06%)
- Romanian: 10 (0.05%)
- Brazilian: 8 (0.04%)
- Slavic: 5 (0.03%)
Most common places of birth for foreign-born residents (%):
| Peachtree City: | 17.4% (1,051) |
| Georgia: | 9.2% (103,325) |
| Peachtree City: | 13.5% (818) |
| Georgia: | 3.9% (43,756) |
| Peachtree City: | 5.1% (307) |
| Georgia: | 0.2% (2,103) |
| Peachtree City: | 4.6% (275) |
| Georgia: | 0.7% (7,969) |
| Peachtree City: | 4.3% (257) |
| Georgia: | 2.5% (27,846) |
| Peachtree City: | 4.0% (239) |
| Georgia: | 20.0% (223,400) |
| Peachtree City: | 3.7% (222) |
| Georgia: | 2.1% (23,500) |
| Peachtree City: | 3.5% (209) |
| Georgia: | 1.8% (20,700) |
| Peachtree City: | 3.2% (194) |
| Georgia: | 1.6% (17,851) |
| Peachtree City: | 2.7% (161) |
| Georgia: | 1.7% (18,651) |
| Peachtree City: | 2.6% (155) |
| Georgia: | 3.5% (39,227) |
| Peachtree City: | 2.4% (143) |
| Georgia: | 0.5% (6,116) |
| Peachtree City: | 2.0% (123) |
| Georgia: | 1.6% (18,211) |
| Peachtree City: | 1.9% (115) |
| Georgia: | 0.8% (9,101) |
| Peachtree City: | 1.9% (114) |
| Georgia: | 0.3% (3,179) |
| Peachtree City: | 1.7% (102) |
| Georgia: | 1.7% (19,012) |
| Peachtree City: | 1.7% (101) |
| Georgia: | 0.8% (8,613) |
| Peachtree City: | 1.7% (100) |
| Georgia: | 4.6% (51,270) |
| Peachtree City: | 1.6% (94) |
| Georgia: | 0.7% (7,441) |
Place of birth for U.S.-born residents:
- This state: 9,420
- Other state: 23,664
- Northeast: 4,771
- Midwest: 6,986
- South: 9,693
- West: 2,267
87.4% of Peachtree City residents lived in the same house 1 years ago.
Out of people who lived in different houses, 19.0% lived in this county.
Out of people who lived in different counties, 34.6% lived in Georgia.
| Peachtree City: | 87.4% |
| State average: | 86.6% |
Education attainment for males 25 years and older:
- No schooling: 7
- Nursery to 4th grade: 0
- 5th and 6th grade: 19
- 7th and 8th grade: 0
- 9th grade: 0
- 10th grade: 26
- 11th grade: 12
- 12th grade, no diploma: 233
- High school graduate (or equivalency): 1,417
- Less than 1 year of college: 438
- Some college more than 1 year, no degree: 1,539
- Associate degree: 893
- Bachelor's degree: 4,690
- Master's degree: 2,923
- Professional school degree: 354
- Doctorate degree: 476

Education attainment for females 25 years and older:
- No schooling: 85
- Nursery to 4th grade: 8
- 5th and 6th grade: 20
- 7th and 8th grade: 71
- 9th grade: 14
- 10th grade: 65
- 11th grade: 20
- 12th grade, no diploma: 186
- High school graduate (or equivalency): 2,290
- Less than 1 year of college: 458
- Some college more than 1 year, no degree: 1,881
- Associate degree: 1,030
- Bachelor's degree: 5,084
- Master's degree: 2,557
- Professional school degree: 403
- Doctorate degree: 203


Housing units in structures:
- One, detached: 12,690
- One, attached: 716
- Two: 140
- 3 or 4: 99
- 5 to 9: 608
- 10 to 19: 700
- 20 to 49: 271
- 50 or more: 869
- Mobile homes: 50
- Boats, RVs, vans, etc.: 15
Housing units lacking complete kitchen facilities in 2022: 1.1%
House/condo owner moved in on average 8 years ago
Renter moved in on average 1 years ago

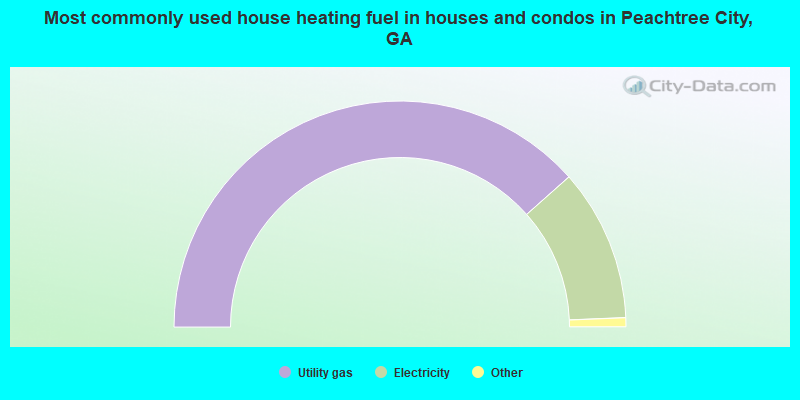
- 76.8%Utility gas
- 21.8%Electricity
- 0.8%Bottled, tank, or LP gas
- 0.4%No fuel used
- 0.1%Fuel oil, kerosene, etc.
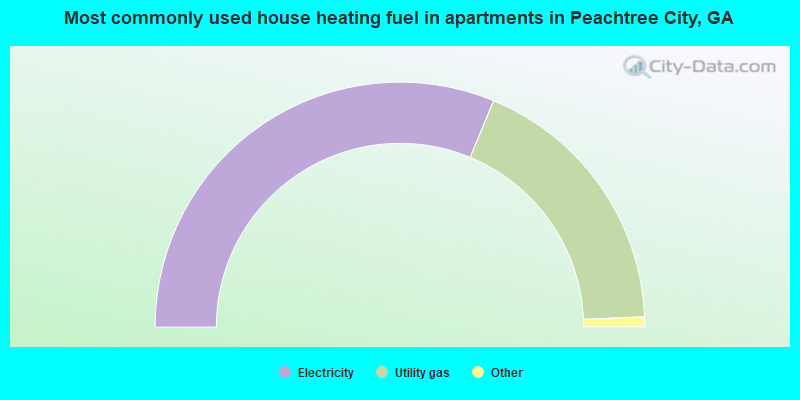
- 62.5%Electricity
- 36.2%Utility gas
- 0.9%Bottled, tank, or LP gas
- 0.4%No fuel used
Private vs. public school enrollment:
| Here: | 9.6% |
| Georgia: | 12.1% |
| Here: | 4.1% |
| Georgia: | 10.8% |
| Here: | 16.4% |
| Georgia: | 17.1% |


