Ojus, FL (Florida) Houses and Residents
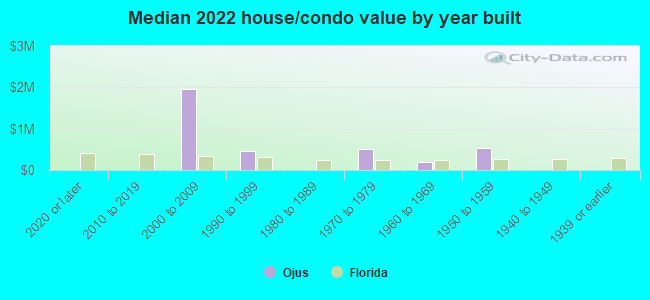
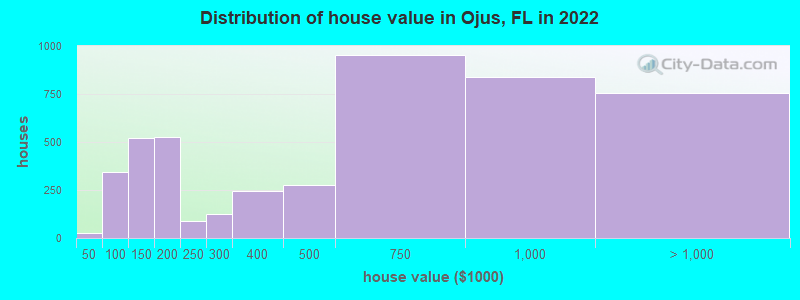
Estimated median house or condo value in 2022: $337,340 (it was $59,100 in 2000 )
Ojus:
$337,340Florida:
$354,100
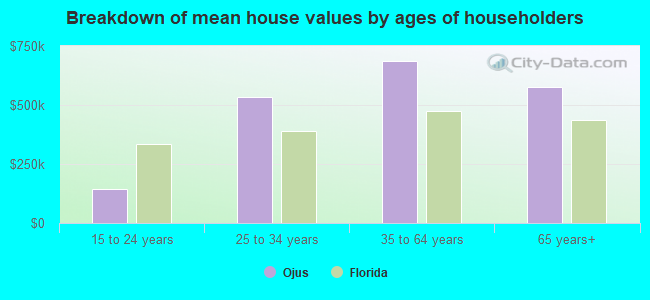
Lower value quartile - upper value quartile: $163,126 - $883,217Mean price in 2022: Detached houses: $1,066,551 Here:
$1,066,551State:
$500,941
Townhouses or other attached units: $866,150 Here:
$866,150State:
$370,869
In 2-unit structures: $1,370,073 Here:
$1,370,073State:
$423,188
In 3-to-4-unit structures: $344,350 Here:
$344,350State:
$309,944
In 5-or-more-unit structures: $171,974 Here:
$171,974State:
$447,145
Mobile homes: $276,078 Here:
$276,078State:
$113,202
Total population: 18,036 (Urban population: 16,682, Rural population: 0)
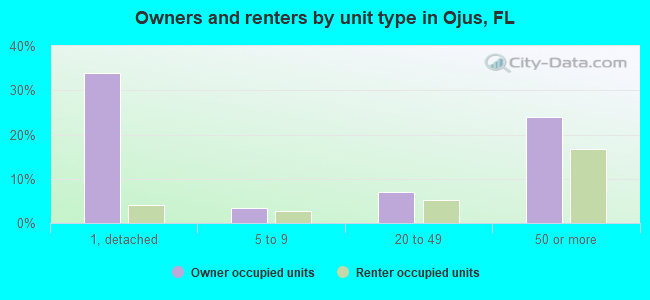
Houses: 8,375 (6,974 occupied: 4,845 owner occupied, 2,221 renter occupied )
% of renters here:
31%State:
33%
Housing density: 3,006 houses/condos per square mile
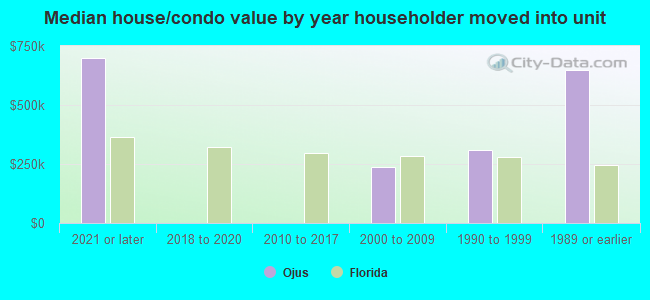
Median price asked for vacant for-sale houses and condos in 2022: $634,709.
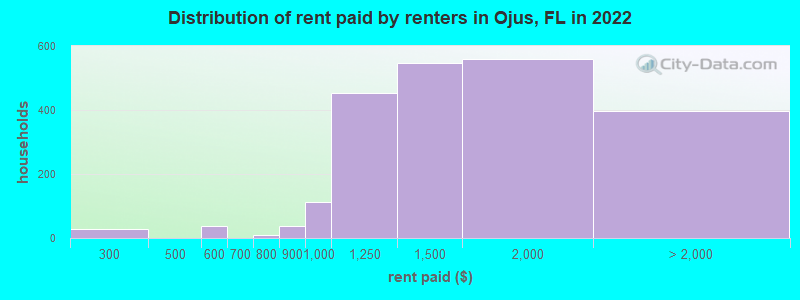
Median contract rent in 2022: $1,462 (lower quartile is $1,191, upper quartile is $1,844)
Median rent asked for vacant for-rent units in 2022: $2,129
Median gross rent in Ojus, FL in 2022: $1,489
Housing units in Ojus with a mortgage: 2,836 (281 second mortgage, 0 home equity loan, 271 both second mortgage and home equity loan )Houses without a mortgage: 257
Median household income for houses/condos with a mortgage: $91,910
Median household income for apartments without a mortgage: $52,912
Median monthly housing costs: $1,452
Data:
Median house or condo value ($)
Median house or condo value ($ change since 2000)
Median house or condo value ($) - White
Median house or condo value ($) - Black or African American
Median house or condo value ($) - Asian
Median house or condo value ($) - Hispanic or Latino
Median house or condo value ($) - American Indian and Alaska Native
Median house or condo value ($) - Multirace
Median house or condo value ($) - Other Race
Median price asked for mobile homes ($)
Household density (households per square mile)
Mean house or condo value by units in structure - 1, detached ($)
Mean house or condo value by units in structure - 1, attached ($)
Mean house or condo value by units in structure - 2 ($)
Mean house or condo value by units in structure by units in structure - 3 or 4 ($)
Mean house or condo value by units in structure - 5 or more ($)
Mean house or condo value by units in structure - Boat, RV, van, etc. ($)
Mean house or condo value by units in structure - Mobile home ($)
Median contract rent ($)
Median contract rent - Lower quartile ($)
Median contract rent - Upper quartile ($)
Median gross rent ($)
Urban houses (%)
Rural houses (%)
Houses occupied (%)
Houses occupied (% change since 2000)
Houses owner occupied (%)
Houses owner occupied (% change since 2000)
Houses renter occupied (%)
Houses renter occupied (% change since 2000)
Vacant housing units - For rent (%)
Vacant housing units - For rent (% change since 2000)
Vacant housing units - For sale only (%)
Vacant housing units - For sale only (% change since 2000)
Vacant housing units - Rented or sold, not occupied (%)
Vacant housing units - Rented or sold, not occupied (% change since 2000)
Vacant housing units - For seasonal, recreational, or occasional use (%)
Vacant housing units - For seasonal, recreational, or occasional use (% change since 2000)
Vacant housing units - For migrant workers (%)
Vacant housing units - For migrant workers (% change since 2000)
Vacant housing units - Other vacant (%)
Vacant housing units - Other vacant (% change since 2000)
Median monthly housing costs ($)
Median household income for houses/condos with a mortgage ($)
Median household income for houses/condos without a mortgage ($)
Median household income ($)
Median household income ($) - White
Median household income ($) - Black or African American
Median household income ($) - Asian
Median household income ($) - Hispanic or Latino
Median household income ($) - American Indian and Alaska Native
Median household income ($) - Multirace
Median household income ($) - Other Race
Mortgage status - with mortgage (%)
Mortgage status - with second mortgage (%)
Mortgage status - with home equity loan (%)
Mortgage status - with both second mortgage and home equity loan (%)
Mortgage status - without a mortgage (%)
Median year house/condo built
Median year apartment built
Household type by relationship - Male householder living alone (%)
Household type by relationship - Male householder not living alone (%)
Household type by relationship - Female householder living alone (%)
Household type by relationship - Female householder not living alone (%)
Household type by relationship - Opposite-Sex spouse (%)
Household type by relationship - Same-Sex spouse (%)
Household type by relationship - Opposite-Sex unmarried partner (%)
Household type by relationship - Same-Sex unmarried partner (%)
Household type by relationship - In group quarters (%)
Size of family households - 2-person household (%)
Size of family households - 3-person household (%)
Size of family households - 4-person household (%)
Size of family households - 5-person household (%)
Size of family households - 6-person household (%)
Size of family households - 7-or-more-person household (%)
Size of nonfamily households - 1-person household (%)
Size of nonfamily households - 2-person household (%)
Size of nonfamily households - 3-person household (%)
Size of nonfamily households - 4-person household (%)
Size of nonfamily households - 5-person household (%)
Size of nonfamily households - 6-person household (%)
Size of nonfamily households - 7-or-moreperson household (%)
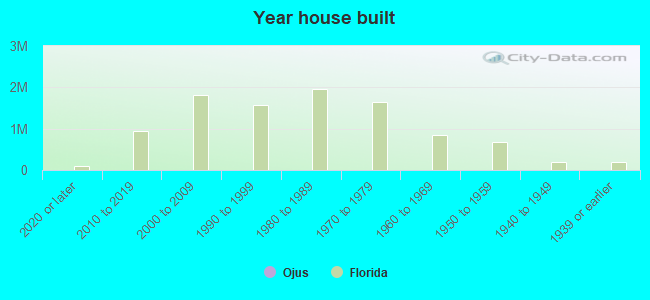
Year house built - Built 2010 or later (%)
Year house built - Built 2000 to 2009 (%)
Year house built - Built 1990 to 1999 (%)
Year house built - Built 1980 to 1989 (%)
Year house built - Built 1970 to 1979 (%)
Year house built - Built 1960 to 1969 (%)
Year house built - Built 1950 to 1959 (%)
Year house built - Built 1940 to 1949 (%)
Year house built - Built 1939 or earlier (%)
Median number of rooms in houses and condos
Median number of rooms in apartments
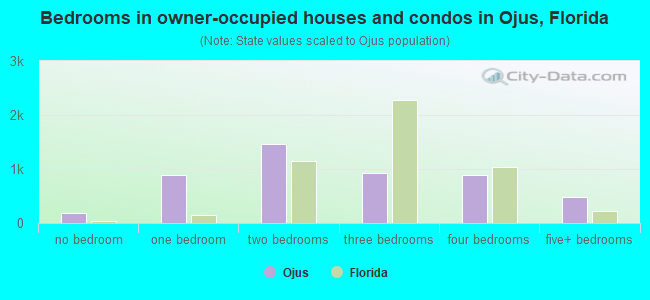
Median number of bedrooms in owner occupied houses
Mean number of bedrooms in owner occupied houses
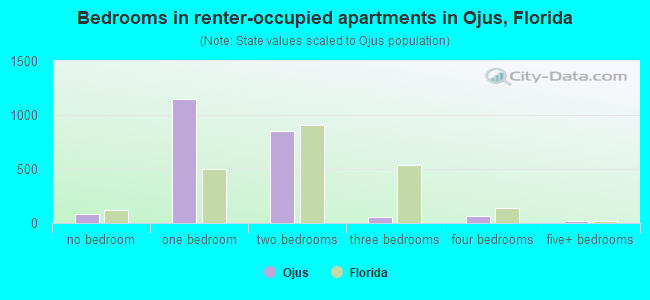
Median number of bedrooms in renter occupied houses
Mean number of bedrooms in renter occupied houses
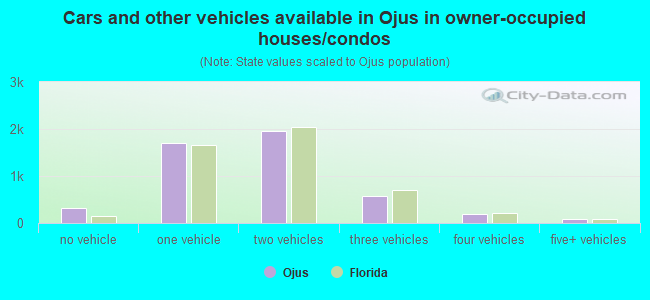
Median number of vehichles in owner occupied houses
Mean number of vehichles in owner occupied houses
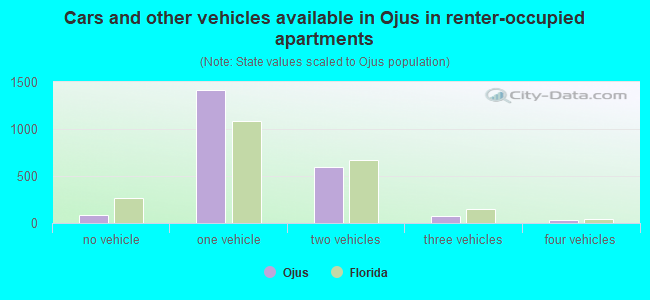
Median number of vehichles in renter occupied houses
Mean number of vehichles in renter occupied houses
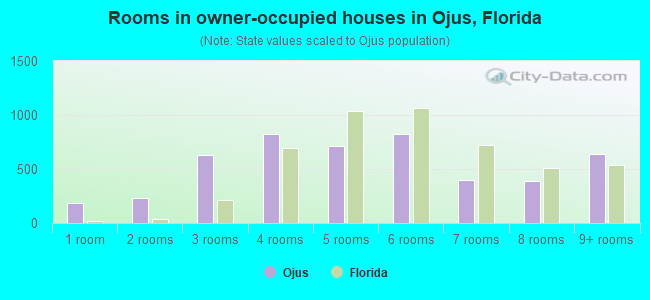
Rooms in owner-occupied houses - 1 room (%)
Rooms in owner-occupied houses - 2 rooms (%)
Rooms in owner-occupied houses - 3 rooms (%)
Rooms in owner-occupied houses - 4 rooms (%)
Rooms in owner-occupied houses - 5 rooms (%)
Rooms in owner-occupied houses - 6 rooms (%)
Rooms in owner-occupied houses - 7 rooms (%)
Rooms in owner-occupied houses - 8 rooms (%)
Rooms in owner-occupied houses - 9+ rooms (%)
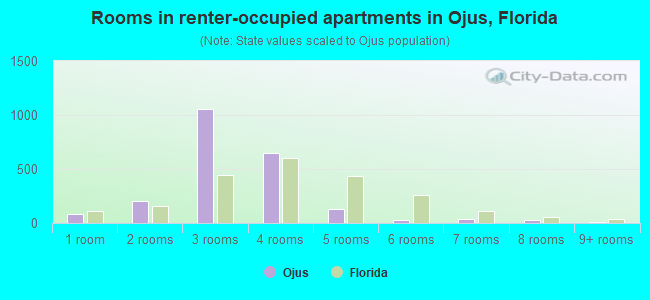
Rooms in renter-occupied houses - 1 room (%)
Rooms in renter-occupied houses - 2 rooms (%)
Rooms in renter-occupied houses - 3 rooms (%)
Rooms in renter-occupied houses - 4 rooms (%)
Rooms in renter-occupied houses - 5 rooms (%)
Rooms in renter-occupied houses - 6 rooms (%)
Rooms in renter-occupied houses - 7 rooms (%)
Rooms in renter-occupied houses - 8 rooms (%)
Rooms in renter-occupied houses - 9+ rooms (%)
Bedrooms in owner-occupied houses - no bedrooms (%)
Bedrooms in owner-occupied houses - 1 bedroom (%)
Bedrooms in owner-occupied houses - 2 bedrooms (%)
Bedrooms in owner-occupied houses - 3 bedrooms (%)
Bedrooms in owner-occupied houses - 4 bedrooms (%)
Bedrooms in owner-occupied houses - 5+ bedrooms (%)
Bedrooms in renter-occupied houses - no bedrooms (%)
Bedrooms in renter-occupied houses - 1 bedroom (%)
Bedrooms in renter-occupied houses - 2 bedrooms (%)
Bedrooms in renter-occupied houses - 3 bedrooms (%)
Bedrooms in renter-occupied houses - 4 bedrooms (%)
Bedrooms in renter-occupied houses - 5+ bedrooms (%)
Vehicles available in owner-occupied houses - no vehicle available (%)
Vehicles available in owner-occupied houses - 1 vehicle available(%)
Vehicles available in owner-occupied houses - 2 Vehicles available (%)
Vehicles available in owner-occupied houses - 3 Vehicles available (%)
Vehicles available in owner-occupied houses - 4 Vehicles available (%)
Vehicles available in owner-occupied houses - 5+ Vehicles available (%)
Vehicles available in renter-occupied houses - no vehicle available (%)
Vehicles available in renter-occupied houses - 1 vehicle available (%)
Vehicles available in renter-occupied houses - 2 Vehicles available (%)
Vehicles available in renter-occupied houses - 3 Vehicles available (%)
Vehicles available in renter-occupied houses - 4 Vehicles available (%)
Vehicles available in renter-occupied houses - 5+ Vehicles available (%)
Housing units in structures - 1, detached (%)
Housing units in structures - 1, attached (%)
Housing units in structures - 2 (%)
Housing units in structures - 3 or 4 (%)
Housing units in structures - 5 to 9 (%)
Housing units in structures - 10 to 19 (%)
Housing units in structures - 20 to 49 (%)
Housing units in structures - 50 or more (%)
Housing units in structures - Mobile home (%)
Housing units in structures - Boat, RV, van, etc. (%)
Housing units in structures - Owners - 1, detached (%)
Housing units in structures - Owners - 1, attached (%)
Housing units in structures - Owners - 2 (%)
Housing units in structures - Owners - 3 or 4 (%)
Housing units in structures - Owners - 5 to 9 (%)
Housing units in structures - Owners - 10 to 19 (%)
Housing units in structures - Owners - 20 to 49 (%)
Housing units in structures - Owners - 50 or more (%)
Housing units in structures - Owners - Mobile home (%)
Housing units in structures - Owners - Boat, RV, van, etc. (%)
Housing units in structures - Renters - 1, detached (%)
Housing units in structures - Renters - 1, attached (%)
Housing units in structures - Renters - 2 (%)
Housing units in structures - Renters - 3 or 4 (%)
Housing units in structures - Renters - 5 to 9 (%)
Housing units in structures - Renters - 10 to 19 (%)
Housing units in structures - Renters - 20 to 49 (%)
Housing units in structures - Renters - 50 or more (%)
Housing units in structures - Renters - Mobile home (%)
Housing units in structures - Renters - Boat, RV, van, etc. (%)
House/condo owner moved in on average (years ago)
Renter moved in on average (years ago)
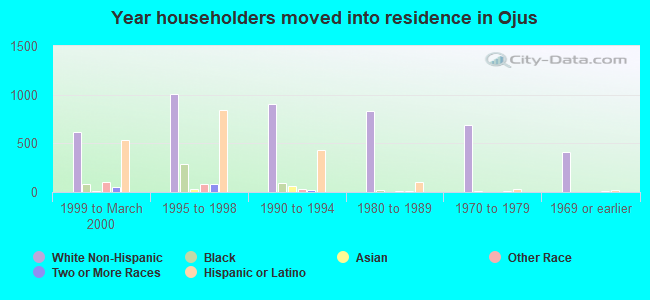
Year householder moved into unit - Moved in 1999 to March 2000 (%)
Year householder moved into unit - Moved in 1999 to March 2000 (%) - White
Year householder moved into unit - Moved in 1999 to March 2000 (%) - Black or African American
Year householder moved into unit - Moved in 1999 to March 2000 (%) - Asian
Year householder moved into unit - Moved in 1999 to March 2000 (%) - Hispanic or Latino
Year householder moved into unit - Moved in 1999 to March 2000 (%) - American Indian and Alaska Native
Year householder moved into unit - Moved in 1999 to March 2000 (%) - Multirace
Year householder moved into unit - Moved in 1999 to March 2000 (%) - Other Race
Year householder moved into unit - Moved in 1995 to 1998 (%)
Year householder moved into unit - Moved in 1995 to 1998 (%) - White
Year householder moved into unit - Moved in 1995 to 1998 (%) - Black or African American
Year householder moved into unit - Moved in 1995 to 1998 (%) - Asian
Year householder moved into unit - Moved in 1995 to 1998 (%) - Hispanic or Latino
Year householder moved into unit - Moved in 1995 to 1998 (%) - American Indian and Alaska Native
Year householder moved into unit - Moved in 1995 to 1998 (%) - Multirace
Year householder moved into unit - Moved in 1995 to 1998 (%) - Other Race
Year householder moved into unit - Moved in 1990 to 1994 (%)
Year householder moved into unit - Moved in 1990 to 1994 (%) - White
Year householder moved into unit - Moved in 1990 to 1994 (%) - Black or African American
Year householder moved into unit - Moved in 1990 to 1994 (%) - Asian
Year householder moved into unit - Moved in 1990 to 1994 (%) - Hispanic or Latino
Year householder moved into unit - Moved in 1990 to 1994 (%) - American Indian and Alaska Native
Year householder moved into unit - Moved in 1990 to 1994 (%) - Multirace
Year householder moved into unit - Moved in 1990 to 1994 (%) - Other Race
Year householder moved into unit - Moved in 1980 to 1989 (%)
Year householder moved into unit - Moved in 1980 to 1989 (%) - White
Year householder moved into unit - Moved in 1980 to 1989 (%) - Black or African American
Year householder moved into unit - Moved in 1980 to 1989 (%) - Asian
Year householder moved into unit - Moved in 1980 to 1989 (%) - Hispanic or Latino
Year householder moved into unit - Moved in 1980 to 1989 (%) - American Indian and Alaska Native
Year householder moved into unit - Moved in 1980 to 1989 (%) - Multirace
Year householder moved into unit - Moved in 1980 to 1989 (%) - Other Race
Year householder moved into unit - Moved in 1970 to 1979 (%)
Year householder moved into unit - Moved in 1970 to 1979 (%) - White
Year householder moved into unit - Moved in 1970 to 1979 (%) - Black or African American
Year householder moved into unit - Moved in 1970 to 1979 (%) - Asian
Year householder moved into unit - Moved in 1970 to 1979 (%) - Hispanic or Latino
Year householder moved into unit - Moved in 1970 to 1979 (%) - American Indian and Alaska Native
Year householder moved into unit - Moved in 1970 to 1979 (%) - Multirace
Year householder moved into unit - Moved in 1970 to 1979 (%) - Other Race
Year householder moved into unit - Moved in 1969 or earlier (%)
Year householder moved into unit - Moved in 1969 or earlier (%) - White
Year householder moved into unit - Moved in 1969 or earlier (%) - Black or African American
Year householder moved into unit - Moved in 1969 or earlier (%) - Asian
Year householder moved into unit - Moved in 1969 or earlier (%) - Hispanic or Latino
Year householder moved into unit - Moved in 1969 or earlier (%) - American Indian and Alaska Native
Year householder moved into unit - Moved in 1969 or earlier (%) - Multirace
Year householder moved into unit - Moved in 1969 or earlier (%) - Other Race
Housing units lacking complete plumbing facilities (%)
Housing units lacking complete kitchen facilities (%)
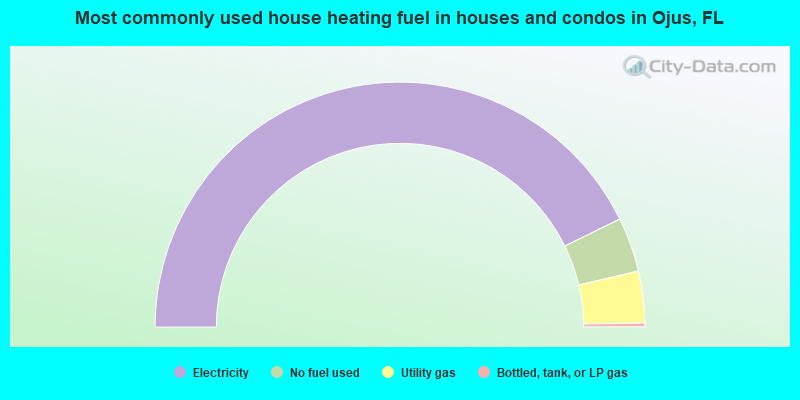
House heating fuel used in houses and condos - Utility gas (%)
House heating fuel used in houses and condos - Bottled, tank, or LP gas (%)
House heating fuel used in houses and condos - Electricity (%)
House heating fuel used in houses and condos - Fuel oil, kerosene, etc. (%)
House heating fuel used in houses and condos - Coal or coke (%)
House heating fuel used in houses and condos - Wood (%)
House heating fuel used in houses and condos - Solar energy (%)
House heating fuel used in houses and condos - Other fuel (%)
House heating fuel used in houses and condos - No fuel used (%)
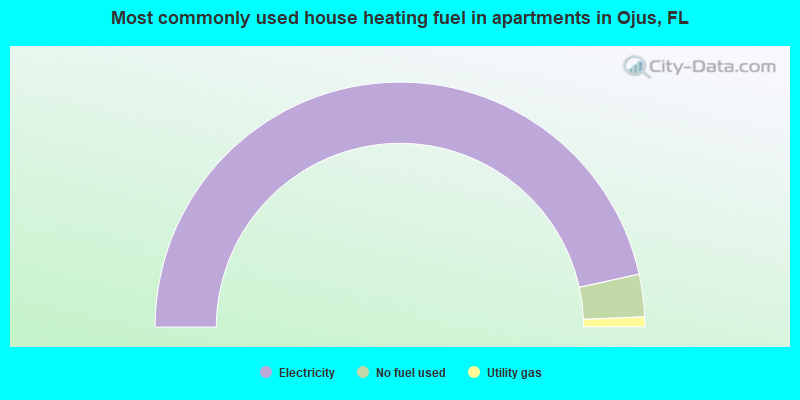
House heating fuel used in apartments - Utility gas (%)
House heating fuel used in apartments - Bottled, tank, or LP gas (%)
House heating fuel used in apartments - Electricity (%)
House heating fuel used in apartments - Fuel oil, kerosene, etc. (%)
House heating fuel used in apartments - Coal or coke (%)
House heating fuel used in apartments - Wood (%)
House heating fuel used in apartments - Solar energy (%)
House heating fuel used in apartments - Other fuel (%)
House heating fuel used in apartments - No fuel used (%)
Median year house/condo built: 1968Median year apartment built: 1972Household type by relationship:
Households: 16,361
Male householders: 3,569 (898 living alone ), Female householders: 3,239 (1,119 living alone )3,058 spouses (2,998 opposite-sex spouses ), 446 unmarried partners , (335 opposite-sex unmarried partners ), 4,627 children (4,515 natural , 26 adopted , 84 stepchildren ), 282 grandchildren , 327 brothers or sisters , 335 parents , 0 foster children , 113 other relatives , 222 non-relatives In group quarters: 139
Size of family households: 2,386 2-persons , 846 3-persons , 825 4-persons , 250 5-persons , 44 6-persons , 48 7-or-more-persons .
Size of nonfamily households: 2,162 1-person , 492 2-persons , 15 5-persons .
1,799 married couples with children. single-parent households (175 men , 523 women ).
33.7% of residents of Ojus speak English at home. of residents speak Spanish at home (57% speak English very well , 25% speak English well , 12% speak English not well , 7% don't speak English at all ).of residents speak other Indo-European language at home (73% speak English very well , 22% speak English well , 5% speak English not well ).of residents speak Asian or Pacific Island language at home (57% speak English very well , 23% speak English well , 20% speak English not well ).of residents speak other language at home (79% speak English very well , 10% speak English well , 10% speak English not well ).
Foreign born population: 8,611 (52.6%)of them are naturalized citizens )
Median number of rooms in houses and condos:
Median number of rooms in apartments
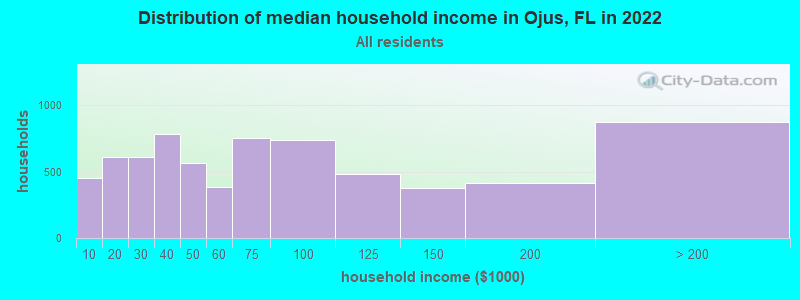
Ojus, FL household income distribution 450 Less than $10,000614 $10,000 to $19,999614 $20,000 to $29,999780 $30,000 to $39,999562 $40,000 to $49,999381 $50,000 to $59,999751 $60,000 to $74,999742 $75,000 to $99,999483 $100,000 to $124,999379 $125,000 to $149,999411 $150,000 to $199,999874 $200,000 or more
Home value of owner - occupied houses in 2022 in Ojus, FL 10 Less than $10,00017 $30,000 to $34,99925 $50,000 to $59,9996 $60,000 to $69,999106 $70,000 to $79,999104 $80,000 to $89,999101 $90,000 to $99,999384 $100,000 to $124,999135 $125,000 to $149,999407 $150,000 to $174,999120 $175,000 to $199,99990 $200,000 to $249,999124 $250,000 to $299,999246 $300,000 to $399,999277 $400,000 to $499,999952 $500,000 to $749,999841 $750,000 to $999,999363 $1,000,000 to $1,499,999187 $1,500,000 to $1,999,999205 $2,000,000 or moreRent paid by renters in 2022 in Ojus, FL 27 $250 to $29930 $500 to $5497 $550 to $5998 $750 to $79936 $800 to $899111 $900 to $999451 $1,000 to $1,249546 $1,250 to $1,499557 $1,500 to $1,999180 $2,000 to $2,499138 $2,500 to $2,99922 $3,500 or more56 No cash rent
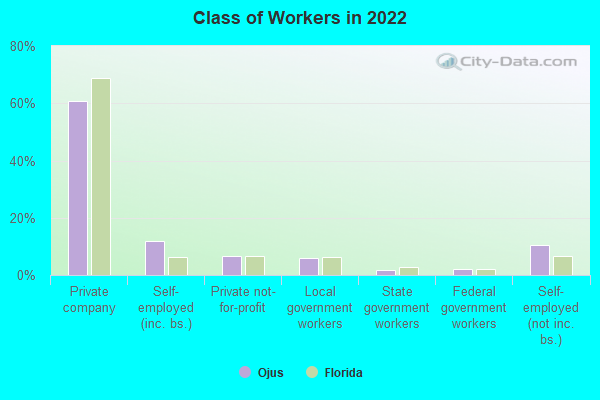
Percentage of workers working in this county: 85.1%Number of people working at home: 906 (10.4% of all workers )
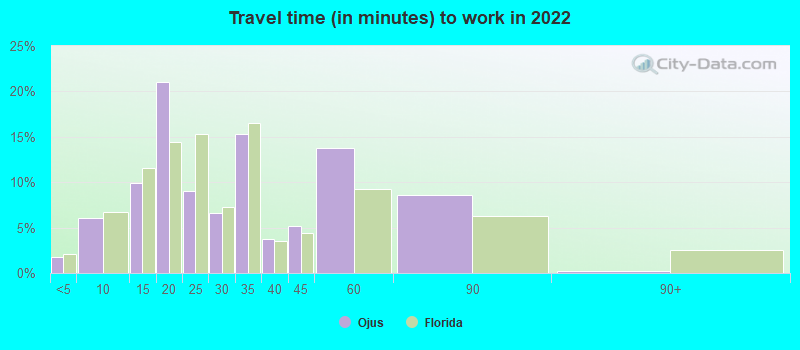
Travel time to work (commute)
Less than 5 minutes: 385 to 9 minutes: 32910 to 14 minutes: 53915 to 19 minutes: 1,22520 to 24 minutes: 93225 to 29 minutes: 70330 to 34 minutes: 1,42935 to 39 minutes: 45540 to 44 minutes: 41745 to 59 minutes: 1,06360 to 89 minutes: 29990 or more minutes: 220
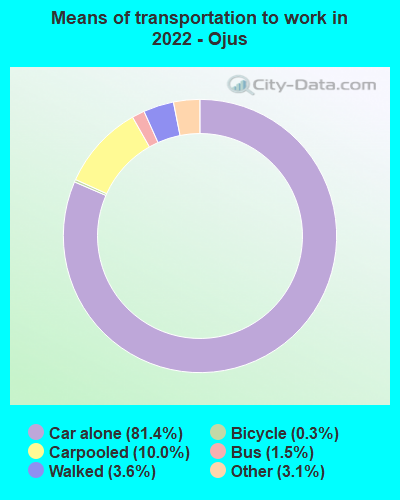
Means of transportation to work:
Drove a car alone: 3,381 (66.2%)Carpooled: 469 (9.2%)Bus : 60 (1.2%)Taxi: 162 (3.2%)Bicycle: 16 (0.3%)Walked: 174 (3.4%)Worked at home: 906 (17.7%)
Unemployment by race in 2022
Unemployment rate for White non-Hispanic residents 5.4% Males0.1% FemalesUnemployment rate for other race residents 5.0% FemalesUnemployment rate for two or more race residents 3.6% Males2.8% FemalesUnemployment rate for Hispanic or Latino residents 5.7% Males3.5% Females
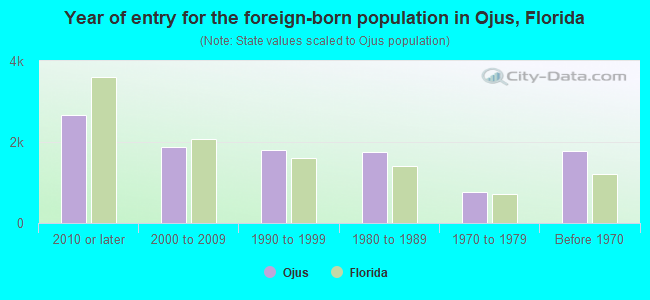
Year of entry for the foreign-born population in Ojus, Florida
2,674 2010 or later 1,868 2000 to 2009 1,808 1990 to 1999 1,746 1980 to 1989 763 1970 to 1979 1,780 Before 1970
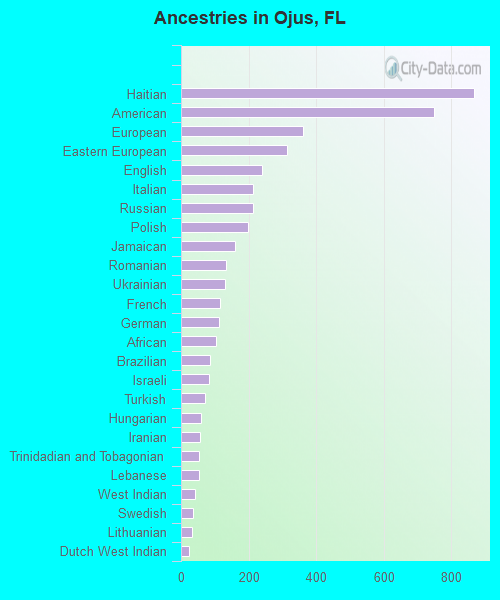
First ancestries reported:
Haitian: 869 (8.6%)
American: 750 (7.4%)
European: 361 (3.6%)
Eastern European: 315 (3.1%)
English: 240 (2.4%)
Italian: 213 (2.1%)
Russian: 213 (2.1%)
Polish: 199 (2.0%)
Jamaican: 161 (1.6%)
Romanian: 134 (1.3%)
Ukrainian: 130 (1.3%)
French: 116 (1.2%)
German: 114 (1.1%)
African: 104 (1.0%)
Brazilian: 87 (0.9%)
Israeli: 83 (0.8%)
Turkish: 70 (0.7%)
Hungarian: 59 (0.6%)
Iranian: 57 (0.6%)
Trinidadian and Tobagonian: 53 (0.5%)
Lebanese: 52 (0.5%)
West Indian: 40 (0.4%)
Swedish: 37 (0.4%)
Lithuanian: 32 (0.3%)
Dutch West Indian: 25 (0.2%)
Moroccan: 23 (0.2%)
Norwegian: 21 (0.2%)
Slovak: 20 (0.2%)
Portuguese: 19 (0.2%)
Greek: 19 (0.2%)
Canadian: 19 (0.2%)
Iraqi: 17 (0.2%)
Dutch: 11 (0.1%)
Danish: 10 (0.10%)
Irish: 8 (0.08%) Most common places of birth for foreign-born residents (%): Colombia Ojus:
21.2% (1,828)Florida:
6.5% (298,669)
Venezuela Ojus:
11.6% (999)Florida:
5.7% (262,042)
Argentina Ojus:
9.2% (795)Florida:
1.3% (57,263)
Cuba Ojus:
9.0% (777)Florida:
22.0% (1,006,576)
Haiti Ojus:
8.8% (759)Florida:
7.5% (342,375)
Peru Ojus:
5.4% (468)Florida:
2.1% (96,693)
Ecuador Ojus:
3.5% (298)Florida:
1.2% (54,585)
Dominican Republic Ojus:
2.9% (251)Florida:
3.0% (137,727)
Brazil Ojus:
2.9% (250)Florida:
2.7% (122,906)
Honduras Ojus:
2.2% (193)Florida:
2.3% (107,160)
Uruguay Ojus:
2.2% (190)Florida:
0.3% (14,809)
Philippines Ojus:
2.0% (175)Florida:
1.8% (84,403)
Turkey Ojus:
1.8% (151)Florida:
0.2% (10,969)
Jamaica Ojus:
1.8% (151)Florida:
5.0% (227,319)
Panama Ojus:
1.6% (139)Florida:
0.5% (22,972)
Place of birth for U.S.-born residents:
This state: 4,289Other state: 3,003Northeast: 2,010Midwest: 337South: 491West: 153 89.8% of Ojus residents lived in the same house 1 years ago.
Out of people who lived in different houses, 41.7% lived in this county.
Out of people who lived in different counties, 79.1% lived in Florida.
Ojus:
89.8%State average:
86.3%
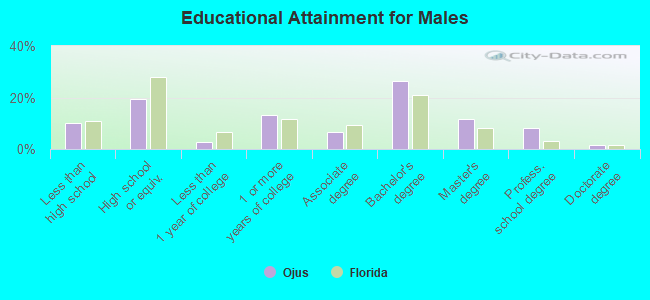
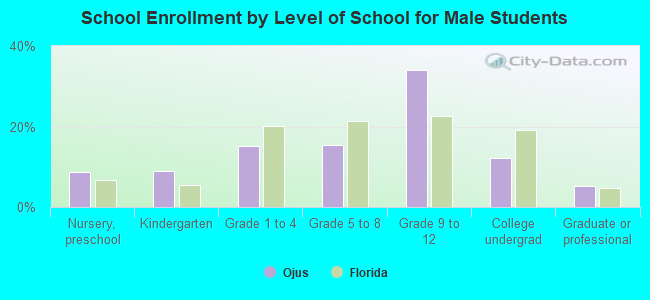
Education attainment for males 25 years and older:
No schooling: 82Nursery to 4th grade: 415th and 6th grade: 57th and 8th grade: 359th grade: 010th grade: 13611th grade: 19012th grade, no diploma: 109High school graduate (or equivalency): 1,151Less than 1 year of college: 167Some college more than 1 year, no degree: 790Associate degree: 404Bachelor's degree: 1,567Master's degree: 705Professional school degree: 481Doctorate degree: 90
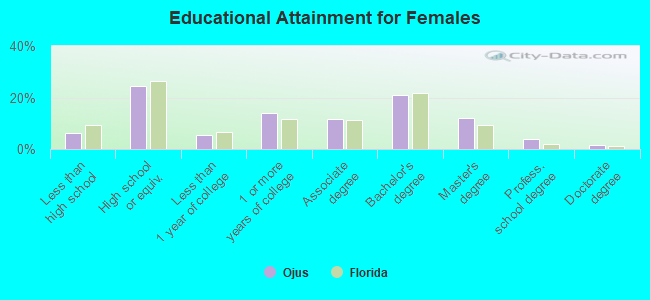
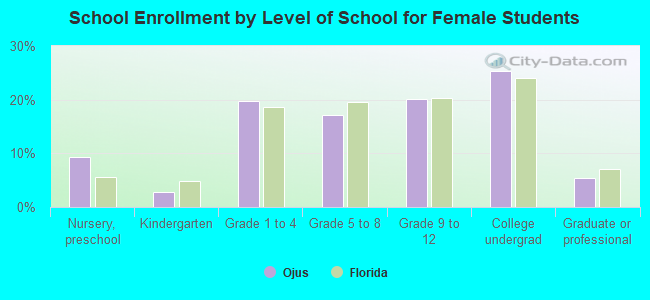
Education attainment for females 25 years and older:
No schooling: 136Nursery to 4th grade: 215th and 6th grade: 17th and 8th grade: 599th grade: 4310th grade: 4711th grade: 3012th grade, no diploma: 72High school graduate (or equivalency): 1,589Less than 1 year of college: 349Some college more than 1 year, no degree: 898Associate degree: 755Bachelor's degree: 1,362Master's degree: 771Professional school degree: 250Doctorate degree: 92
Housing units in structures:
One, detached: 2,580One, attached: 232Two: 1653 or 4: 1355 to 9: 32610 to 19: 20420 to 49: 1,13350 or more: 3,550Boats, RVs, vans, etc.: 46Housing units lacking complete plumbing facilities in 2022: 1.0%Housing units lacking complete kitchen facilities in 2022: 1.2%House/condo owner moved in on average 11 years ago
Renter moved in on average 3 years ago
Private vs. public school enrollment:
Students in private schools in grades 1 to 8 (elementary and middle school): 390 Students in private schools in grades 9 to 12 (high school): 271 Students in private undergraduate colleges: 198