New Rochelle, NY (New York) Houses and Residents
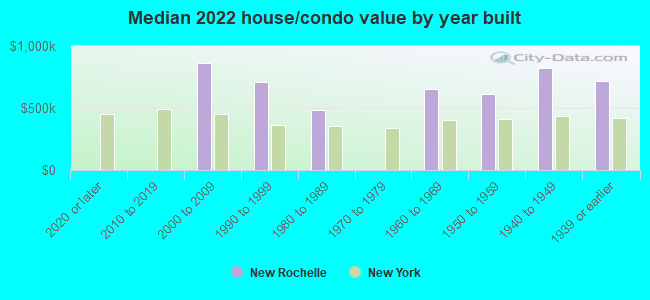
Estimated median house or condo value in 2022: $706,900 (it was $299,900 in 2000 )
New Rochelle:
$706,900New York:
$400,400
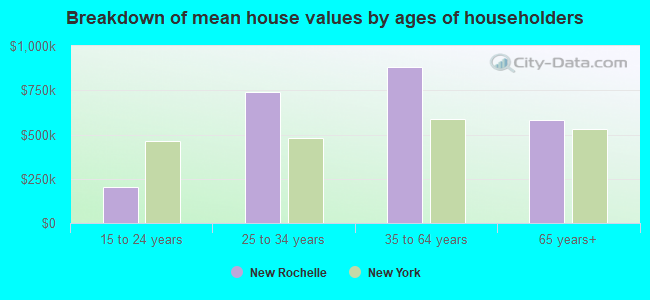
Lower value quartile - upper value quartile: $461,200 - $925,700Mean price in 2022: Detached houses: $989,568 Here:
$989,568State:
$476,719
Townhouses or other attached units: $644,565 Here:
$644,565State:
$699,270
In 2-unit structures: $591,748 Here:
$591,748State:
$713,077
In 3-to-4-unit structures: $474,879 Here:
$474,879State:
$764,568
In 5-or-more-unit structures: $263,010 Here:
$263,010State:
$912,009
Total population: 79,637 (Urban population: 72,182, Rural population: 0)
Houses: 33,291 (32,338 occupied: 15,857 owner occupied, 16,481 renter occupied )
% of renters here:
51%State:
46%
Housing density: 3,216 houses/condos per square mile
Median price asked for vacant for-sale houses and condos in 2022: $462,050.
Median contract rent in 2022: $1,598 (lower quartile is $1,076, upper quartile is over $2,000)
Median rent asked for vacant for-rent units in 2022: $1,997
Median gross rent in New Rochelle, NY in 2022: $1,709
Housing units in New Rochelle with a mortgage: 8,824 (1,574 second mortgage, 0 home equity loan, 1,574 both second mortgage and home equity loan )Houses without a mortgage: 308
Median household income for houses/condos with a mortgage: $231,250
Median household income for apartments without a mortgage: $93,466
Median monthly housing costs: $1,998
Data:
Median house or condo value ($)
Median house or condo value ($ change since 2000)
Median house or condo value ($) - White
Median house or condo value ($) - Black or African American
Median house or condo value ($) - Asian
Median house or condo value ($) - Hispanic or Latino
Median house or condo value ($) - American Indian and Alaska Native
Median house or condo value ($) - Multirace
Median house or condo value ($) - Other Race
Median price asked for mobile homes ($)
Household density (households per square mile)
Mean house or condo value by units in structure - 1, detached ($)
Mean house or condo value by units in structure - 1, attached ($)
Mean house or condo value by units in structure - 2 ($)
Mean house or condo value by units in structure by units in structure - 3 or 4 ($)
Mean house or condo value by units in structure - 5 or more ($)
Mean house or condo value by units in structure - Boat, RV, van, etc. ($)
Mean house or condo value by units in structure - Mobile home ($)
Median contract rent ($)
Median contract rent - Lower quartile ($)
Median contract rent - Upper quartile ($)
Median gross rent ($)
Urban houses (%)
Rural houses (%)
Houses occupied (%)
Houses occupied (% change since 2000)
Houses owner occupied (%)
Houses owner occupied (% change since 2000)
Houses renter occupied (%)
Houses renter occupied (% change since 2000)
Vacant housing units - For rent (%)
Vacant housing units - For rent (% change since 2000)
Vacant housing units - For sale only (%)
Vacant housing units - For sale only (% change since 2000)
Vacant housing units - Rented or sold, not occupied (%)
Vacant housing units - Rented or sold, not occupied (% change since 2000)
Vacant housing units - For seasonal, recreational, or occasional use (%)
Vacant housing units - For seasonal, recreational, or occasional use (% change since 2000)
Vacant housing units - For migrant workers (%)
Vacant housing units - For migrant workers (% change since 2000)
Vacant housing units - Other vacant (%)
Vacant housing units - Other vacant (% change since 2000)
Median monthly housing costs ($)
Median household income for houses/condos with a mortgage ($)
Median household income for houses/condos without a mortgage ($)
Median household income ($)
Median household income ($) - White
Median household income ($) - Black or African American
Median household income ($) - Asian
Median household income ($) - Hispanic or Latino
Median household income ($) - American Indian and Alaska Native
Median household income ($) - Multirace
Median household income ($) - Other Race
Mortgage status - with mortgage (%)
Mortgage status - with second mortgage (%)
Mortgage status - with home equity loan (%)
Mortgage status - with both second mortgage and home equity loan (%)
Mortgage status - without a mortgage (%)
Median year house/condo built
Median year apartment built
Household type by relationship - Male householder living alone (%)
Household type by relationship - Male householder not living alone (%)
Household type by relationship - Female householder living alone (%)
Household type by relationship - Female householder not living alone (%)
Household type by relationship - Opposite-Sex spouse (%)
Household type by relationship - Same-Sex spouse (%)
Household type by relationship - Opposite-Sex unmarried partner (%)
Household type by relationship - Same-Sex unmarried partner (%)
Household type by relationship - In group quarters (%)
Size of family households - 2-person household (%)
Size of family households - 3-person household (%)
Size of family households - 4-person household (%)
Size of family households - 5-person household (%)
Size of family households - 6-person household (%)
Size of family households - 7-or-more-person household (%)
Size of nonfamily households - 1-person household (%)
Size of nonfamily households - 2-person household (%)
Size of nonfamily households - 3-person household (%)
Size of nonfamily households - 4-person household (%)
Size of nonfamily households - 5-person household (%)
Size of nonfamily households - 6-person household (%)
Size of nonfamily households - 7-or-moreperson household (%)
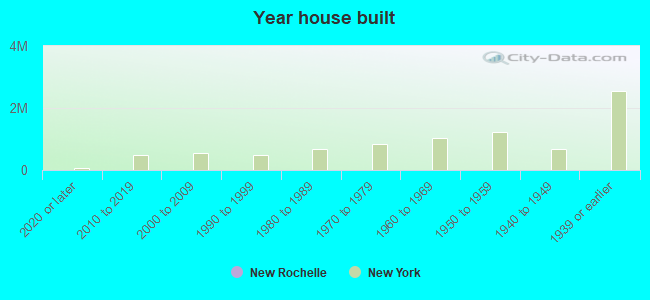
Year house built - Built 2010 or later (%)
Year house built - Built 2000 to 2009 (%)
Year house built - Built 1990 to 1999 (%)
Year house built - Built 1980 to 1989 (%)
Year house built - Built 1970 to 1979 (%)
Year house built - Built 1960 to 1969 (%)
Year house built - Built 1950 to 1959 (%)
Year house built - Built 1940 to 1949 (%)
Year house built - Built 1939 or earlier (%)
Median number of rooms in houses and condos
Median number of rooms in apartments
Median number of bedrooms in owner occupied houses
Mean number of bedrooms in owner occupied houses
Median number of bedrooms in renter occupied houses
Mean number of bedrooms in renter occupied houses
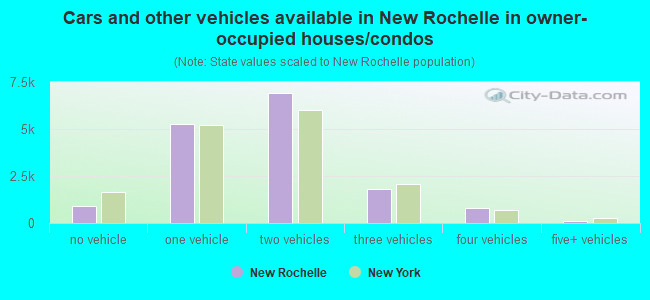
Median number of vehichles in owner occupied houses
Mean number of vehichles in owner occupied houses
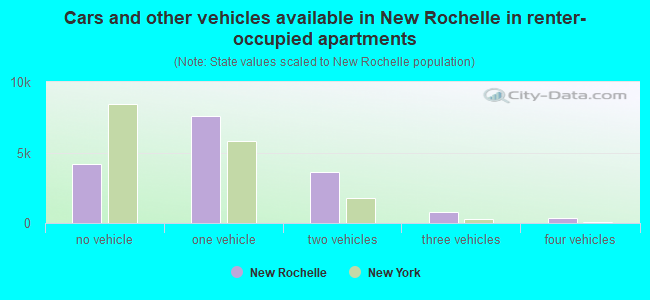
Median number of vehichles in renter occupied houses
Mean number of vehichles in renter occupied houses
Rooms in owner-occupied houses - 1 room (%)
Rooms in owner-occupied houses - 2 rooms (%)
Rooms in owner-occupied houses - 3 rooms (%)
Rooms in owner-occupied houses - 4 rooms (%)
Rooms in owner-occupied houses - 5 rooms (%)
Rooms in owner-occupied houses - 6 rooms (%)
Rooms in owner-occupied houses - 7 rooms (%)
Rooms in owner-occupied houses - 8 rooms (%)
Rooms in owner-occupied houses - 9+ rooms (%)
Rooms in renter-occupied houses - 1 room (%)
Rooms in renter-occupied houses - 2 rooms (%)
Rooms in renter-occupied houses - 3 rooms (%)
Rooms in renter-occupied houses - 4 rooms (%)
Rooms in renter-occupied houses - 5 rooms (%)
Rooms in renter-occupied houses - 6 rooms (%)
Rooms in renter-occupied houses - 7 rooms (%)
Rooms in renter-occupied houses - 8 rooms (%)
Rooms in renter-occupied houses - 9+ rooms (%)
Bedrooms in owner-occupied houses - no bedrooms (%)
Bedrooms in owner-occupied houses - 1 bedroom (%)
Bedrooms in owner-occupied houses - 2 bedrooms (%)
Bedrooms in owner-occupied houses - 3 bedrooms (%)
Bedrooms in owner-occupied houses - 4 bedrooms (%)
Bedrooms in owner-occupied houses - 5+ bedrooms (%)
Bedrooms in renter-occupied houses - no bedrooms (%)
Bedrooms in renter-occupied houses - 1 bedroom (%)
Bedrooms in renter-occupied houses - 2 bedrooms (%)
Bedrooms in renter-occupied houses - 3 bedrooms (%)
Bedrooms in renter-occupied houses - 4 bedrooms (%)
Bedrooms in renter-occupied houses - 5+ bedrooms (%)
Vehicles available in owner-occupied houses - no vehicle available (%)
Vehicles available in owner-occupied houses - 1 vehicle available(%)
Vehicles available in owner-occupied houses - 2 Vehicles available (%)
Vehicles available in owner-occupied houses - 3 Vehicles available (%)
Vehicles available in owner-occupied houses - 4 Vehicles available (%)
Vehicles available in owner-occupied houses - 5+ Vehicles available (%)
Vehicles available in renter-occupied houses - no vehicle available (%)
Vehicles available in renter-occupied houses - 1 vehicle available (%)
Vehicles available in renter-occupied houses - 2 Vehicles available (%)
Vehicles available in renter-occupied houses - 3 Vehicles available (%)
Vehicles available in renter-occupied houses - 4 Vehicles available (%)
Vehicles available in renter-occupied houses - 5+ Vehicles available (%)
Housing units in structures - 1, detached (%)
Housing units in structures - 1, attached (%)
Housing units in structures - 2 (%)
Housing units in structures - 3 or 4 (%)
Housing units in structures - 5 to 9 (%)
Housing units in structures - 10 to 19 (%)
Housing units in structures - 20 to 49 (%)
Housing units in structures - 50 or more (%)
Housing units in structures - Mobile home (%)
Housing units in structures - Boat, RV, van, etc. (%)
Housing units in structures - Owners - 1, detached (%)
Housing units in structures - Owners - 1, attached (%)
Housing units in structures - Owners - 2 (%)
Housing units in structures - Owners - 3 or 4 (%)
Housing units in structures - Owners - 5 to 9 (%)
Housing units in structures - Owners - 10 to 19 (%)
Housing units in structures - Owners - 20 to 49 (%)
Housing units in structures - Owners - 50 or more (%)
Housing units in structures - Owners - Mobile home (%)
Housing units in structures - Owners - Boat, RV, van, etc. (%)
Housing units in structures - Renters - 1, detached (%)
Housing units in structures - Renters - 1, attached (%)
Housing units in structures - Renters - 2 (%)
Housing units in structures - Renters - 3 or 4 (%)
Housing units in structures - Renters - 5 to 9 (%)
Housing units in structures - Renters - 10 to 19 (%)
Housing units in structures - Renters - 20 to 49 (%)
Housing units in structures - Renters - 50 or more (%)
Housing units in structures - Renters - Mobile home (%)
Housing units in structures - Renters - Boat, RV, van, etc. (%)
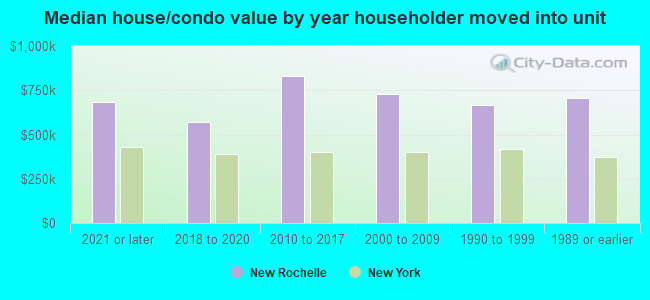
House/condo owner moved in on average (years ago)
Renter moved in on average (years ago)
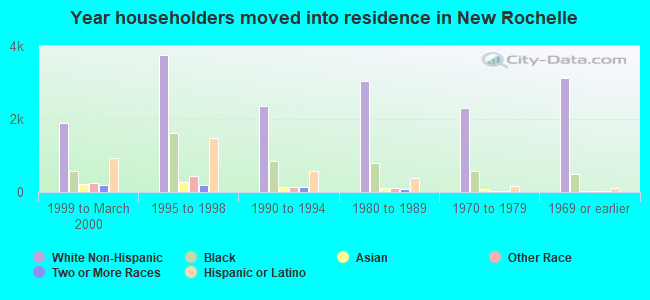
Year householder moved into unit - Moved in 1999 to March 2000 (%)
Year householder moved into unit - Moved in 1999 to March 2000 (%) - White
Year householder moved into unit - Moved in 1999 to March 2000 (%) - Black or African American
Year householder moved into unit - Moved in 1999 to March 2000 (%) - Asian
Year householder moved into unit - Moved in 1999 to March 2000 (%) - Hispanic or Latino
Year householder moved into unit - Moved in 1999 to March 2000 (%) - American Indian and Alaska Native
Year householder moved into unit - Moved in 1999 to March 2000 (%) - Multirace
Year householder moved into unit - Moved in 1999 to March 2000 (%) - Other Race
Year householder moved into unit - Moved in 1995 to 1998 (%)
Year householder moved into unit - Moved in 1995 to 1998 (%) - White
Year householder moved into unit - Moved in 1995 to 1998 (%) - Black or African American
Year householder moved into unit - Moved in 1995 to 1998 (%) - Asian
Year householder moved into unit - Moved in 1995 to 1998 (%) - Hispanic or Latino
Year householder moved into unit - Moved in 1995 to 1998 (%) - American Indian and Alaska Native
Year householder moved into unit - Moved in 1995 to 1998 (%) - Multirace
Year householder moved into unit - Moved in 1995 to 1998 (%) - Other Race
Year householder moved into unit - Moved in 1990 to 1994 (%)
Year householder moved into unit - Moved in 1990 to 1994 (%) - White
Year householder moved into unit - Moved in 1990 to 1994 (%) - Black or African American
Year householder moved into unit - Moved in 1990 to 1994 (%) - Asian
Year householder moved into unit - Moved in 1990 to 1994 (%) - Hispanic or Latino
Year householder moved into unit - Moved in 1990 to 1994 (%) - American Indian and Alaska Native
Year householder moved into unit - Moved in 1990 to 1994 (%) - Multirace
Year householder moved into unit - Moved in 1990 to 1994 (%) - Other Race
Year householder moved into unit - Moved in 1980 to 1989 (%)
Year householder moved into unit - Moved in 1980 to 1989 (%) - White
Year householder moved into unit - Moved in 1980 to 1989 (%) - Black or African American
Year householder moved into unit - Moved in 1980 to 1989 (%) - Asian
Year householder moved into unit - Moved in 1980 to 1989 (%) - Hispanic or Latino
Year householder moved into unit - Moved in 1980 to 1989 (%) - American Indian and Alaska Native
Year householder moved into unit - Moved in 1980 to 1989 (%) - Multirace
Year householder moved into unit - Moved in 1980 to 1989 (%) - Other Race
Year householder moved into unit - Moved in 1970 to 1979 (%)
Year householder moved into unit - Moved in 1970 to 1979 (%) - White
Year householder moved into unit - Moved in 1970 to 1979 (%) - Black or African American
Year householder moved into unit - Moved in 1970 to 1979 (%) - Asian
Year householder moved into unit - Moved in 1970 to 1979 (%) - Hispanic or Latino
Year householder moved into unit - Moved in 1970 to 1979 (%) - American Indian and Alaska Native
Year householder moved into unit - Moved in 1970 to 1979 (%) - Multirace
Year householder moved into unit - Moved in 1970 to 1979 (%) - Other Race
Year householder moved into unit - Moved in 1969 or earlier (%)
Year householder moved into unit - Moved in 1969 or earlier (%) - White
Year householder moved into unit - Moved in 1969 or earlier (%) - Black or African American
Year householder moved into unit - Moved in 1969 or earlier (%) - Asian
Year householder moved into unit - Moved in 1969 or earlier (%) - Hispanic or Latino
Year householder moved into unit - Moved in 1969 or earlier (%) - American Indian and Alaska Native
Year householder moved into unit - Moved in 1969 or earlier (%) - Multirace
Year householder moved into unit - Moved in 1969 or earlier (%) - Other Race
Housing units lacking complete plumbing facilities (%)
Housing units lacking complete kitchen facilities (%)
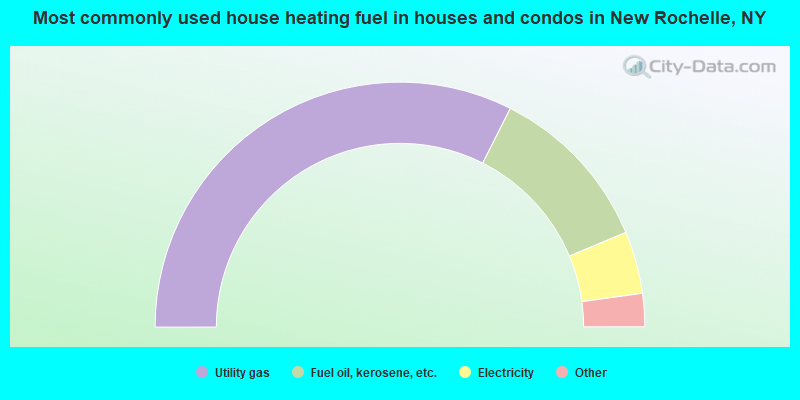
House heating fuel used in houses and condos - Utility gas (%)
House heating fuel used in houses and condos - Bottled, tank, or LP gas (%)
House heating fuel used in houses and condos - Electricity (%)
House heating fuel used in houses and condos - Fuel oil, kerosene, etc. (%)
House heating fuel used in houses and condos - Coal or coke (%)
House heating fuel used in houses and condos - Wood (%)
House heating fuel used in houses and condos - Solar energy (%)
House heating fuel used in houses and condos - Other fuel (%)
House heating fuel used in houses and condos - No fuel used (%)
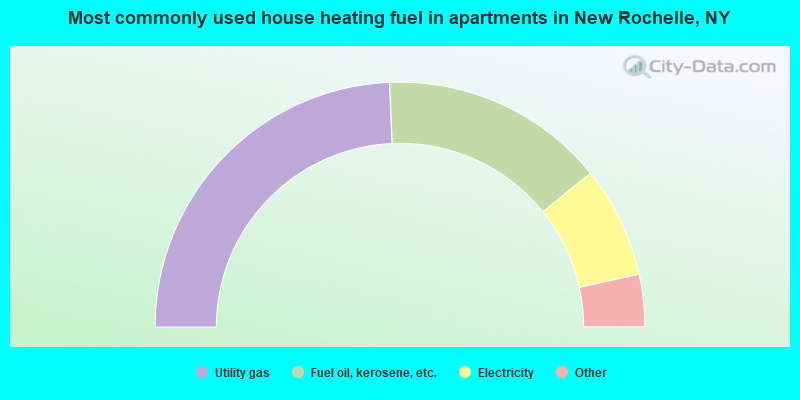
House heating fuel used in apartments - Utility gas (%)
House heating fuel used in apartments - Bottled, tank, or LP gas (%)
House heating fuel used in apartments - Electricity (%)
House heating fuel used in apartments - Fuel oil, kerosene, etc. (%)
House heating fuel used in apartments - Coal or coke (%)
House heating fuel used in apartments - Wood (%)
House heating fuel used in apartments - Solar energy (%)
House heating fuel used in apartments - Other fuel (%)
House heating fuel used in apartments - No fuel used (%)
Median year house/condo built: 1952Median year apartment built: 1964Household type by relationship:
Households: 82,292
Male householders: 15,225 (3,902 living alone ), Female householders: 17,113 (6,167 living alone )14,333 spouses (14,179 opposite-sex spouses ), 2,083 unmarried partners , (1,928 opposite-sex unmarried partners ), 23,771 children (22,454 natural , 643 adopted , 674 stepchildren ), 1,258 grandchildren , 1,329 brothers or sisters , 1,726 parents , 0 foster children , 626 other relatives , 731 non-relatives In group quarters: 4,097
Size of family households: 9,327 2-persons , 3,790 3-persons , 4,624 4-persons , 1,994 5-persons , 690 6-persons .
Size of nonfamily households: 10,069 1-person , 1,798 2-persons , 46 5-persons .
11,054 married couples with children. single-parent households (614 men , 2,616 women ).
61.3% of residents of New Rochelle speak English at home. of residents speak Spanish at home (58% speak English very well , 21% speak English well , 16% speak English not well , 5% don't speak English at all ).of residents speak other Indo-European language at home (67% speak English very well , 21% speak English well , 11% speak English not well , 2% don't speak English at all ).of residents speak Asian or Pacific Island language at home (60% speak English very well , 25% speak English well , 15% speak English not well ).of residents speak other language at home (90% speak English very well , 10% speak English well ).
Foreign born population: 17,631 (21.4%)of them are naturalized citizens )
Median number of rooms in houses and condos:
Median number of rooms in apartments
Owner-occupied Renter-occupied
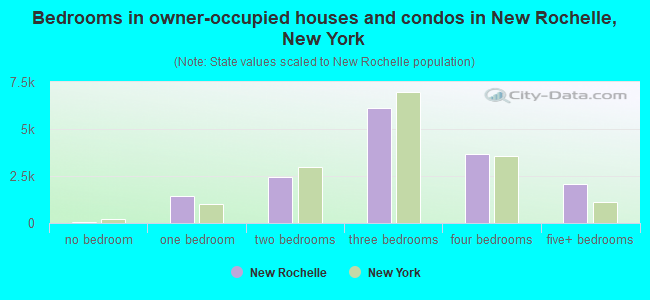
Bedrooms in owner-occupied houses and condos in New Rochelle, New York
76 no bedroom 1,435 1 bedroom 2,458 2 bedrooms 6,141 3 bedrooms 3,679 4 bedrooms 2,068 5+ bedrooms
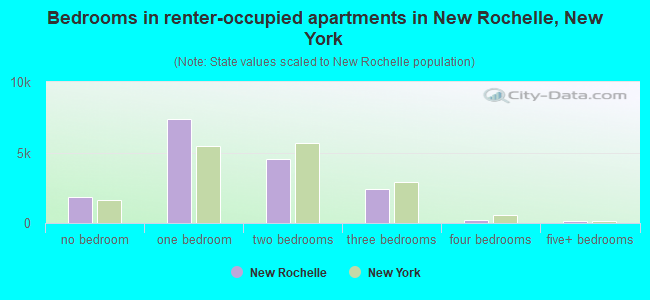
Bedrooms in renter-occupied apartments in New Rochelle, New York
1,819 no bedroom 7,341 1 bedroom 4,521 2 bedrooms 2,397 3 bedrooms 245 4 bedrooms 158 5+ bedrooms
Owner-occupied Renter-occupied
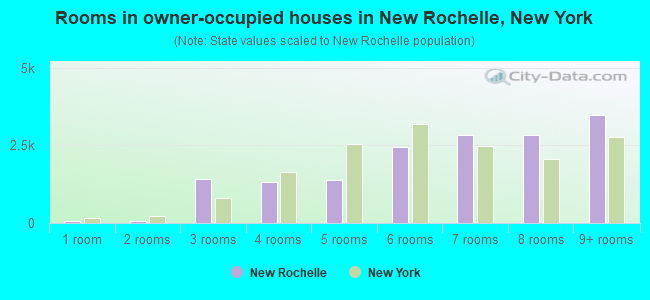
Rooms in owner-occupied houses in New Rochelle, New York
76 1 room 72 2 rooms 1,434 3 rooms 1,320 4 rooms 1,378 5 rooms 2,439 6 rooms 2,824 7 rooms 2,831 8 rooms 3,483 9+ rooms
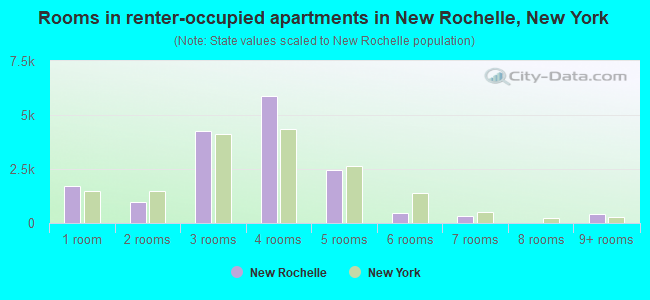
Rooms in renter-occupied apartments in New Rochelle, New York
1,703 1 room 977 2 rooms 4,278 3 rooms 5,872 4 rooms 2,453 5 rooms 475 6 rooms 301 7 rooms 0 8 rooms 422 9+ rooms
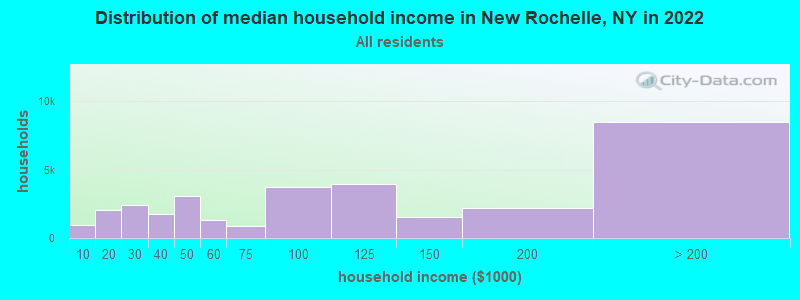
New Rochelle, NY household income distribution 969 Less than $10,0002,061 $10,000 to $19,9992,441 $20,000 to $29,9991,745 $30,000 to $39,9993,046 $40,000 to $49,9991,298 $50,000 to $59,999841 $60,000 to $74,9993,732 $75,000 to $99,9993,971 $100,000 to $124,9991,569 $125,000 to $149,9992,184 $150,000 to $199,9998,481 $200,000 or more
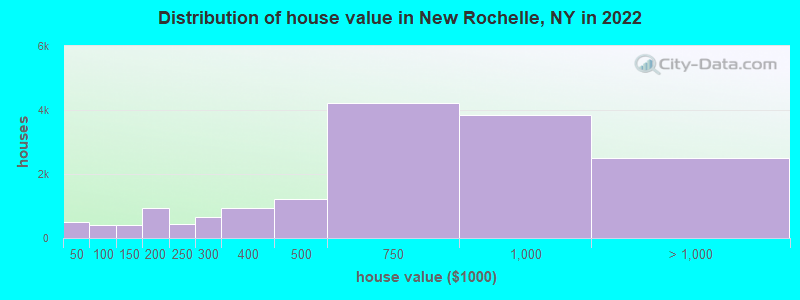
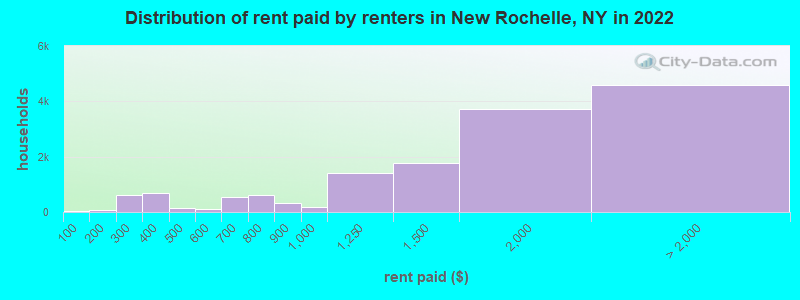
Home value of owner - occupied houses in 2022 in New Rochelle, NY 404 Less than $10,00069 $10,000 to $14,99911 $35,000 to $39,99915 $50,000 to $59,999123 $60,000 to $69,99933 $70,000 to $79,999139 $80,000 to $89,99981 $90,000 to $99,999228 $100,000 to $124,999179 $125,000 to $149,999456 $150,000 to $174,999466 $175,000 to $199,999445 $200,000 to $249,999654 $250,000 to $299,999942 $300,000 to $399,9991,230 $400,000 to $499,9994,212 $500,000 to $749,9993,835 $750,000 to $999,9991,518 $1,000,000 to $1,499,999383 $1,500,000 to $1,999,999585 $2,000,000 or moreRent paid by renters in 2022 in New Rochelle, NY 47 Less than $10063 $150 to $199442 $200 to $249166 $250 to $299418 $300 to $349279 $350 to $399109 $400 to $44931 $450 to $49941 $500 to $54962 $550 to $599145 $600 to $649405 $650 to $699407 $700 to $749192 $750 to $799321 $800 to $899172 $900 to $9991,415 $1,000 to $1,2491,755 $1,250 to $1,4993,705 $1,500 to $1,9992,412 $2,000 to $2,499993 $2,500 to $2,999342 $3,000 to $3,499569 $3,500 or more290 No cash rent
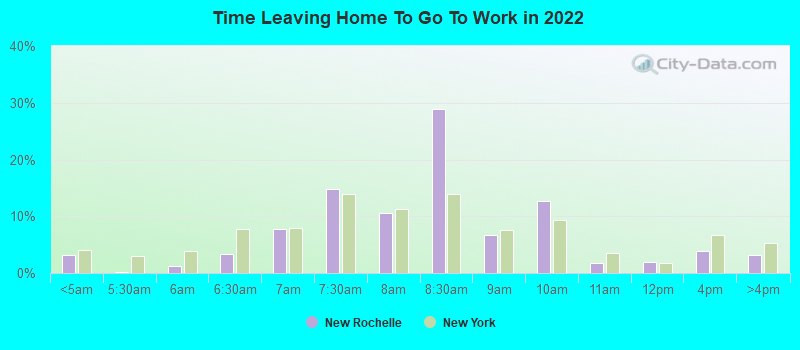
Percentage of workers working in this county: 67.1%Number of people working at home: 7,770 (18.4% of all workers )
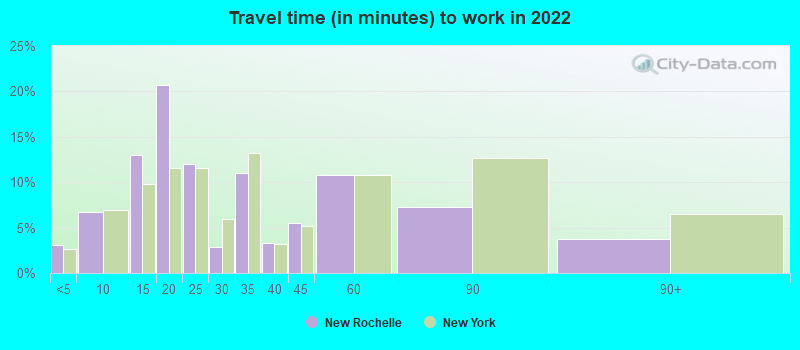
Travel time to work (commute)
Less than 5 minutes: 7415 to 9 minutes: 1,91510 to 14 minutes: 2,33415 to 19 minutes: 7,02720 to 24 minutes: 4,93225 to 29 minutes: 1,97630 to 34 minutes: 4,76935 to 39 minutes: 1,02840 to 44 minutes: 1,12045 to 59 minutes: 1,87760 to 89 minutes: 4,87690 or more minutes: 1,920
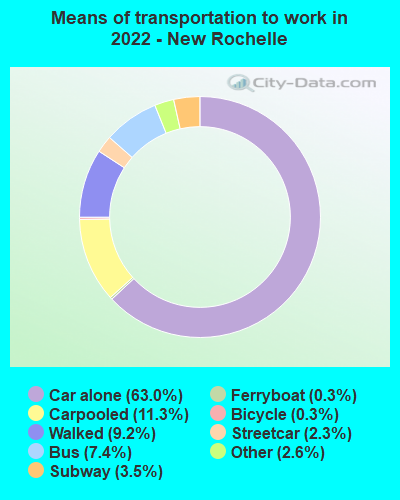
Means of transportation to work:
Drove a car alone: 13,139 (47.7%)Carpooled: 2,386 (8.7%)Bus : 1,335 (4.9%)Subway or elevated rail : 640 (2.3%)Long-distance train or commuter rail : 554 (2.0%)Ferryboat: 71 (0.3%)Taxi: 948 (3.4%)Bicycle: 82 (0.3%)Walked: 1,911 (6.9%)Worked at home: 6,697 (24.3%)
Unemployment by race in 2022
Unemployment rate for White non-Hispanic residents 5.5% MalesUnemployment rate for Black residents 3.1% Males2.4% FemalesUnemployment rate for Asian residents 1.0% Males1.7% FemalesUnemployment rate for other race residents 7.4% Males11.0% FemalesUnemployment rate for two or more race residents 5.0% Males4.4% FemalesUnemployment rate for Hispanic or Latino residents 0.5% Males11.3% Females
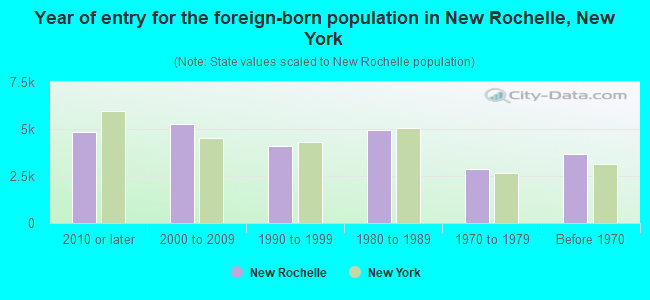
Year of entry for the foreign-born population in New Rochelle, New York
4,823 2010 or later 5,240 2000 to 2009 4,087 1990 to 1999 4,967 1980 to 1989 2,849 1970 to 1979 3,646 Before 1970
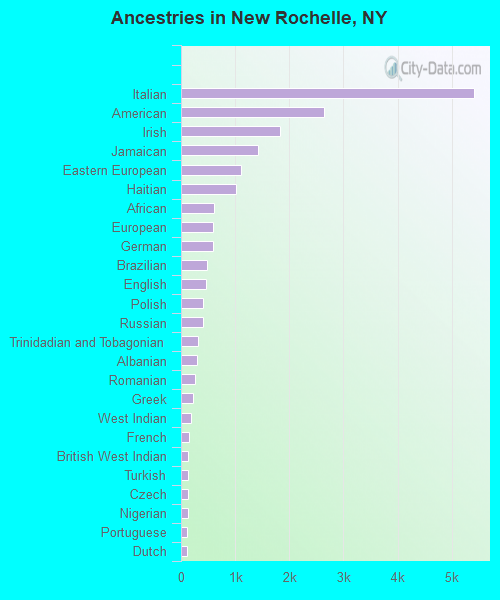
First ancestries reported:
Italian: 5,417 (11.3%)
American: 2,635 (5.5%)
Irish: 1,833 (3.8%)
Jamaican: 1,422 (3.0%)
Eastern European: 1,110 (2.3%)
Haitian: 1,022 (2.1%)
African: 610 (1.3%)
European: 597 (1.2%)
German: 592 (1.2%)
Brazilian: 481 (1.0%)
English: 465 (1.0%)
Polish: 414 (0.9%)
Russian: 412 (0.9%)
Trinidadian and Tobagonian: 313 (0.7%)
Albanian: 296 (0.6%)
Romanian: 261 (0.5%)
Greek: 213 (0.4%)
West Indian: 183 (0.4%)
French: 140 (0.3%)
British West Indian: 123 (0.3%)
Turkish: 123 (0.3%)
Czech: 122 (0.3%)
Nigerian: 122 (0.3%)
Portuguese: 114 (0.2%)
Dutch: 102 (0.2%)
Ukrainian: 88 (0.2%)
Scottish: 76 (0.2%)
Palestinian: 74 (0.2%)
Croatian: 72 (0.1%)
Canadian: 69 (0.1%)
Guyanese: 54 (0.1%)
Lebanese: 50 (0.1%)
Ethiopian: 48 (0.10%)
Austrian: 47 (0.10%)
Liberian: 46 (0.10%)
Norwegian: 45 (0.09%)
South African: 44 (0.09%)
Swedish: 44 (0.09%)
Ghanaian: 43 (0.09%)
Moroccan: 37 (0.08%)
Israeli: 35 (0.07%)
Barbadian: 35 (0.07%)
Macedonian: 28 (0.06%)
Serbian: 28 (0.06%)
Iranian: 27 (0.06%)
Armenian: 26 (0.05%)
Lithuanian: 25 (0.05%)
Slovene: 23 (0.05%)
British: 20 (0.04%)
Yugoslavian: 16 (0.03%)
Welsh: 15 (0.03%)
Czechoslovakian: 9 (0.02%)
Swiss: 9 (0.02%)
Slovak: 8 (0.02%)
Finnish: 8 (0.02%)
Northern European: 6 (0.01%)
Australian: 5 (0.01%)
Scotch-Irish: 4 (0.01%)
Belizean: 4 (0.01%)
Hungarian: 3 (0.01%)
Most common places of birth for foreign-born residents (%): Mexico New Rochelle:
24.0% (5,245)New York:
4.8% (214,559)
Jamaica New Rochelle:
6.5% (1,424)New York:
5.0% (227,557)
Guatemala New Rochelle:
6.4% (1,390)New York:
1.4% (61,245)
Colombia New Rochelle:
5.4% (1,182)New York:
2.5% (111,920)
Italy New Rochelle:
4.2% (915)New York:
1.8% (81,374)
Haiti New Rochelle:
3.9% (863)New York:
2.8% (126,936)
Peru New Rochelle:
3.6% (781)New York:
1.2% (54,759)
Dominican Republic New Rochelle:
3.1% (687)New York:
11.1% (501,040)
Philippines New Rochelle:
2.7% (600)New York:
2.0% (91,070)
India New Rochelle:
2.7% (587)New York:
3.5% (158,432)
Brazil New Rochelle:
2.4% (526)New York:
0.7% (30,658)
Ecuador New Rochelle:
1.9% (425)New York:
3.9% (177,448)
Zimbabwe New Rochelle:
1.9% (410)New York:
0.0% (1,643)
Cameroon New Rochelle:
1.5% (334)New York:
0.0% (1,642)
Pakistan New Rochelle:
1.5% (332)New York:
1.4% (62,442)
Place of birth for U.S.-born residents:
This state: 53,370Other state: 9,623Northeast: 5,265Midwest: 1,389South: 2,091West: 878 90.0% of New Rochelle residents lived in the same house 1 years ago.
Out of people who lived in different houses, 35.2% lived in this county.
Out of people who lived in different counties, 60.8% lived in New York.
New Rochelle:
90.0%State average:
89.6%
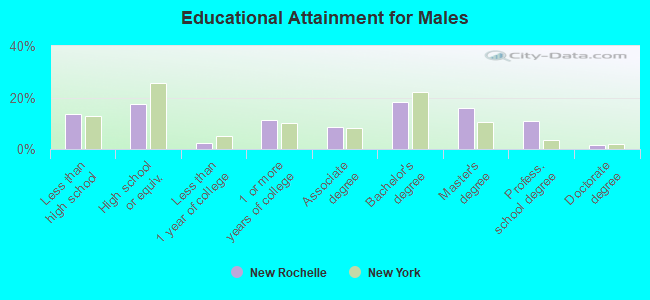
Education attainment for males 25 years and older:
No schooling: 922Nursery to 4th grade: 2105th and 6th grade: 777th and 8th grade: 2829th grade: 010th grade: 67111th grade: 51112th grade, no diploma: 1,023High school graduate (or equivalency): 4,667Less than 1 year of college: 575Some college more than 1 year, no degree: 3,020Associate degree: 2,333Bachelor's degree: 4,921Master's degree: 4,286Professional school degree: 2,907Doctorate degree: 419
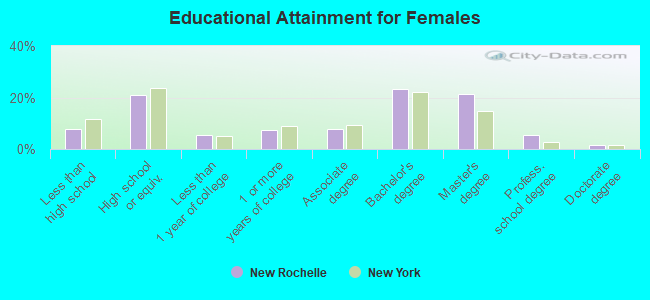
Education attainment for females 25 years and older:
No schooling: 903Nursery to 4th grade: 1355th and 6th grade: 887th and 8th grade: 479th grade: 24810th grade: 011th grade: 36512th grade, no diploma: 514High school graduate (or equivalency): 6,268Less than 1 year of college: 1,586Some college more than 1 year, no degree: 2,190Associate degree: 2,334Bachelor's degree: 6,994Master's degree: 6,446Professional school degree: 1,604Doctorate degree: 446
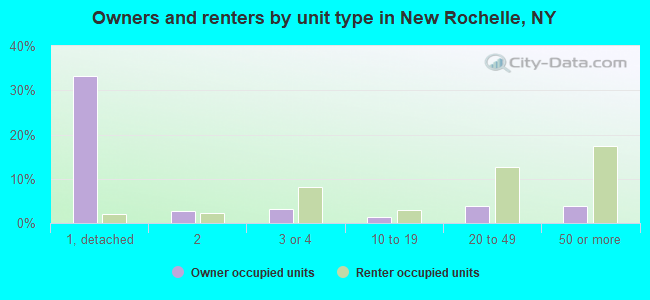
Housing units in structures:
One, detached: 12,784One, attached: 826Two: 2,4333 or 4: 2,3865 to 9: 90710 to 19: 1,28020 to 49: 5,07750 or more: 7,356Mobile homes: 242Housing units lacking complete plumbing facilities in 2022: 0.3%Housing units lacking complete kitchen facilities in 2022: 1.7%House/condo owner moved in on average 16 years ago
Renter moved in on average 4 years ago
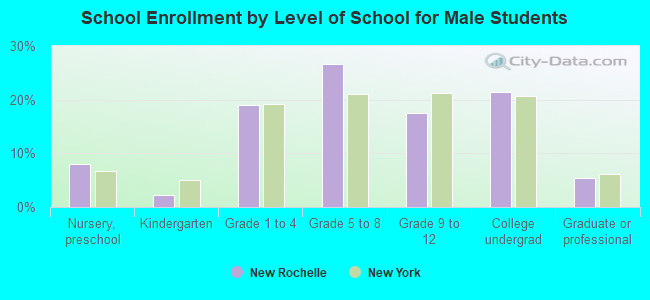
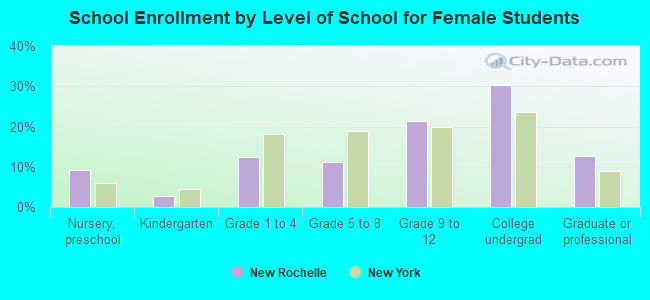
Private vs. public school enrollment:
Students in private schools in grades 1 to 8 (elementary and middle school): 1,434 Students in private schools in grades 9 to 12 (high school): 438 Students in private undergraduate colleges: 3,905