Morton Grove, IL (Illinois) Houses and Residents
Estimated median house or condo value in 2022: $375,903 (it was $208,200 in 2000 )
Morton Grove:
$375,903Illinois:
$251,600
Lower value quartile - upper value quartile: $310,166 - $451,300Mean price in 2022: Detached houses: $477,538 Here:
$477,538State:
$310,164
Townhouses or other attached units: $430,651 Here:
$430,651State:
$286,230
In 2-unit structures: $266,159 Here:
$266,159State:
$299,638
In 3-to-4-unit structures: $225,070 Here:
$225,070State:
$330,907
In 5-or-more-unit structures: $232,754 Here:
$232,754State:
$318,887
Mobile homes: $227,285 Here:
$227,285State:
$78,855
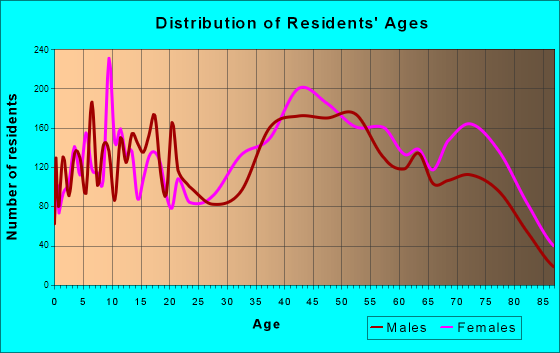
Total population: 23,497 (Urban population: 22,452, Rural population: 0)
Houses: 9,655 (9,205 occupied: 8,094 owner occupied, 1,267 renter occupied )
% of renters here:
14%State:
33%
Housing density: 1,895 houses/condos per square mile
Median price asked for vacant for-sale houses and condos in 2022: $244,992.
Median contract rent in 2022: over $2,000 (lower quartile is $1,635, upper quartile is over $2,000)
Median rent asked for vacant for-rent units in 2022: $1,021
Median gross rent in Morton Grove, IL in 2022: over $2,000
Housing units in Morton Grove with a mortgage: 4,915 (481 second mortgage, 0 home equity loan, 402 both second mortgage and home equity loan )Houses without a mortgage: 134
Median household income for houses/condos with a mortgage: $122,301
Median household income for apartments without a mortgage: $78,441
Median monthly housing costs: $1,889
Data:
Median house or condo value ($)
Median house or condo value ($ change since 2000)
Median house or condo value ($) - White
Median house or condo value ($) - Black or African American
Median house or condo value ($) - Asian
Median house or condo value ($) - Hispanic or Latino
Median house or condo value ($) - American Indian and Alaska Native
Median house or condo value ($) - Multirace
Median house or condo value ($) - Other Race
Median price asked for mobile homes ($)
Household density (households per square mile)
Mean house or condo value by units in structure - 1, detached ($)
Mean house or condo value by units in structure - 1, attached ($)
Mean house or condo value by units in structure - 2 ($)
Mean house or condo value by units in structure by units in structure - 3 or 4 ($)
Mean house or condo value by units in structure - 5 or more ($)
Mean house or condo value by units in structure - Boat, RV, van, etc. ($)
Mean house or condo value by units in structure - Mobile home ($)
Median contract rent ($)
Median contract rent - Lower quartile ($)
Median contract rent - Upper quartile ($)
Median gross rent ($)
Urban houses (%)
Rural houses (%)
Houses occupied (%)
Houses occupied (% change since 2000)
Houses owner occupied (%)
Houses owner occupied (% change since 2000)
Houses renter occupied (%)
Houses renter occupied (% change since 2000)
Vacant housing units - For rent (%)
Vacant housing units - For rent (% change since 2000)
Vacant housing units - For sale only (%)
Vacant housing units - For sale only (% change since 2000)
Vacant housing units - Rented or sold, not occupied (%)
Vacant housing units - Rented or sold, not occupied (% change since 2000)
Vacant housing units - For seasonal, recreational, or occasional use (%)
Vacant housing units - For seasonal, recreational, or occasional use (% change since 2000)
Vacant housing units - For migrant workers (%)
Vacant housing units - For migrant workers (% change since 2000)
Vacant housing units - Other vacant (%)
Vacant housing units - Other vacant (% change since 2000)
Median monthly housing costs ($)
Median household income for houses/condos with a mortgage ($)
Median household income for houses/condos without a mortgage ($)
Median household income ($)
Median household income ($) - White
Median household income ($) - Black or African American
Median household income ($) - Asian
Median household income ($) - Hispanic or Latino
Median household income ($) - American Indian and Alaska Native
Median household income ($) - Multirace
Median household income ($) - Other Race
Mortgage status - with mortgage (%)
Mortgage status - with second mortgage (%)
Mortgage status - with home equity loan (%)
Mortgage status - with both second mortgage and home equity loan (%)
Mortgage status - without a mortgage (%)
Median year house/condo built
Median year apartment built
Household type by relationship - Male householder living alone (%)
Household type by relationship - Male householder not living alone (%)
Household type by relationship - Female householder living alone (%)
Household type by relationship - Female householder not living alone (%)
Household type by relationship - Opposite-Sex spouse (%)
Household type by relationship - Same-Sex spouse (%)
Household type by relationship - Opposite-Sex unmarried partner (%)
Household type by relationship - Same-Sex unmarried partner (%)
Household type by relationship - In group quarters (%)
Size of family households - 2-person household (%)
Size of family households - 3-person household (%)
Size of family households - 4-person household (%)
Size of family households - 5-person household (%)
Size of family households - 6-person household (%)
Size of family households - 7-or-more-person household (%)
Size of nonfamily households - 1-person household (%)
Size of nonfamily households - 2-person household (%)
Size of nonfamily households - 3-person household (%)
Size of nonfamily households - 4-person household (%)
Size of nonfamily households - 5-person household (%)
Size of nonfamily households - 6-person household (%)
Size of nonfamily households - 7-or-moreperson household (%)
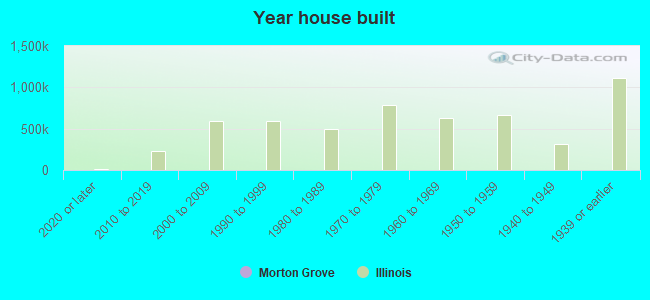
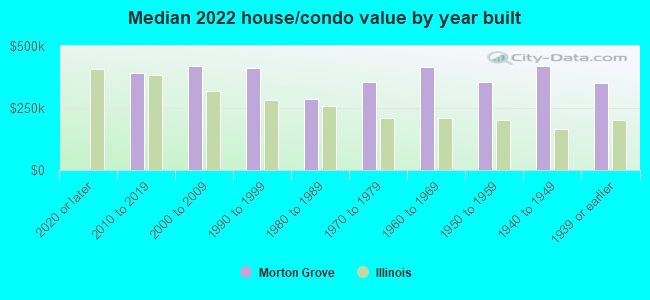
Year house built - Built 2010 or later (%)
Year house built - Built 2000 to 2009 (%)
Year house built - Built 1990 to 1999 (%)
Year house built - Built 1980 to 1989 (%)
Year house built - Built 1970 to 1979 (%)
Year house built - Built 1960 to 1969 (%)
Year house built - Built 1950 to 1959 (%)
Year house built - Built 1940 to 1949 (%)
Year house built - Built 1939 or earlier (%)
Median number of rooms in houses and condos
Median number of rooms in apartments
Median number of bedrooms in owner occupied houses
Mean number of bedrooms in owner occupied houses
Median number of bedrooms in renter occupied houses
Mean number of bedrooms in renter occupied houses
Median number of vehichles in owner occupied houses
Mean number of vehichles in owner occupied houses
Median number of vehichles in renter occupied houses
Mean number of vehichles in renter occupied houses
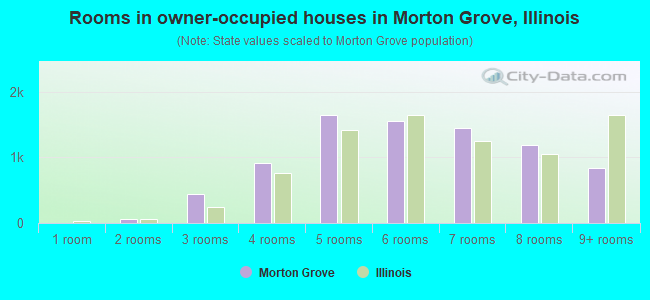
Rooms in owner-occupied houses - 1 room (%)
Rooms in owner-occupied houses - 2 rooms (%)
Rooms in owner-occupied houses - 3 rooms (%)
Rooms in owner-occupied houses - 4 rooms (%)
Rooms in owner-occupied houses - 5 rooms (%)
Rooms in owner-occupied houses - 6 rooms (%)
Rooms in owner-occupied houses - 7 rooms (%)
Rooms in owner-occupied houses - 8 rooms (%)
Rooms in owner-occupied houses - 9+ rooms (%)
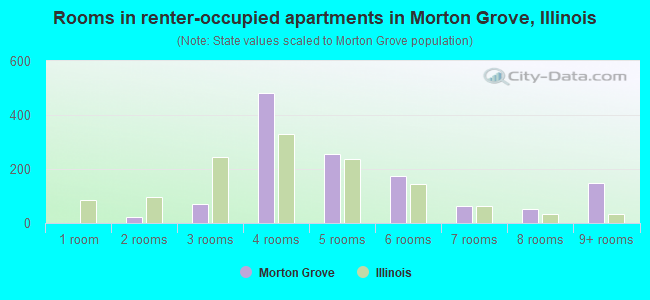
Rooms in renter-occupied houses - 1 room (%)
Rooms in renter-occupied houses - 2 rooms (%)
Rooms in renter-occupied houses - 3 rooms (%)
Rooms in renter-occupied houses - 4 rooms (%)
Rooms in renter-occupied houses - 5 rooms (%)
Rooms in renter-occupied houses - 6 rooms (%)
Rooms in renter-occupied houses - 7 rooms (%)
Rooms in renter-occupied houses - 8 rooms (%)
Rooms in renter-occupied houses - 9+ rooms (%)
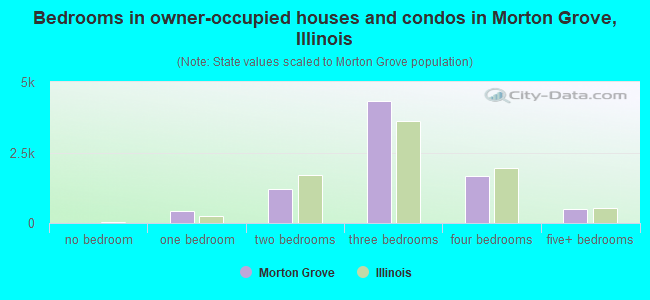
Bedrooms in owner-occupied houses - no bedrooms (%)
Bedrooms in owner-occupied houses - 1 bedroom (%)
Bedrooms in owner-occupied houses - 2 bedrooms (%)
Bedrooms in owner-occupied houses - 3 bedrooms (%)
Bedrooms in owner-occupied houses - 4 bedrooms (%)
Bedrooms in owner-occupied houses - 5+ bedrooms (%)
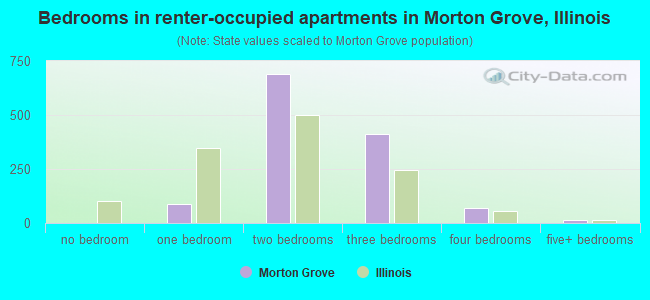
Bedrooms in renter-occupied houses - no bedrooms (%)
Bedrooms in renter-occupied houses - 1 bedroom (%)
Bedrooms in renter-occupied houses - 2 bedrooms (%)
Bedrooms in renter-occupied houses - 3 bedrooms (%)
Bedrooms in renter-occupied houses - 4 bedrooms (%)
Bedrooms in renter-occupied houses - 5+ bedrooms (%)
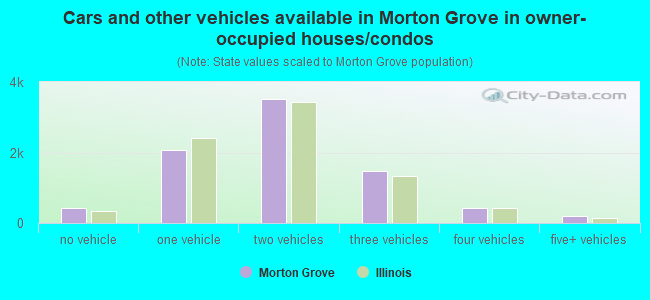
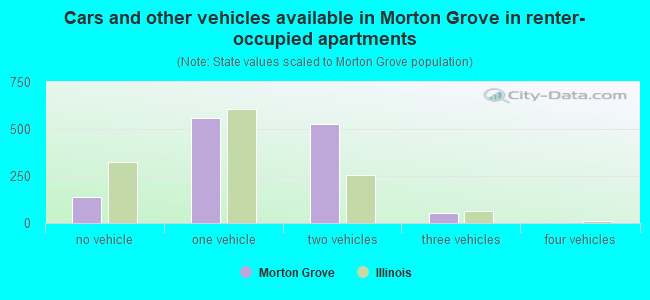
Vehicles available in owner-occupied houses - no vehicle available (%)
Vehicles available in owner-occupied houses - 1 vehicle available(%)
Vehicles available in owner-occupied houses - 2 Vehicles available (%)
Vehicles available in owner-occupied houses - 3 Vehicles available (%)
Vehicles available in owner-occupied houses - 4 Vehicles available (%)
Vehicles available in owner-occupied houses - 5+ Vehicles available (%)
Vehicles available in renter-occupied houses - no vehicle available (%)
Vehicles available in renter-occupied houses - 1 vehicle available (%)
Vehicles available in renter-occupied houses - 2 Vehicles available (%)
Vehicles available in renter-occupied houses - 3 Vehicles available (%)
Vehicles available in renter-occupied houses - 4 Vehicles available (%)
Vehicles available in renter-occupied houses - 5+ Vehicles available (%)
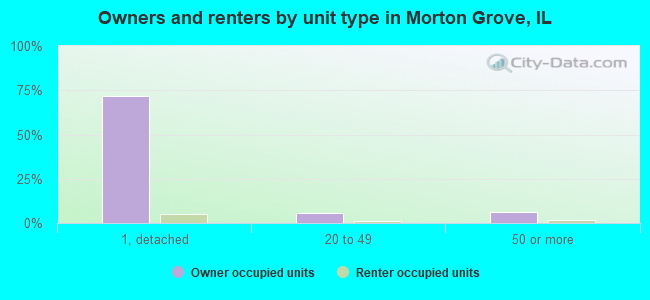
Housing units in structures - 1, detached (%)
Housing units in structures - 1, attached (%)
Housing units in structures - 2 (%)
Housing units in structures - 3 or 4 (%)
Housing units in structures - 5 to 9 (%)
Housing units in structures - 10 to 19 (%)
Housing units in structures - 20 to 49 (%)
Housing units in structures - 50 or more (%)
Housing units in structures - Mobile home (%)
Housing units in structures - Boat, RV, van, etc. (%)
Housing units in structures - Owners - 1, detached (%)
Housing units in structures - Owners - 1, attached (%)
Housing units in structures - Owners - 2 (%)
Housing units in structures - Owners - 3 or 4 (%)
Housing units in structures - Owners - 5 to 9 (%)
Housing units in structures - Owners - 10 to 19 (%)
Housing units in structures - Owners - 20 to 49 (%)
Housing units in structures - Owners - 50 or more (%)
Housing units in structures - Owners - Mobile home (%)
Housing units in structures - Owners - Boat, RV, van, etc. (%)
Housing units in structures - Renters - 1, detached (%)
Housing units in structures - Renters - 1, attached (%)
Housing units in structures - Renters - 2 (%)
Housing units in structures - Renters - 3 or 4 (%)
Housing units in structures - Renters - 5 to 9 (%)
Housing units in structures - Renters - 10 to 19 (%)
Housing units in structures - Renters - 20 to 49 (%)
Housing units in structures - Renters - 50 or more (%)
Housing units in structures - Renters - Mobile home (%)
Housing units in structures - Renters - Boat, RV, van, etc. (%)
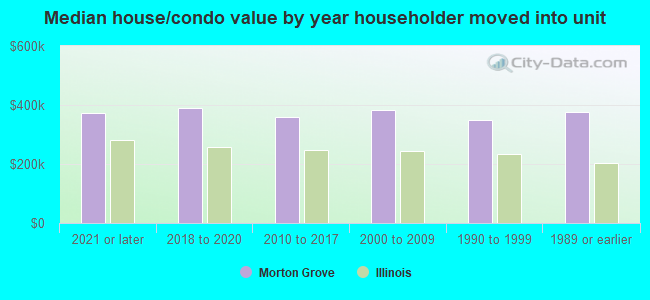
House/condo owner moved in on average (years ago)
Renter moved in on average (years ago)
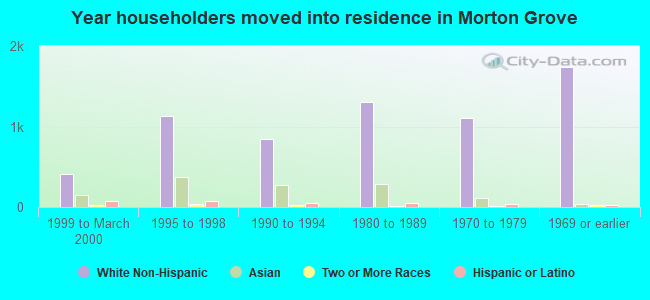
Year householder moved into unit - Moved in 1999 to March 2000 (%)
Year householder moved into unit - Moved in 1999 to March 2000 (%) - White
Year householder moved into unit - Moved in 1999 to March 2000 (%) - Black or African American
Year householder moved into unit - Moved in 1999 to March 2000 (%) - Asian
Year householder moved into unit - Moved in 1999 to March 2000 (%) - Hispanic or Latino
Year householder moved into unit - Moved in 1999 to March 2000 (%) - American Indian and Alaska Native
Year householder moved into unit - Moved in 1999 to March 2000 (%) - Multirace
Year householder moved into unit - Moved in 1999 to March 2000 (%) - Other Race
Year householder moved into unit - Moved in 1995 to 1998 (%)
Year householder moved into unit - Moved in 1995 to 1998 (%) - White
Year householder moved into unit - Moved in 1995 to 1998 (%) - Black or African American
Year householder moved into unit - Moved in 1995 to 1998 (%) - Asian
Year householder moved into unit - Moved in 1995 to 1998 (%) - Hispanic or Latino
Year householder moved into unit - Moved in 1995 to 1998 (%) - American Indian and Alaska Native
Year householder moved into unit - Moved in 1995 to 1998 (%) - Multirace
Year householder moved into unit - Moved in 1995 to 1998 (%) - Other Race
Year householder moved into unit - Moved in 1990 to 1994 (%)
Year householder moved into unit - Moved in 1990 to 1994 (%) - White
Year householder moved into unit - Moved in 1990 to 1994 (%) - Black or African American
Year householder moved into unit - Moved in 1990 to 1994 (%) - Asian
Year householder moved into unit - Moved in 1990 to 1994 (%) - Hispanic or Latino
Year householder moved into unit - Moved in 1990 to 1994 (%) - American Indian and Alaska Native
Year householder moved into unit - Moved in 1990 to 1994 (%) - Multirace
Year householder moved into unit - Moved in 1990 to 1994 (%) - Other Race
Year householder moved into unit - Moved in 1980 to 1989 (%)
Year householder moved into unit - Moved in 1980 to 1989 (%) - White
Year householder moved into unit - Moved in 1980 to 1989 (%) - Black or African American
Year householder moved into unit - Moved in 1980 to 1989 (%) - Asian
Year householder moved into unit - Moved in 1980 to 1989 (%) - Hispanic or Latino
Year householder moved into unit - Moved in 1980 to 1989 (%) - American Indian and Alaska Native
Year householder moved into unit - Moved in 1980 to 1989 (%) - Multirace
Year householder moved into unit - Moved in 1980 to 1989 (%) - Other Race
Year householder moved into unit - Moved in 1970 to 1979 (%)
Year householder moved into unit - Moved in 1970 to 1979 (%) - White
Year householder moved into unit - Moved in 1970 to 1979 (%) - Black or African American
Year householder moved into unit - Moved in 1970 to 1979 (%) - Asian
Year householder moved into unit - Moved in 1970 to 1979 (%) - Hispanic or Latino
Year householder moved into unit - Moved in 1970 to 1979 (%) - American Indian and Alaska Native
Year householder moved into unit - Moved in 1970 to 1979 (%) - Multirace
Year householder moved into unit - Moved in 1970 to 1979 (%) - Other Race
Year householder moved into unit - Moved in 1969 or earlier (%)
Year householder moved into unit - Moved in 1969 or earlier (%) - White
Year householder moved into unit - Moved in 1969 or earlier (%) - Black or African American
Year householder moved into unit - Moved in 1969 or earlier (%) - Asian
Year householder moved into unit - Moved in 1969 or earlier (%) - Hispanic or Latino
Year householder moved into unit - Moved in 1969 or earlier (%) - American Indian and Alaska Native
Year householder moved into unit - Moved in 1969 or earlier (%) - Multirace
Year householder moved into unit - Moved in 1969 or earlier (%) - Other Race
Housing units lacking complete plumbing facilities (%)
Housing units lacking complete kitchen facilities (%)
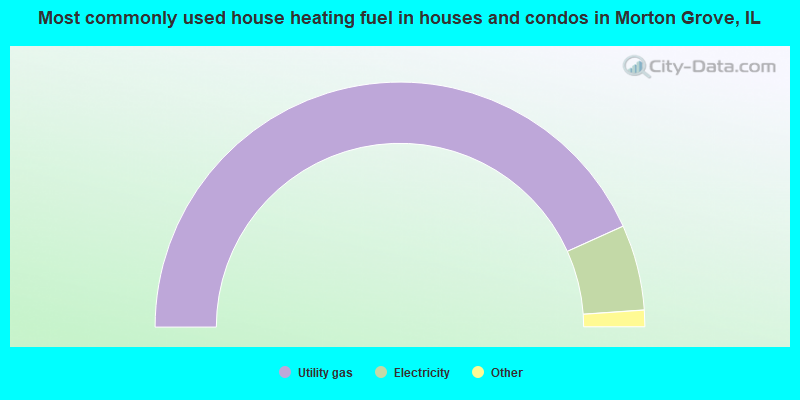
House heating fuel used in houses and condos - Utility gas (%)
House heating fuel used in houses and condos - Bottled, tank, or LP gas (%)
House heating fuel used in houses and condos - Electricity (%)
House heating fuel used in houses and condos - Fuel oil, kerosene, etc. (%)
House heating fuel used in houses and condos - Coal or coke (%)
House heating fuel used in houses and condos - Wood (%)
House heating fuel used in houses and condos - Solar energy (%)
House heating fuel used in houses and condos - Other fuel (%)
House heating fuel used in houses and condos - No fuel used (%)
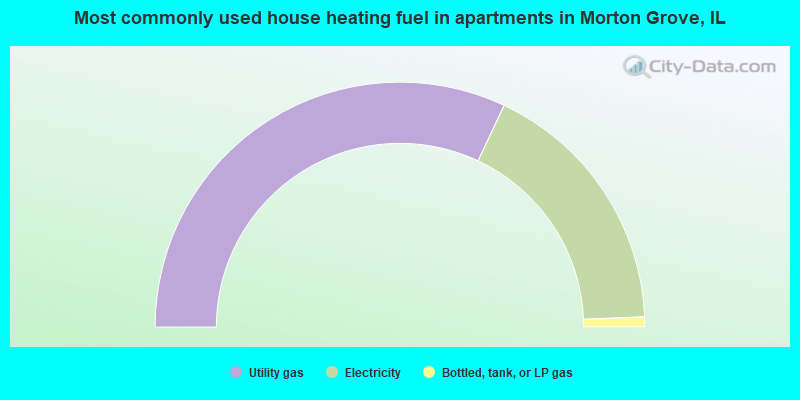
House heating fuel used in apartments - Utility gas (%)
House heating fuel used in apartments - Bottled, tank, or LP gas (%)
House heating fuel used in apartments - Electricity (%)
House heating fuel used in apartments - Fuel oil, kerosene, etc. (%)
House heating fuel used in apartments - Coal or coke (%)
House heating fuel used in apartments - Wood (%)
House heating fuel used in apartments - Solar energy (%)
House heating fuel used in apartments - Other fuel (%)
House heating fuel used in apartments - No fuel used (%)
Median year house/condo built: 1959Median year apartment built: 1971Household type by relationship:
Households: 24,356
Male householders: 5,004 (692 living alone ), Female householders: 3,958 (1,185 living alone )5,614 spouses (5,575 opposite-sex spouses ), 141 unmarried partners , (129 opposite-sex unmarried partners ), 7,352 children (7,046 natural , 83 adopted , 222 stepchildren ), 148 grandchildren , 403 brothers or sisters , 943 parents , 29 foster children , 414 other relatives , 171 non-relatives In group quarters: 174
Size of family households: 3,021 2-persons , 1,596 3-persons , 1,434 4-persons , 597 5-persons , 298 6-persons , 163 7-or-more-persons .
Size of nonfamily households: 2,016 1-person , 118 2-persons , 4 3-persons .
3,828 married couples with children. single-parent households (201 men , 671 women ).
49.6% of residents of Morton Grove speak English at home. of residents speak Spanish at home (76% speak English very well , 12% speak English well , 5% speak English not well , 7% don't speak English at all ).of residents speak other Indo-European language at home (67% speak English very well , 24% speak English well , 7% speak English not well , 2% don't speak English at all ).of residents speak Asian or Pacific Island language at home (57% speak English very well , 26% speak English well , 17% speak English not well , 1% don't speak English at all ).of residents speak other language at home (66% speak English very well , 13% speak English well , 3% speak English not well , 18% don't speak English at all ).
Foreign born population: 9,106 (37.4%)of them are naturalized citizens )
Median number of rooms in houses and condos:
Median number of rooms in apartments
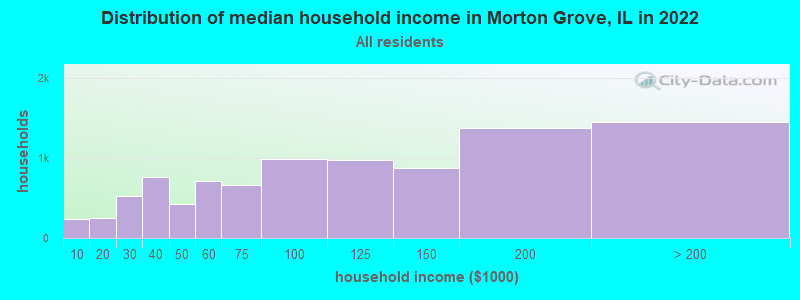
Morton Grove, IL household income distribution 242 Less than $10,000249 $10,000 to $19,999520 $20,000 to $29,999758 $30,000 to $39,999431 $40,000 to $49,999708 $50,000 to $59,999670 $60,000 to $74,999989 $75,000 to $99,999980 $100,000 to $124,999872 $125,000 to $149,9991,384 $150,000 to $199,9991,453 $200,000 or more
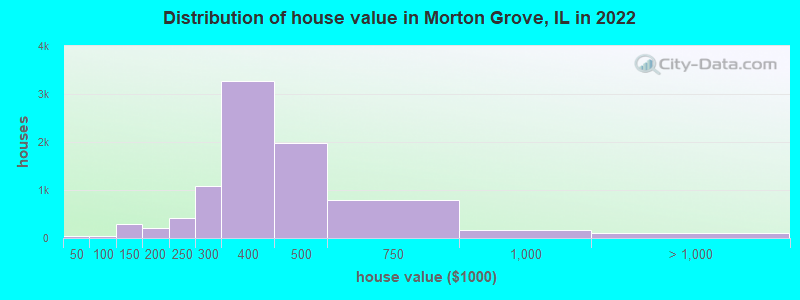
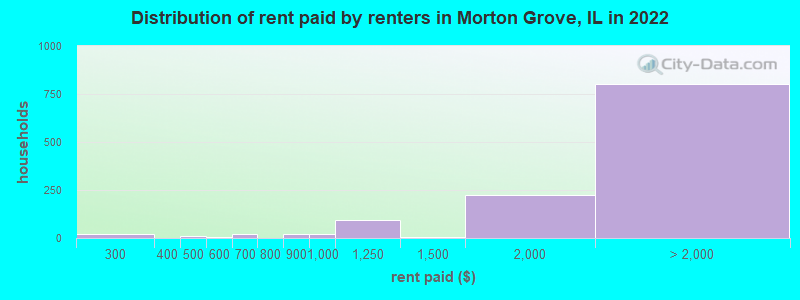
Home value of owner - occupied houses in 2022 in Morton Grove, IL 12 $20,000 to $24,99923 $40,000 to $49,9994 $50,000 to $59,99918 $70,000 to $79,999212 $100,000 to $124,99979 $125,000 to $149,99987 $150,000 to $174,999112 $175,000 to $199,999416 $200,000 to $249,9991,081 $250,000 to $299,9993,276 $300,000 to $399,9991,974 $400,000 to $499,999788 $500,000 to $749,999161 $750,000 to $999,99962 $1,000,000 to $1,499,99933 $2,000,000 or moreRent paid by renters in 2022 in Morton Grove, IL 9 $200 to $24911 $250 to $2998 $450 to $4995 $550 to $59921 $650 to $69919 $800 to $89922 $900 to $99991 $1,000 to $1,2495 $1,250 to $1,499222 $1,500 to $1,999490 $2,000 to $2,49998 $2,500 to $2,999213 No cash rent
Percentage of workers working in this county: 86.6%Number of people working at home: 1,958 (16.1% of all workers )
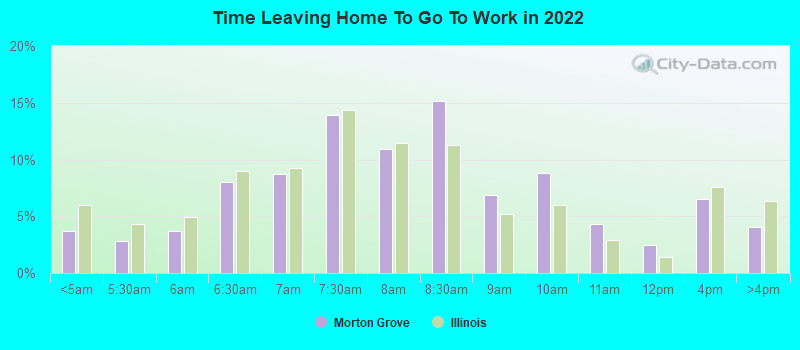
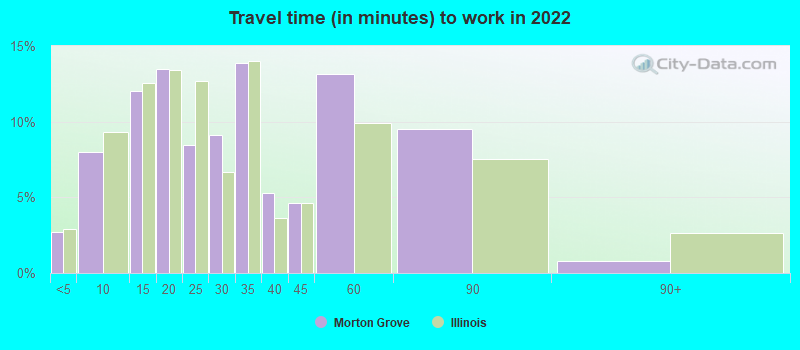
Travel time to work (commute)
Less than 5 minutes: 1875 to 9 minutes: 91910 to 14 minutes: 1,21415 to 19 minutes: 1,33420 to 24 minutes: 1,16725 to 29 minutes: 64130 to 34 minutes: 1,57935 to 39 minutes: 34540 to 44 minutes: 64945 to 59 minutes: 1,04960 to 89 minutes: 85290 or more minutes: 187
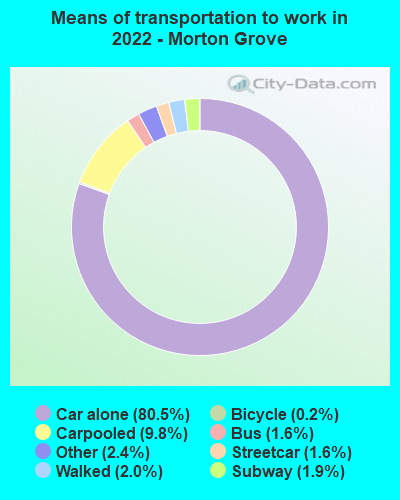
Means of transportation to work:
Drove a car alone: 7,531 (67.8%)Carpooled: 978 (8.8%)Bus : 142 (1.3%)Subway or elevated rail : 117 (1.1%)Long-distance train or commuter rail : 121 (1.1%)Taxi: 229 (2.1%)Bicycle: 20 (0.2%)Walked: 190 (1.7%)Worked at home: 1,958 (17.6%)
Unemployment by race in 2022
Unemployment rate for White non-Hispanic residents 2.4% Males2.8% FemalesUnemployment rate for American Indian and Alaska Native residents 46.6% FemalesUnemployment rate for Asian residents 0.8% Males4.1% FemalesUnemployment rate for two or more race residents 9.2% Males4.1% FemalesUnemployment rate for Hispanic or Latino residents 5.0% Males2.9% Females
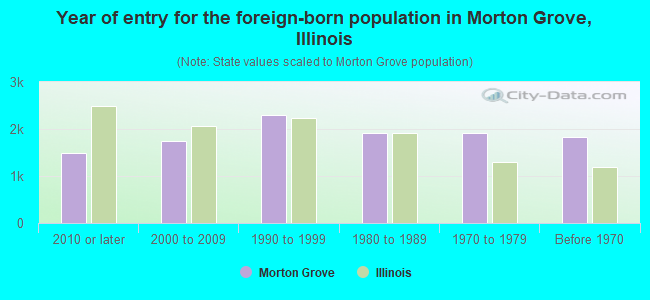
Year of entry for the foreign-born population in Morton Grove, Illinois
1,481 2010 or later 1,737 2000 to 2009 2,294 1990 to 1999 1,919 1980 to 1989 1,918 1970 to 1979 1,828 Before 1970
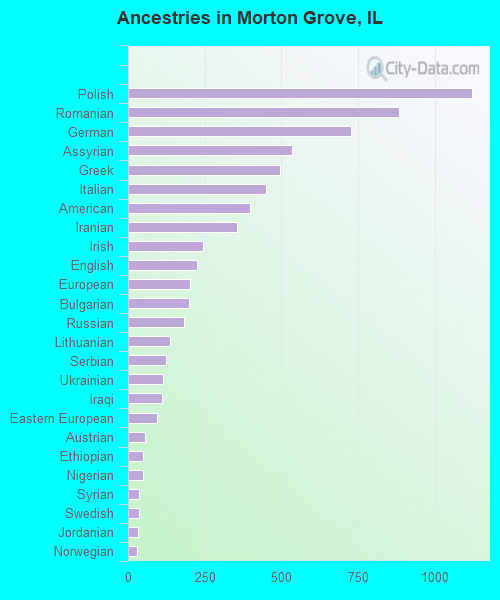
First ancestries reported:
Polish: 1,120 (7.7%)
Romanian: 884 (6.1%)
German: 726 (5.0%)
Assyrian: 534 (3.7%)
Greek: 494 (3.4%)
Italian: 448 (3.1%)
American: 398 (2.7%)
Iranian: 354 (2.4%)
Irish: 243 (1.7%)
English: 225 (1.5%)
European: 201 (1.4%)
Bulgarian: 200 (1.4%)
Russian: 181 (1.2%)
Lithuanian: 138 (0.9%)
Serbian: 123 (0.8%)
Ukrainian: 115 (0.8%)
Iraqi: 112 (0.8%)
Eastern European: 94 (0.6%)
Austrian: 54 (0.4%)
Ethiopian: 50 (0.3%)
Nigerian: 49 (0.3%)
Syrian: 37 (0.3%)
Swedish: 35 (0.2%)
Jordanian: 31 (0.2%)
Norwegian: 30 (0.2%)
Yugoslavian: 26 (0.2%)
Moroccan: 24 (0.2%)
Croatian: 23 (0.2%)
Haitian: 23 (0.2%)
Macedonian: 22 (0.2%)
Scottish: 18 (0.1%)
French: 18 (0.1%)
Lebanese: 17 (0.1%)
Luxembourger: 16 (0.1%)
Arab: 13 (0.09%)
Dutch: 11 (0.08%)
Czech: 10 (0.07%)
Egyptian: 10 (0.07%)
Latvian: 9 (0.06%)
Scandinavian: 9 (0.06%)
African: 8 (0.05%)
French Canadian: 7 (0.05%)
Finnish: 7 (0.05%)
Slovak: 6 (0.04%)
British: 5 (0.03%)
Armenian: 5 (0.03%)
Liberian: 5 (0.03%)
Hungarian: 4 (0.03%)
Israeli: 1 (0.01%)
Most common places of birth for foreign-born residents (%): India Morton Grove:
17.4% (1,581)Illinois:
9.2% (166,409)
Philippines Morton Grove:
13.0% (1,186)Illinois:
5.2% (93,003)
Pakistan Morton Grove:
7.3% (668)Illinois:
1.6% (29,519)
Poland Morton Grove:
6.7% (609)Illinois:
6.9% (124,474)
Iraq Morton Grove:
5.4% (488)Illinois:
0.7% (13,214)
Romania Morton Grove:
5.2% (471)Illinois:
0.8% (14,736)
Korea Morton Grove:
5.0% (452)Illinois:
2.2% (40,393)
Vietnam Morton Grove:
4.7% (430)Illinois:
1.2% (22,269)
Greece Morton Grove:
3.4% (306)Illinois:
0.6% (10,720)
Iran Morton Grove:
3.2% (290)Illinois:
0.4% (6,922)
Thailand Morton Grove:
2.2% (199)Illinois:
0.4% (7,323)
Bulgaria Morton Grove:
2.0% (178)Illinois:
0.8% (14,165)
Mexico Morton Grove:
1.8% (164)Illinois:
34.7% (626,958)
Place of birth for U.S.-born residents:
This state: 12,630Other state: 1,974Northeast: 424Midwest: 1,020South: 304West: 251 96.4% of Morton Grove residents lived in the same house 1 years ago.
Out of people who lived in different houses, 46.4% lived in this county.
Out of people who lived in different counties, 24.2% lived in Illinois.
Morton Grove:
96.4%State average:
88.3%
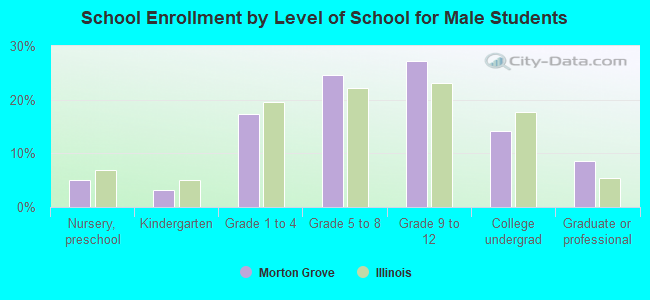
Education attainment for males 25 years and older:
No schooling: 357Nursery to 4th grade: 145th and 6th grade: 1467th and 8th grade: 1069th grade: 2410th grade: 8911th grade: 3412th grade, no diploma: 180High school graduate (or equivalency): 1,447Less than 1 year of college: 346Some college more than 1 year, no degree: 921Associate degree: 627Bachelor's degree: 2,855Master's degree: 1,267Professional school degree: 210Doctorate degree: 233
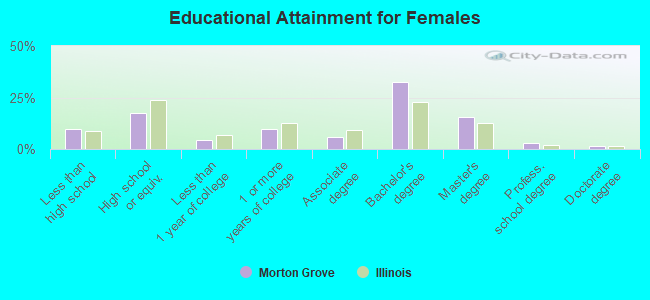
Education attainment for females 25 years and older:
No schooling: 209Nursery to 4th grade: 05th and 6th grade: 507th and 8th grade: 2139th grade: 1710th grade: 10011th grade: 2612th grade, no diploma: 311High school graduate (or equivalency): 1,645Less than 1 year of college: 419Some college more than 1 year, no degree: 915Associate degree: 545Bachelor's degree: 3,041Master's degree: 1,431Professional school degree: 251Doctorate degree: 149
Housing units in structures:
One, detached: 7,409One, attached: 422Two: 873 or 4: 425 to 9: 1110 to 19: 13620 to 49: 58250 or more: 935Mobile homes: 28Housing units lacking complete plumbing facilities in 2022: 0.2%Housing units lacking complete kitchen facilities in 2022: 1.2%House/condo owner moved in on average 15 years ago
Renter moved in on average 1 years ago
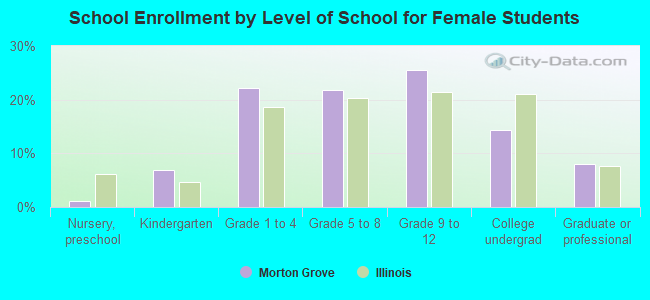
Private vs. public school enrollment:
Students in private schools in grades 1 to 8 (elementary and middle school): 391 Students in private schools in grades 9 to 12 (high school): 38 Students in private undergraduate colleges: 274