Miramar, FL (Florida) Houses and Residents
Estimated median house or condo value in 2022: $432,100 (it was $112,600 in 2000 )
Miramar:
$432,100Florida:
$354,100
Lower value quartile - upper value quartile: $327,900 - $599,600Mean price in 2022: Detached houses: $546,356 Here:
$546,356State:
$500,941
Townhouses or other attached units: $376,108 Here:
$376,108State:
$370,869
In 2-unit structures: $373,727 Here:
$373,727State:
$423,188
In 3-to-4-unit structures: $309,395 Here:
$309,395State:
$309,944
In 5-or-more-unit structures: $247,692 Here:
$247,692State:
$447,145
Mobile homes: $68,069 Here:
$68,069State:
$113,202
Total population: 134,989 (Urban population: 72,674, Rural population: 0)
Houses: 46,489 (45,016 occupied: 28,112 owner occupied, 16,904 renter occupied )
% of renters here:
38%State:
33%
Housing density: 1,576 houses/condos per square mile
Median price asked for vacant for-sale houses and condos in 2022: $339,349.
Median contract rent in 2022: $1,672 (lower quartile is $1,334, upper quartile is $1,965)
Median rent asked for vacant for-rent units in 2022: $900
Median gross rent in Miramar, FL in 2022: $1,805
Housing units in Miramar with a mortgage: 18,144 (1,129 second mortgage, 44 home equity loan, 892 both second mortgage and home equity loan )Houses without a mortgage: 384
Median household income for houses/condos with a mortgage: $116,577
Median household income for apartments without a mortgage: $83,894
Median monthly housing costs: $1,765
Data:
Median house or condo value ($)
Median house or condo value ($ change since 2000)
Median house or condo value ($) - White
Median house or condo value ($) - Black or African American
Median house or condo value ($) - Asian
Median house or condo value ($) - Hispanic or Latino
Median house or condo value ($) - American Indian and Alaska Native
Median house or condo value ($) - Multirace
Median house or condo value ($) - Other Race
Median price asked for mobile homes ($)
Household density (households per square mile)
Mean house or condo value by units in structure - 1, detached ($)
Mean house or condo value by units in structure - 1, attached ($)
Mean house or condo value by units in structure - 2 ($)
Mean house or condo value by units in structure by units in structure - 3 or 4 ($)
Mean house or condo value by units in structure - 5 or more ($)
Mean house or condo value by units in structure - Boat, RV, van, etc. ($)
Mean house or condo value by units in structure - Mobile home ($)
Median contract rent ($)
Median contract rent - Lower quartile ($)
Median contract rent - Upper quartile ($)
Median gross rent ($)
Urban houses (%)
Rural houses (%)
Houses occupied (%)
Houses occupied (% change since 2000)
Houses owner occupied (%)
Houses owner occupied (% change since 2000)
Houses renter occupied (%)
Houses renter occupied (% change since 2000)
Vacant housing units - For rent (%)
Vacant housing units - For rent (% change since 2000)
Vacant housing units - For sale only (%)
Vacant housing units - For sale only (% change since 2000)
Vacant housing units - Rented or sold, not occupied (%)
Vacant housing units - Rented or sold, not occupied (% change since 2000)
Vacant housing units - For seasonal, recreational, or occasional use (%)
Vacant housing units - For seasonal, recreational, or occasional use (% change since 2000)
Vacant housing units - For migrant workers (%)
Vacant housing units - For migrant workers (% change since 2000)
Vacant housing units - Other vacant (%)
Vacant housing units - Other vacant (% change since 2000)
Median monthly housing costs ($)
Median household income for houses/condos with a mortgage ($)
Median household income for houses/condos without a mortgage ($)
Median household income ($)
Median household income ($) - White
Median household income ($) - Black or African American
Median household income ($) - Asian
Median household income ($) - Hispanic or Latino
Median household income ($) - American Indian and Alaska Native
Median household income ($) - Multirace
Median household income ($) - Other Race
Mortgage status - with mortgage (%)
Mortgage status - with second mortgage (%)
Mortgage status - with home equity loan (%)
Mortgage status - with both second mortgage and home equity loan (%)
Mortgage status - without a mortgage (%)
Median year house/condo built
Median year apartment built
Household type by relationship - Male householder living alone (%)
Household type by relationship - Male householder not living alone (%)
Household type by relationship - Female householder living alone (%)
Household type by relationship - Female householder not living alone (%)
Household type by relationship - Opposite-Sex spouse (%)
Household type by relationship - Same-Sex spouse (%)
Household type by relationship - Opposite-Sex unmarried partner (%)
Household type by relationship - Same-Sex unmarried partner (%)
Household type by relationship - In group quarters (%)
Size of family households - 2-person household (%)
Size of family households - 3-person household (%)
Size of family households - 4-person household (%)
Size of family households - 5-person household (%)
Size of family households - 6-person household (%)
Size of family households - 7-or-more-person household (%)
Size of nonfamily households - 1-person household (%)
Size of nonfamily households - 2-person household (%)
Size of nonfamily households - 3-person household (%)
Size of nonfamily households - 4-person household (%)
Size of nonfamily households - 5-person household (%)
Size of nonfamily households - 6-person household (%)
Size of nonfamily households - 7-or-moreperson household (%)
Year house built - Built 2010 or later (%)
Year house built - Built 2000 to 2009 (%)
Year house built - Built 1990 to 1999 (%)
Year house built - Built 1980 to 1989 (%)
Year house built - Built 1970 to 1979 (%)
Year house built - Built 1960 to 1969 (%)
Year house built - Built 1950 to 1959 (%)
Year house built - Built 1940 to 1949 (%)
Year house built - Built 1939 or earlier (%)
Median number of rooms in houses and condos
Median number of rooms in apartments
Median number of bedrooms in owner occupied houses
Mean number of bedrooms in owner occupied houses
Median number of bedrooms in renter occupied houses
Mean number of bedrooms in renter occupied houses
Median number of vehichles in owner occupied houses
Mean number of vehichles in owner occupied houses
Median number of vehichles in renter occupied houses
Mean number of vehichles in renter occupied houses
Rooms in owner-occupied houses - 1 room (%)
Rooms in owner-occupied houses - 2 rooms (%)
Rooms in owner-occupied houses - 3 rooms (%)
Rooms in owner-occupied houses - 4 rooms (%)
Rooms in owner-occupied houses - 5 rooms (%)
Rooms in owner-occupied houses - 6 rooms (%)
Rooms in owner-occupied houses - 7 rooms (%)
Rooms in owner-occupied houses - 8 rooms (%)
Rooms in owner-occupied houses - 9+ rooms (%)
Rooms in renter-occupied houses - 1 room (%)
Rooms in renter-occupied houses - 2 rooms (%)
Rooms in renter-occupied houses - 3 rooms (%)
Rooms in renter-occupied houses - 4 rooms (%)
Rooms in renter-occupied houses - 5 rooms (%)
Rooms in renter-occupied houses - 6 rooms (%)
Rooms in renter-occupied houses - 7 rooms (%)
Rooms in renter-occupied houses - 8 rooms (%)
Rooms in renter-occupied houses - 9+ rooms (%)
Bedrooms in owner-occupied houses - no bedrooms (%)
Bedrooms in owner-occupied houses - 1 bedroom (%)
Bedrooms in owner-occupied houses - 2 bedrooms (%)
Bedrooms in owner-occupied houses - 3 bedrooms (%)
Bedrooms in owner-occupied houses - 4 bedrooms (%)
Bedrooms in owner-occupied houses - 5+ bedrooms (%)
Bedrooms in renter-occupied houses - no bedrooms (%)
Bedrooms in renter-occupied houses - 1 bedroom (%)
Bedrooms in renter-occupied houses - 2 bedrooms (%)
Bedrooms in renter-occupied houses - 3 bedrooms (%)
Bedrooms in renter-occupied houses - 4 bedrooms (%)
Bedrooms in renter-occupied houses - 5+ bedrooms (%)
Vehicles available in owner-occupied houses - no vehicle available (%)
Vehicles available in owner-occupied houses - 1 vehicle available(%)
Vehicles available in owner-occupied houses - 2 Vehicles available (%)
Vehicles available in owner-occupied houses - 3 Vehicles available (%)
Vehicles available in owner-occupied houses - 4 Vehicles available (%)
Vehicles available in owner-occupied houses - 5+ Vehicles available (%)
Vehicles available in renter-occupied houses - no vehicle available (%)
Vehicles available in renter-occupied houses - 1 vehicle available (%)
Vehicles available in renter-occupied houses - 2 Vehicles available (%)
Vehicles available in renter-occupied houses - 3 Vehicles available (%)
Vehicles available in renter-occupied houses - 4 Vehicles available (%)
Vehicles available in renter-occupied houses - 5+ Vehicles available (%)
Housing units in structures - 1, detached (%)
Housing units in structures - 1, attached (%)
Housing units in structures - 2 (%)
Housing units in structures - 3 or 4 (%)
Housing units in structures - 5 to 9 (%)
Housing units in structures - 10 to 19 (%)
Housing units in structures - 20 to 49 (%)
Housing units in structures - 50 or more (%)
Housing units in structures - Mobile home (%)
Housing units in structures - Boat, RV, van, etc. (%)
Housing units in structures - Owners - 1, detached (%)
Housing units in structures - Owners - 1, attached (%)
Housing units in structures - Owners - 2 (%)
Housing units in structures - Owners - 3 or 4 (%)
Housing units in structures - Owners - 5 to 9 (%)
Housing units in structures - Owners - 10 to 19 (%)
Housing units in structures - Owners - 20 to 49 (%)
Housing units in structures - Owners - 50 or more (%)
Housing units in structures - Owners - Mobile home (%)
Housing units in structures - Owners - Boat, RV, van, etc. (%)
Housing units in structures - Renters - 1, detached (%)
Housing units in structures - Renters - 1, attached (%)
Housing units in structures - Renters - 2 (%)
Housing units in structures - Renters - 3 or 4 (%)
Housing units in structures - Renters - 5 to 9 (%)
Housing units in structures - Renters - 10 to 19 (%)
Housing units in structures - Renters - 20 to 49 (%)
Housing units in structures - Renters - 50 or more (%)
Housing units in structures - Renters - Mobile home (%)
Housing units in structures - Renters - Boat, RV, van, etc. (%)
House/condo owner moved in on average (years ago)
Renter moved in on average (years ago)
Year householder moved into unit - Moved in 1999 to March 2000 (%)
Year householder moved into unit - Moved in 1999 to March 2000 (%) - White
Year householder moved into unit - Moved in 1999 to March 2000 (%) - Black or African American
Year householder moved into unit - Moved in 1999 to March 2000 (%) - Asian
Year householder moved into unit - Moved in 1999 to March 2000 (%) - Hispanic or Latino
Year householder moved into unit - Moved in 1999 to March 2000 (%) - American Indian and Alaska Native
Year householder moved into unit - Moved in 1999 to March 2000 (%) - Multirace
Year householder moved into unit - Moved in 1999 to March 2000 (%) - Other Race
Year householder moved into unit - Moved in 1995 to 1998 (%)
Year householder moved into unit - Moved in 1995 to 1998 (%) - White
Year householder moved into unit - Moved in 1995 to 1998 (%) - Black or African American
Year householder moved into unit - Moved in 1995 to 1998 (%) - Asian
Year householder moved into unit - Moved in 1995 to 1998 (%) - Hispanic or Latino
Year householder moved into unit - Moved in 1995 to 1998 (%) - American Indian and Alaska Native
Year householder moved into unit - Moved in 1995 to 1998 (%) - Multirace
Year householder moved into unit - Moved in 1995 to 1998 (%) - Other Race
Year householder moved into unit - Moved in 1990 to 1994 (%)
Year householder moved into unit - Moved in 1990 to 1994 (%) - White
Year householder moved into unit - Moved in 1990 to 1994 (%) - Black or African American
Year householder moved into unit - Moved in 1990 to 1994 (%) - Asian
Year householder moved into unit - Moved in 1990 to 1994 (%) - Hispanic or Latino
Year householder moved into unit - Moved in 1990 to 1994 (%) - American Indian and Alaska Native
Year householder moved into unit - Moved in 1990 to 1994 (%) - Multirace
Year householder moved into unit - Moved in 1990 to 1994 (%) - Other Race
Year householder moved into unit - Moved in 1980 to 1989 (%)
Year householder moved into unit - Moved in 1980 to 1989 (%) - White
Year householder moved into unit - Moved in 1980 to 1989 (%) - Black or African American
Year householder moved into unit - Moved in 1980 to 1989 (%) - Asian
Year householder moved into unit - Moved in 1980 to 1989 (%) - Hispanic or Latino
Year householder moved into unit - Moved in 1980 to 1989 (%) - American Indian and Alaska Native
Year householder moved into unit - Moved in 1980 to 1989 (%) - Multirace
Year householder moved into unit - Moved in 1980 to 1989 (%) - Other Race
Year householder moved into unit - Moved in 1970 to 1979 (%)
Year householder moved into unit - Moved in 1970 to 1979 (%) - White
Year householder moved into unit - Moved in 1970 to 1979 (%) - Black or African American
Year householder moved into unit - Moved in 1970 to 1979 (%) - Asian
Year householder moved into unit - Moved in 1970 to 1979 (%) - Hispanic or Latino
Year householder moved into unit - Moved in 1970 to 1979 (%) - American Indian and Alaska Native
Year householder moved into unit - Moved in 1970 to 1979 (%) - Multirace
Year householder moved into unit - Moved in 1970 to 1979 (%) - Other Race
Year householder moved into unit - Moved in 1969 or earlier (%)
Year householder moved into unit - Moved in 1969 or earlier (%) - White
Year householder moved into unit - Moved in 1969 or earlier (%) - Black or African American
Year householder moved into unit - Moved in 1969 or earlier (%) - Asian
Year householder moved into unit - Moved in 1969 or earlier (%) - Hispanic or Latino
Year householder moved into unit - Moved in 1969 or earlier (%) - American Indian and Alaska Native
Year householder moved into unit - Moved in 1969 or earlier (%) - Multirace
Year householder moved into unit - Moved in 1969 or earlier (%) - Other Race
Housing units lacking complete plumbing facilities (%)
Housing units lacking complete kitchen facilities (%)
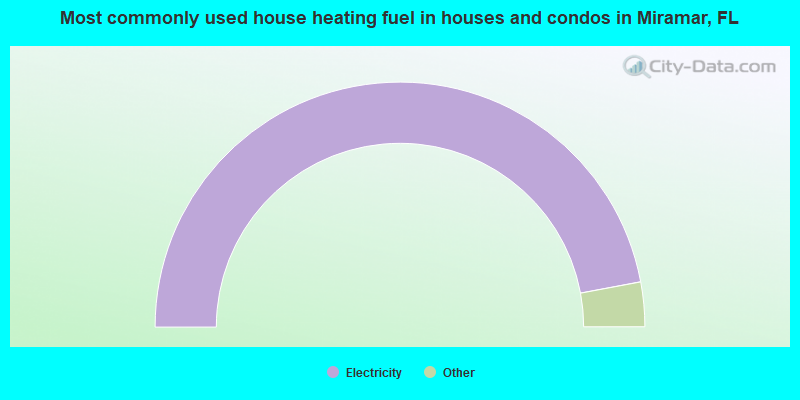
House heating fuel used in houses and condos - Utility gas (%)
House heating fuel used in houses and condos - Bottled, tank, or LP gas (%)
House heating fuel used in houses and condos - Electricity (%)
House heating fuel used in houses and condos - Fuel oil, kerosene, etc. (%)
House heating fuel used in houses and condos - Coal or coke (%)
House heating fuel used in houses and condos - Wood (%)
House heating fuel used in houses and condos - Solar energy (%)
House heating fuel used in houses and condos - Other fuel (%)
House heating fuel used in houses and condos - No fuel used (%)
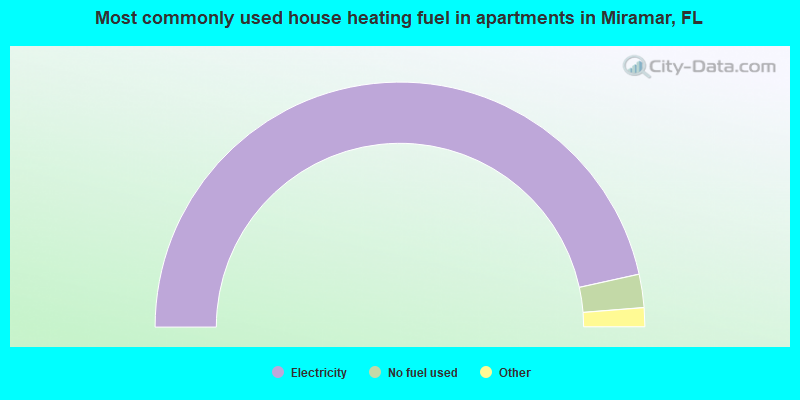
House heating fuel used in apartments - Utility gas (%)
House heating fuel used in apartments - Bottled, tank, or LP gas (%)
House heating fuel used in apartments - Electricity (%)
House heating fuel used in apartments - Fuel oil, kerosene, etc. (%)
House heating fuel used in apartments - Coal or coke (%)
House heating fuel used in apartments - Wood (%)
House heating fuel used in apartments - Solar energy (%)
House heating fuel used in apartments - Other fuel (%)
House heating fuel used in apartments - No fuel used (%)
Latest news about housing in Miramar, FL collected exclusively by city-data.com from local newspapers, TV, and radio stations
Median year house/condo built: 1995Median year apartment built: 1996Household type by relationship:
Households: 137,208
Male householders: 20,949 (2,963 living alone ), Female householders: 24,067 (4,910 living alone )21,472 spouses (21,330 opposite-sex spouses ), 4,153 unmarried partners , (4,064 opposite-sex unmarried partners ), 45,816 children (43,857 natural , 582 adopted , 1,377 stepchildren ), 4,237 grandchildren , 2,226 brothers or sisters , 5,657 parents , 103 foster children , 4,157 other relatives , 3,991 non-relatives In group quarters: 380
Size of family households: 10,253 2-persons , 10,479 3-persons , 7,239 4-persons , 2,215 5-persons , 1,272 6-persons , 1,691 7-or-more-persons .
Size of nonfamily households: 7,873 1-person , 3,461 2-persons , 288 3-persons , 77 4-persons , 168 6-persons .
13,528 married couples with children. single-parent households (2,232 men , 7,242 women ).
51.3% of residents of Miramar speak English at home. of residents speak Spanish at home (68% speak English very well , 16% speak English well , 9% speak English not well , 6% don't speak English at all ).of residents speak other Indo-European language at home (70% speak English very well , 20% speak English well , 7% speak English not well , 3% don't speak English at all ).of residents speak Asian or Pacific Island language at home (70% speak English very well , 24% speak English well , 5% speak English not well ).of residents speak other language at home (79% speak English very well , 16% speak English well , 6% speak English not well ).
Foreign born population: 58,705 (42.8%)of them are naturalized citizens )
Median number of rooms in houses and condos:
Median number of rooms in apartments
Owner-occupied Renter-occupied
Bedrooms in owner-occupied houses and condos in Miramar, Florida
121 no bedroom 81 1 bedroom 5,410 2 bedrooms 12,243 3 bedrooms 6,805 4 bedrooms 3,452 5+ bedrooms
Bedrooms in renter-occupied apartments in Miramar, Florida
1,279 no bedroom 4,855 1 bedroom 5,253 2 bedrooms 4,150 3 bedrooms 1,367 4 bedrooms 0 5+ bedrooms
Owner-occupied Renter-occupied
Rooms in owner-occupied houses in Miramar, Florida
121 1 room 0 2 rooms 802 3 rooms 4,942 4 rooms 6,063 5 rooms 5,227 6 rooms 3,678 7 rooms 4,132 8 rooms 3,147 9+ rooms
Rooms in renter-occupied apartments in Miramar, Florida
1,279 1 room 631 2 rooms 4,392 3 rooms 3,995 4 rooms 3,114 5 rooms 2,253 6 rooms 684 7 rooms 444 8 rooms 112 9+ rooms
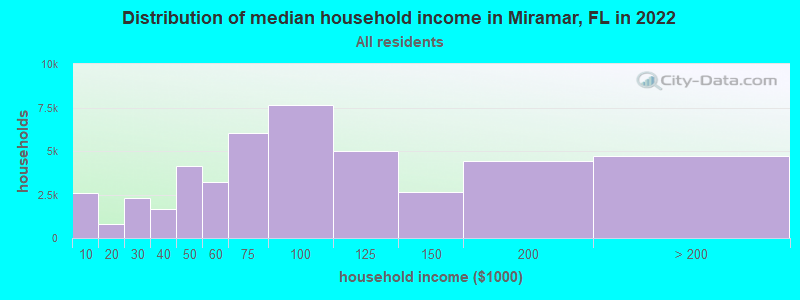
Miramar, FL household income distribution 2,566 Less than $10,000781 $10,000 to $19,9992,281 $20,000 to $29,9991,656 $30,000 to $39,9994,112 $40,000 to $49,9993,191 $50,000 to $59,9996,028 $60,000 to $74,9997,640 $75,000 to $99,9995,021 $100,000 to $124,9992,646 $125,000 to $149,9994,409 $150,000 to $199,9994,685 $200,000 or more
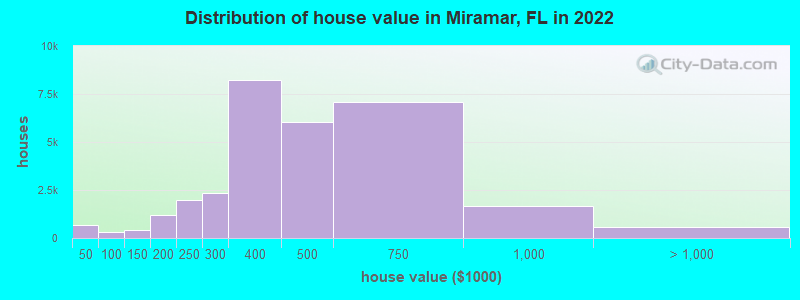
Home value of owner - occupied houses in 2022 in Miramar, FL 262 Less than $10,0006 $10,000 to $14,99930 $15,000 to $19,999214 $25,000 to $29,99927 $30,000 to $34,99956 $35,000 to $39,99962 $40,000 to $49,99949 $50,000 to $59,99945 $60,000 to $69,99960 $70,000 to $79,99935 $80,000 to $89,99943 $90,000 to $99,999259 $100,000 to $124,999148 $125,000 to $149,999708 $150,000 to $174,999513 $175,000 to $199,9992,005 $200,000 to $249,9992,338 $250,000 to $299,9998,226 $300,000 to $399,9996,061 $400,000 to $499,9997,105 $500,000 to $749,9991,685 $750,000 to $999,999415 $1,000,000 to $1,499,99962 $1,500,000 to $1,999,999111 $2,000,000 or moreRent paid by renters in 2022 in Miramar, FL 64 $200 to $24950 $300 to $34948 $450 to $49990 $500 to $54914 $600 to $649224 $650 to $69912 $700 to $74919 $750 to $79961 $800 to $899131 $900 to $9991,203 $1,000 to $1,2492,586 $1,250 to $1,4994,474 $1,500 to $1,9992,790 $2,000 to $2,4991,390 $2,500 to $2,999183 $3,000 to $3,499110 $3,500 or more327 No cash rent
Percentage of workers working in this county: 66.2%Number of people working at home: 6,586 (8.9% of all workers )
Travel time to work (commute)
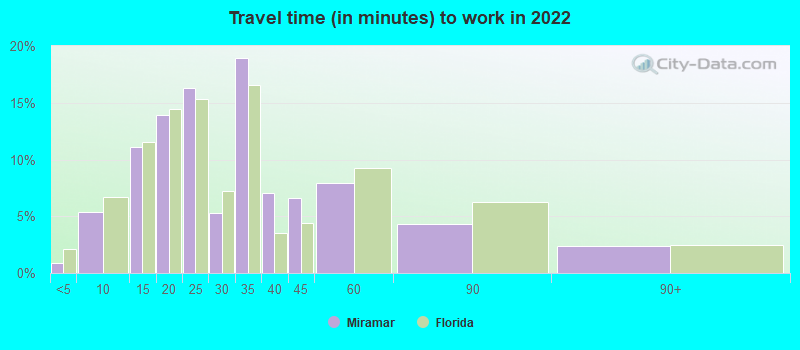
Less than 5 minutes: 6175 to 9 minutes: 1,94610 to 14 minutes: 6,57015 to 19 minutes: 5,09720 to 24 minutes: 15,68725 to 29 minutes: 4,36830 to 34 minutes: 14,68335 to 39 minutes: 2,90340 to 44 minutes: 2,82545 to 59 minutes: 6,84660 to 89 minutes: 4,88490 or more minutes: 1,629
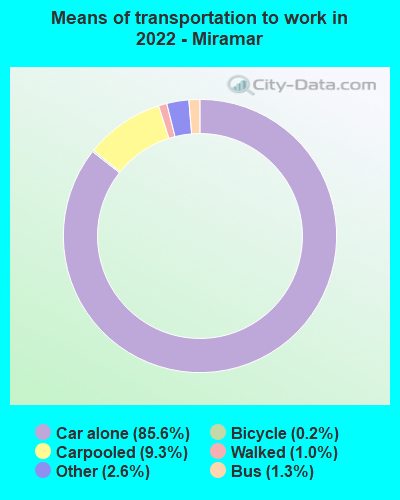
Means of transportation to work:
Drove a car alone: 33,381 (71.7%)Carpooled: 4,115 (8.8%)Bus : 539 (1.2%)Subway or elevated rail : 11 (0.0%)Light rail, streetcar or trolley : 7 (0.0%)Taxi: 1,074 (2.3%)Bicycle: 96 (0.2%)Walked: 471 (1.0%)Worked at home: 6,586 (14.1%)
Unemployment by race in 2022
Unemployment rate for White non-Hispanic residents 3.2% Males3.4% FemalesUnemployment rate for Black residents 11.3% Males3.9% FemalesUnemployment rate for Asian residents 2.6% Males0.8% FemalesUnemployment rate for other race residents 0.6% Males7.8% FemalesUnemployment rate for two or more race residents 3.0% Males2.9% FemalesUnemployment rate for Hispanic or Latino residents 1.9% Males3.5% Females
Year of entry for the foreign-born population in Miramar, Florida
13,268 2010 or later 11,449 2000 to 2009 11,070 1990 to 1999 9,931 1980 to 1989 5,588 1970 to 1979 3,668 Before 1970
First ancestries reported:
Jamaican: 12,805 (13.5%)
Haitian: 12,644 (13.4%)
American: 9,463 (10.0%)
Italian: 877 (0.9%)
Trinidadian and Tobagonian: 686 (0.7%)
English: 630 (0.7%)
German: 545 (0.6%)
Belizean: 426 (0.5%)
Nigerian: 310 (0.3%)
Guyanese: 308 (0.3%)
Israeli: 305 (0.3%)
African: 299 (0.3%)
Bahamian: 286 (0.3%)
Irish: 265 (0.3%)
British West Indian: 263 (0.3%)
Polish: 255 (0.3%)
Brazilian: 237 (0.3%)
Dutch: 235 (0.2%)
U.S. Virgin Islander: 215 (0.2%)
Croatian: 199 (0.2%)
West Indian: 164 (0.2%)
Portuguese: 159 (0.2%)
Canadian: 149 (0.2%)
Romanian: 135 (0.1%)
Russian: 133 (0.1%)
Belgian: 130 (0.1%)
Ethiopian: 128 (0.1%)
Barbadian: 120 (0.1%)
European: 101 (0.1%)
Sierra Leonean: 90 (0.10%)
Turkish: 80 (0.08%)
Czech: 57 (0.06%)
Jordanian: 56 (0.06%)
Iranian: 55 (0.06%)
Eastern European: 53 (0.06%)
Swedish: 48 (0.05%)
Scotch-Irish: 45 (0.05%)
Lebanese: 43 (0.05%)
Norwegian: 41 (0.04%)
Palestinian: 37 (0.04%)
Greek: 35 (0.04%)
French: 26 (0.03%)
Northern European: 22 (0.02%)
French Canadian: 17 (0.02%)
Danish: 11 (0.01%)
British: 11 (0.01%)
Swiss: 11 (0.01%)
Most common places of birth for foreign-born residents (%): Jamaica Miramar:
18.6% (10,341)Florida:
5.0% (227,319)
Haiti Miramar:
16.3% (9,032)Florida:
7.5% (342,375)
Cuba Miramar:
14.8% (8,232)Florida:
22.0% (1,006,576)
Colombia Miramar:
7.6% (4,246)Florida:
6.5% (298,669)
Venezuela Miramar:
6.0% (3,350)Florida:
5.7% (262,042)
Dominican Republic Miramar:
3.7% (2,053)Florida:
3.0% (137,727)
Honduras Miramar:
2.2% (1,201)Florida:
2.3% (107,160)
Nicaragua Miramar:
2.0% (1,125)Florida:
2.3% (105,066)
India Miramar:
1.9% (1,056)Florida:
2.1% (94,349)
Trinidad and Tobago Miramar:
1.9% (1,037)Florida:
1.0% (43,642)
Philippines Miramar:
1.9% (1,030)Florida:
1.8% (84,403)
Peru Miramar:
1.7% (929)Florida:
2.1% (96,693)
Ecuador Miramar:
1.6% (864)Florida:
1.2% (54,585)
Place of birth for U.S.-born residents:
This state: 57,445Other state: 16,976Northeast: 8,802Midwest: 2,845South: 4,851West: 478 93.5% of Miramar residents lived in the same house 1 years ago.
Out of people who lived in different houses, 30.0% lived in this county.
Out of people who lived in different counties, 78.0% lived in Florida.
Miramar:
93.5%State average:
86.3%
Education attainment for males 25 years and older:
No schooling: 160Nursery to 4th grade: 3555th and 6th grade: 5447th and 8th grade: 3789th grade: 70510th grade: 011th grade: 85512th grade, no diploma: 1,694High school graduate (or equivalency): 13,191Less than 1 year of college: 1,792Some college more than 1 year, no degree: 5,127Associate degree: 4,355Bachelor's degree: 11,213Master's degree: 2,791Professional school degree: 1,434Doctorate degree: 640
Education attainment for females 25 years and older:
No schooling: 1,401Nursery to 4th grade: 5415th and 6th grade: 4177th and 8th grade: 2219th grade: 1,18610th grade: 1,19011th grade: 68912th grade, no diploma: 854High school graduate (or equivalency): 13,494Less than 1 year of college: 2,483Some college more than 1 year, no degree: 4,203Associate degree: 4,639Bachelor's degree: 11,947Master's degree: 5,169Professional school degree: 1,506Doctorate degree: 896
Housing units in structures:
One, detached: 29,261One, attached: 5,442Two: 1,1483 or 4: 7525 to 9: 1,76110 to 19: 2,85820 to 49: 2,10650 or more: 2,979Mobile homes: 182Housing units lacking complete plumbing facilities in 2022: 0.8%Housing units lacking complete kitchen facilities in 2022: 2.9%House/condo owner moved in on average 14 years ago
Renter moved in on average 2 years ago
Private vs. public school enrollment:
Students in private schools in grades 1 to 8 (elementary and middle school): 1,261 Students in private schools in grades 9 to 12 (high school): 313 Students in private undergraduate colleges: 1,831