Middle River, MD (Maryland) Houses and Residents
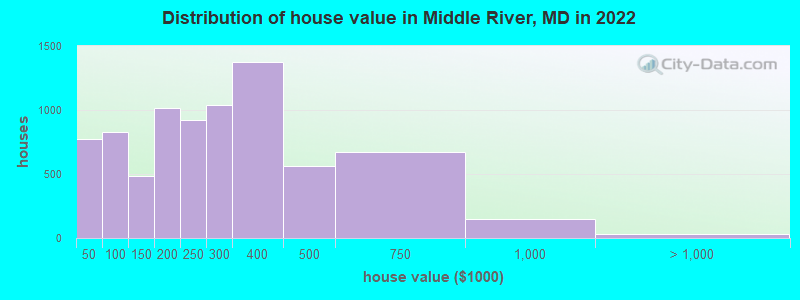
Estimated median house or condo value in 2022: $253,987 (it was $83,800 in 2000 )
Middle River:
$253,987Maryland:
$398,100
Lower value quartile - upper value quartile: $152,360 - $357,743Mean price in 2022: Detached houses: $306,117 Here:
$306,117State:
$526,819
Townhouses or other attached units: $228,103 Here:
$228,103State:
$328,305
Mobile homes: $75,326 Here:
$75,326State:
$89,353
Occupied boats, RVs, vans, etc.: $178,708 Here:
$178,708State:
$254,500
Total population: 25,191 (Urban population: 23,908, Rural population: 0)
Houses: 13,305 (12,139 occupied: 7,756 owner occupied, 4,652 renter occupied )
% of renters here:
37%State:
32%
Housing density: 1,722 houses/condos per square mile
Median price asked for vacant for-sale houses and condos in 2022: $141,491.
Median contract rent in 2022: $1,305 (lower quartile is $1,040, upper quartile is $1,611)
Median rent asked for vacant for-rent units in 2022: $913
Median gross rent in Middle River, MD in 2022: $1,540
Housing units in Middle River with a mortgage: 5,166 (250 second mortgage, 0 home equity loan, 221 both second mortgage and home equity loan )Houses without a mortgage: 71
Median household income for houses/condos with a mortgage: $99,466
Median household income for apartments without a mortgage: $56,440
Median monthly housing costs: $1,398
Data:
Median house or condo value ($)
Median house or condo value ($ change since 2000)
Median house or condo value ($) - White
Median house or condo value ($) - Black or African American
Median house or condo value ($) - Asian
Median house or condo value ($) - Hispanic or Latino
Median house or condo value ($) - American Indian and Alaska Native
Median house or condo value ($) - Multirace
Median house or condo value ($) - Other Race
Median price asked for mobile homes ($)
Household density (households per square mile)
Mean house or condo value by units in structure - 1, detached ($)
Mean house or condo value by units in structure - 1, attached ($)
Mean house or condo value by units in structure - 2 ($)
Mean house or condo value by units in structure by units in structure - 3 or 4 ($)
Mean house or condo value by units in structure - 5 or more ($)
Mean house or condo value by units in structure - Boat, RV, van, etc. ($)
Mean house or condo value by units in structure - Mobile home ($)
Median contract rent ($)
Median contract rent - Lower quartile ($)
Median contract rent - Upper quartile ($)
Median gross rent ($)
Urban houses (%)
Rural houses (%)
Houses occupied (%)
Houses occupied (% change since 2000)
Houses owner occupied (%)
Houses owner occupied (% change since 2000)
Houses renter occupied (%)
Houses renter occupied (% change since 2000)
Vacant housing units - For rent (%)
Vacant housing units - For rent (% change since 2000)
Vacant housing units - For sale only (%)
Vacant housing units - For sale only (% change since 2000)
Vacant housing units - Rented or sold, not occupied (%)
Vacant housing units - Rented or sold, not occupied (% change since 2000)
Vacant housing units - For seasonal, recreational, or occasional use (%)
Vacant housing units - For seasonal, recreational, or occasional use (% change since 2000)
Vacant housing units - For migrant workers (%)
Vacant housing units - For migrant workers (% change since 2000)
Vacant housing units - Other vacant (%)
Vacant housing units - Other vacant (% change since 2000)
Median monthly housing costs ($)
Median household income for houses/condos with a mortgage ($)
Median household income for houses/condos without a mortgage ($)
Median household income ($)
Median household income ($) - White
Median household income ($) - Black or African American
Median household income ($) - Asian
Median household income ($) - Hispanic or Latino
Median household income ($) - American Indian and Alaska Native
Median household income ($) - Multirace
Median household income ($) - Other Race
Mortgage status - with mortgage (%)
Mortgage status - with second mortgage (%)
Mortgage status - with home equity loan (%)
Mortgage status - with both second mortgage and home equity loan (%)
Mortgage status - without a mortgage (%)
Median year house/condo built
Median year apartment built
Household type by relationship - Male householder living alone (%)
Household type by relationship - Male householder not living alone (%)
Household type by relationship - Female householder living alone (%)
Household type by relationship - Female householder not living alone (%)
Household type by relationship - Opposite-Sex spouse (%)
Household type by relationship - Same-Sex spouse (%)
Household type by relationship - Opposite-Sex unmarried partner (%)
Household type by relationship - Same-Sex unmarried partner (%)
Household type by relationship - In group quarters (%)
Size of family households - 2-person household (%)
Size of family households - 3-person household (%)
Size of family households - 4-person household (%)
Size of family households - 5-person household (%)
Size of family households - 6-person household (%)
Size of family households - 7-or-more-person household (%)
Size of nonfamily households - 1-person household (%)
Size of nonfamily households - 2-person household (%)
Size of nonfamily households - 3-person household (%)
Size of nonfamily households - 4-person household (%)
Size of nonfamily households - 5-person household (%)
Size of nonfamily households - 6-person household (%)
Size of nonfamily households - 7-or-moreperson household (%)
Year house built - Built 2010 or later (%)
Year house built - Built 2000 to 2009 (%)
Year house built - Built 1990 to 1999 (%)
Year house built - Built 1980 to 1989 (%)
Year house built - Built 1970 to 1979 (%)
Year house built - Built 1960 to 1969 (%)
Year house built - Built 1950 to 1959 (%)
Year house built - Built 1940 to 1949 (%)
Year house built - Built 1939 or earlier (%)
Median number of rooms in houses and condos
Median number of rooms in apartments
Median number of bedrooms in owner occupied houses
Mean number of bedrooms in owner occupied houses
Median number of bedrooms in renter occupied houses
Mean number of bedrooms in renter occupied houses
Median number of vehichles in owner occupied houses
Mean number of vehichles in owner occupied houses
Median number of vehichles in renter occupied houses
Mean number of vehichles in renter occupied houses
Rooms in owner-occupied houses - 1 room (%)
Rooms in owner-occupied houses - 2 rooms (%)
Rooms in owner-occupied houses - 3 rooms (%)
Rooms in owner-occupied houses - 4 rooms (%)
Rooms in owner-occupied houses - 5 rooms (%)
Rooms in owner-occupied houses - 6 rooms (%)
Rooms in owner-occupied houses - 7 rooms (%)
Rooms in owner-occupied houses - 8 rooms (%)
Rooms in owner-occupied houses - 9+ rooms (%)
Rooms in renter-occupied houses - 1 room (%)
Rooms in renter-occupied houses - 2 rooms (%)
Rooms in renter-occupied houses - 3 rooms (%)
Rooms in renter-occupied houses - 4 rooms (%)
Rooms in renter-occupied houses - 5 rooms (%)
Rooms in renter-occupied houses - 6 rooms (%)
Rooms in renter-occupied houses - 7 rooms (%)
Rooms in renter-occupied houses - 8 rooms (%)
Rooms in renter-occupied houses - 9+ rooms (%)
Bedrooms in owner-occupied houses - no bedrooms (%)
Bedrooms in owner-occupied houses - 1 bedroom (%)
Bedrooms in owner-occupied houses - 2 bedrooms (%)
Bedrooms in owner-occupied houses - 3 bedrooms (%)
Bedrooms in owner-occupied houses - 4 bedrooms (%)
Bedrooms in owner-occupied houses - 5+ bedrooms (%)
Bedrooms in renter-occupied houses - no bedrooms (%)
Bedrooms in renter-occupied houses - 1 bedroom (%)
Bedrooms in renter-occupied houses - 2 bedrooms (%)
Bedrooms in renter-occupied houses - 3 bedrooms (%)
Bedrooms in renter-occupied houses - 4 bedrooms (%)
Bedrooms in renter-occupied houses - 5+ bedrooms (%)
Vehicles available in owner-occupied houses - no vehicle available (%)
Vehicles available in owner-occupied houses - 1 vehicle available(%)
Vehicles available in owner-occupied houses - 2 Vehicles available (%)
Vehicles available in owner-occupied houses - 3 Vehicles available (%)
Vehicles available in owner-occupied houses - 4 Vehicles available (%)
Vehicles available in owner-occupied houses - 5+ Vehicles available (%)
Vehicles available in renter-occupied houses - no vehicle available (%)
Vehicles available in renter-occupied houses - 1 vehicle available (%)
Vehicles available in renter-occupied houses - 2 Vehicles available (%)
Vehicles available in renter-occupied houses - 3 Vehicles available (%)
Vehicles available in renter-occupied houses - 4 Vehicles available (%)
Vehicles available in renter-occupied houses - 5+ Vehicles available (%)
Housing units in structures - 1, detached (%)
Housing units in structures - 1, attached (%)
Housing units in structures - 2 (%)
Housing units in structures - 3 or 4 (%)
Housing units in structures - 5 to 9 (%)
Housing units in structures - 10 to 19 (%)
Housing units in structures - 20 to 49 (%)
Housing units in structures - 50 or more (%)
Housing units in structures - Mobile home (%)
Housing units in structures - Boat, RV, van, etc. (%)
Housing units in structures - Owners - 1, detached (%)
Housing units in structures - Owners - 1, attached (%)
Housing units in structures - Owners - 2 (%)
Housing units in structures - Owners - 3 or 4 (%)
Housing units in structures - Owners - 5 to 9 (%)
Housing units in structures - Owners - 10 to 19 (%)
Housing units in structures - Owners - 20 to 49 (%)
Housing units in structures - Owners - 50 or more (%)
Housing units in structures - Owners - Mobile home (%)
Housing units in structures - Owners - Boat, RV, van, etc. (%)
Housing units in structures - Renters - 1, detached (%)
Housing units in structures - Renters - 1, attached (%)
Housing units in structures - Renters - 2 (%)
Housing units in structures - Renters - 3 or 4 (%)
Housing units in structures - Renters - 5 to 9 (%)
Housing units in structures - Renters - 10 to 19 (%)
Housing units in structures - Renters - 20 to 49 (%)
Housing units in structures - Renters - 50 or more (%)
Housing units in structures - Renters - Mobile home (%)
Housing units in structures - Renters - Boat, RV, van, etc. (%)
House/condo owner moved in on average (years ago)
Renter moved in on average (years ago)
Year householder moved into unit - Moved in 1999 to March 2000 (%)
Year householder moved into unit - Moved in 1999 to March 2000 (%) - White
Year householder moved into unit - Moved in 1999 to March 2000 (%) - Black or African American
Year householder moved into unit - Moved in 1999 to March 2000 (%) - Asian
Year householder moved into unit - Moved in 1999 to March 2000 (%) - Hispanic or Latino
Year householder moved into unit - Moved in 1999 to March 2000 (%) - American Indian and Alaska Native
Year householder moved into unit - Moved in 1999 to March 2000 (%) - Multirace
Year householder moved into unit - Moved in 1999 to March 2000 (%) - Other Race
Year householder moved into unit - Moved in 1995 to 1998 (%)
Year householder moved into unit - Moved in 1995 to 1998 (%) - White
Year householder moved into unit - Moved in 1995 to 1998 (%) - Black or African American
Year householder moved into unit - Moved in 1995 to 1998 (%) - Asian
Year householder moved into unit - Moved in 1995 to 1998 (%) - Hispanic or Latino
Year householder moved into unit - Moved in 1995 to 1998 (%) - American Indian and Alaska Native
Year householder moved into unit - Moved in 1995 to 1998 (%) - Multirace
Year householder moved into unit - Moved in 1995 to 1998 (%) - Other Race
Year householder moved into unit - Moved in 1990 to 1994 (%)
Year householder moved into unit - Moved in 1990 to 1994 (%) - White
Year householder moved into unit - Moved in 1990 to 1994 (%) - Black or African American
Year householder moved into unit - Moved in 1990 to 1994 (%) - Asian
Year householder moved into unit - Moved in 1990 to 1994 (%) - Hispanic or Latino
Year householder moved into unit - Moved in 1990 to 1994 (%) - American Indian and Alaska Native
Year householder moved into unit - Moved in 1990 to 1994 (%) - Multirace
Year householder moved into unit - Moved in 1990 to 1994 (%) - Other Race
Year householder moved into unit - Moved in 1980 to 1989 (%)
Year householder moved into unit - Moved in 1980 to 1989 (%) - White
Year householder moved into unit - Moved in 1980 to 1989 (%) - Black or African American
Year householder moved into unit - Moved in 1980 to 1989 (%) - Asian
Year householder moved into unit - Moved in 1980 to 1989 (%) - Hispanic or Latino
Year householder moved into unit - Moved in 1980 to 1989 (%) - American Indian and Alaska Native
Year householder moved into unit - Moved in 1980 to 1989 (%) - Multirace
Year householder moved into unit - Moved in 1980 to 1989 (%) - Other Race
Year householder moved into unit - Moved in 1970 to 1979 (%)
Year householder moved into unit - Moved in 1970 to 1979 (%) - White
Year householder moved into unit - Moved in 1970 to 1979 (%) - Black or African American
Year householder moved into unit - Moved in 1970 to 1979 (%) - Asian
Year householder moved into unit - Moved in 1970 to 1979 (%) - Hispanic or Latino
Year householder moved into unit - Moved in 1970 to 1979 (%) - American Indian and Alaska Native
Year householder moved into unit - Moved in 1970 to 1979 (%) - Multirace
Year householder moved into unit - Moved in 1970 to 1979 (%) - Other Race
Year householder moved into unit - Moved in 1969 or earlier (%)
Year householder moved into unit - Moved in 1969 or earlier (%) - White
Year householder moved into unit - Moved in 1969 or earlier (%) - Black or African American
Year householder moved into unit - Moved in 1969 or earlier (%) - Asian
Year householder moved into unit - Moved in 1969 or earlier (%) - Hispanic or Latino
Year householder moved into unit - Moved in 1969 or earlier (%) - American Indian and Alaska Native
Year householder moved into unit - Moved in 1969 or earlier (%) - Multirace
Year householder moved into unit - Moved in 1969 or earlier (%) - Other Race
Housing units lacking complete plumbing facilities (%)
Housing units lacking complete kitchen facilities (%)
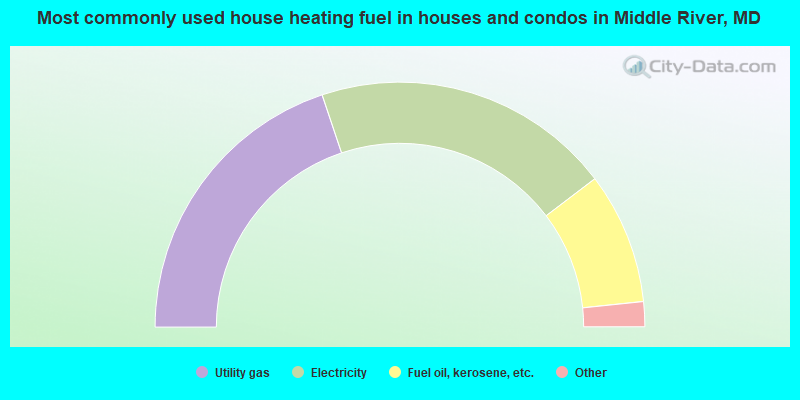
House heating fuel used in houses and condos - Utility gas (%)
House heating fuel used in houses and condos - Bottled, tank, or LP gas (%)
House heating fuel used in houses and condos - Electricity (%)
House heating fuel used in houses and condos - Fuel oil, kerosene, etc. (%)
House heating fuel used in houses and condos - Coal or coke (%)
House heating fuel used in houses and condos - Wood (%)
House heating fuel used in houses and condos - Solar energy (%)
House heating fuel used in houses and condos - Other fuel (%)
House heating fuel used in houses and condos - No fuel used (%)
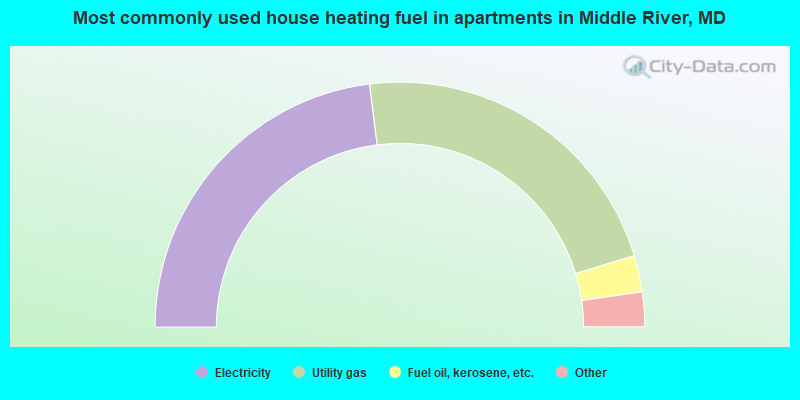
House heating fuel used in apartments - Utility gas (%)
House heating fuel used in apartments - Bottled, tank, or LP gas (%)
House heating fuel used in apartments - Electricity (%)
House heating fuel used in apartments - Fuel oil, kerosene, etc. (%)
House heating fuel used in apartments - Coal or coke (%)
House heating fuel used in apartments - Wood (%)
House heating fuel used in apartments - Solar energy (%)
House heating fuel used in apartments - Other fuel (%)
House heating fuel used in apartments - No fuel used (%)
Median year house/condo built: 1982Median year apartment built: 1982Household type by relationship:
Households: 30,987
Male householders: 5,993 (1,518 living alone ), Female householders: 6,023 (2,032 living alone )4,710 spouses (4,673 opposite-sex spouses ), 990 unmarried partners , (976 opposite-sex unmarried partners ), 8,742 children (7,752 natural , 243 adopted , 746 stepchildren ), 1,210 grandchildren , 246 brothers or sisters , 377 parents , 55 foster children , 690 other relatives , 1,757 non-relatives In group quarters: 187
Size of family households: 3,091 2-persons , 1,778 3-persons , 1,521 4-persons , 715 5-persons , 216 6-persons , 125 7-or-more-persons .
Size of nonfamily households: 3,698 1-person , 783 2-persons , 329 3-persons , 14 4-persons .
3,424 married couples with children. single-parent households (682 men , 1,313 women ).
83.8% of residents of Middle River speak English at home. of residents speak Spanish at home (49% speak English very well , 24% speak English well , 19% speak English not well , 8% don't speak English at all ).of residents speak other Indo-European language at home (55% speak English very well , 18% speak English well , 14% speak English not well , 14% don't speak English at all ).of residents speak Asian or Pacific Island language at home (86% speak English very well , 14% speak English well ).of residents speak other language at home (60% speak English very well , 30% speak English well , 11% speak English not well ).
Foreign born population: 4,590 (14.8%)of them are naturalized citizens )
Median number of rooms in houses and condos:
Median number of rooms in apartments
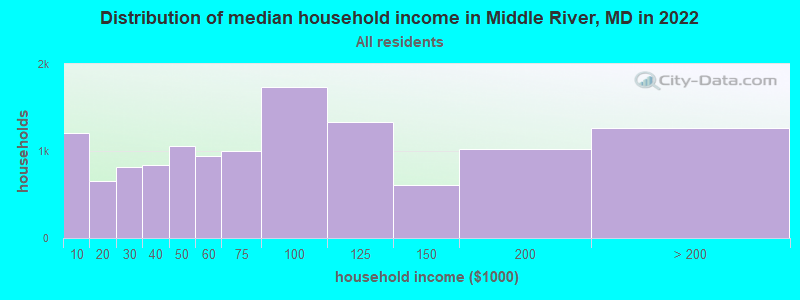
Middle River, MD household income distribution 1,204 Less than $10,000652 $10,000 to $19,999813 $20,000 to $29,999840 $30,000 to $39,9991,052 $40,000 to $49,999948 $50,000 to $59,9991,004 $60,000 to $74,9991,733 $75,000 to $99,9991,336 $100,000 to $124,999608 $125,000 to $149,9991,028 $150,000 to $199,9991,265 $200,000 or more
Home value of owner - occupied houses in 2022 in Middle River, MD 342 Less than $10,00092 $10,000 to $14,99962 $15,000 to $19,99934 $20,000 to $24,99919 $25,000 to $29,999136 $30,000 to $34,99935 $35,000 to $39,99947 $40,000 to $49,999114 $50,000 to $59,999211 $60,000 to $69,999141 $70,000 to $79,999113 $80,000 to $89,999203 $90,000 to $99,999291 $100,000 to $124,999189 $125,000 to $149,999611 $150,000 to $174,999401 $175,000 to $199,999920 $200,000 to $249,9991,042 $250,000 to $299,9991,373 $300,000 to $399,999559 $400,000 to $499,999673 $500,000 to $749,999145 $750,000 to $999,99921 $1,000,000 to $1,499,99911 $2,000,000 or moreRent paid by renters in 2022 in Middle River, MD 46 $100 to $14930 $150 to $19945 $300 to $34915 $350 to $39912 $400 to $44925 $450 to $49915 $600 to $6494 $650 to $69944 $700 to $749115 $750 to $799391 $800 to $899190 $900 to $9991,001 $1,000 to $1,2491,146 $1,250 to $1,499888 $1,500 to $1,999337 $2,000 to $2,4993 $2,500 to $2,99985 $3,500 or more155 No cash rent
Percentage of workers working in this county: 61.5%Number of people working at home: 1,680 (10.7% of all workers )
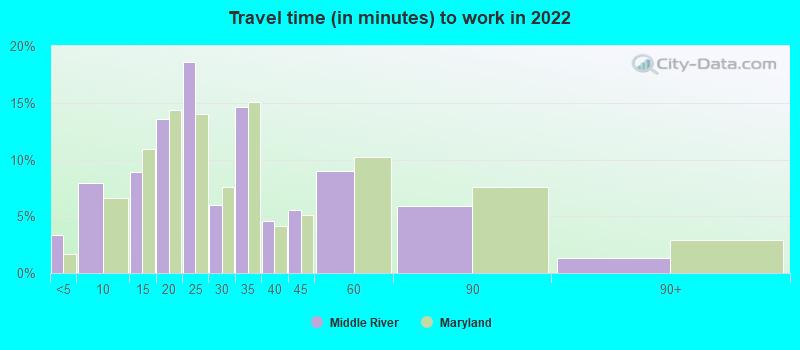
Travel time to work (commute)
Less than 5 minutes: 4175 to 9 minutes: 74510 to 14 minutes: 1,65615 to 19 minutes: 1,85020 to 24 minutes: 2,02425 to 29 minutes: 1,09130 to 34 minutes: 1,97435 to 39 minutes: 56040 to 44 minutes: 1,11145 to 59 minutes: 87960 to 89 minutes: 1,08790 or more minutes: 294
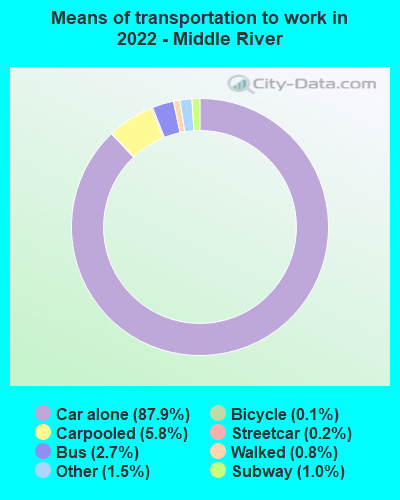
Means of transportation to work:
Drove a car alone: 10,146 (74.7%)Carpooled: 762 (5.6%)Bus : 193 (1.4%)Subway or elevated rail : 17 (0.1%)Long-distance train or commuter rail : 260 (1.9%)Taxi: 210 (1.5%)Bicycle: 11 (0.1%)Walked: 108 (0.8%)Worked at home: 1,680 (12.4%)
Unemployment by race in 2022
Unemployment rate for White non-Hispanic residents 2.7% Males3.6% FemalesUnemployment rate for Black residents 3.9% Males4.9% FemalesUnemployment rate for other race residents 9.4% MalesUnemployment rate for two or more race residents 6.5% FemalesUnemployment rate for Hispanic or Latino residents 4.4% Males7.7% Females
Year of entry for the foreign-born population in Middle River, Maryland
2,117 2010 or later 1,190 2000 to 2009 685 1990 to 1999 318 1980 to 1989 137 1970 to 1979 104 Before 1970
First ancestries reported:
German: 1,605 (9.8%)
American: 825 (5.1%)
Nigerian: 786 (4.8%)
Italian: 685 (4.2%)
Irish: 628 (3.9%)
English: 589 (3.6%)
Polish: 405 (2.5%)
African: 299 (1.8%)
Sudanese: 252 (1.5%)
Arab: 228 (1.4%)
Egyptian: 220 (1.3%)
Czech: 187 (1.1%)
Kenyan: 183 (1.1%)
Scottish: 159 (1.0%)
European: 70 (0.4%)
French: 47 (0.3%)
Ukrainian: 47 (0.3%)
Armenian: 32 (0.2%)
Scotch-Irish: 32 (0.2%)
Liberian: 31 (0.2%)
Eastern European: 29 (0.2%)
Swedish: 25 (0.2%)
Welsh: 25 (0.2%)
British: 24 (0.1%)
Pennsylvania German: 20 (0.1%)
Ethiopian: 18 (0.1%)
Greek: 17 (0.1%)
Guyanese: 17 (0.1%)
Trinidadian and Tobagonian: 17 (0.1%)
Scandinavian: 14 (0.09%)
Russian: 13 (0.08%)
Slovak: 12 (0.07%)
Canadian: 9 (0.06%)
Dutch: 9 (0.06%)
Croatian: 8 (0.05%)
Finnish: 2 (0.01%) Most common places of birth for foreign-born residents (%): Philippines Middle River:
22.1% (1,023)Maryland:
3.8% (36,698)
Nigeria Middle River:
12.7% (585)Maryland:
4.6% (44,825)
Sudan Middle River:
11.5% (534)Maryland:
0.2% (1,757)
El Salvador Middle River:
7.5% (346)Maryland:
12.0% (115,412)
India Middle River:
5.5% (254)Maryland:
6.4% (61,725)
Kenya Middle River:
4.1% (190)Maryland:
0.8% (7,497)
Morocco Middle River:
3.4% (155)Maryland:
0.2% (2,063)
Mexico Middle River:
3.3% (152)Maryland:
3.5% (34,065)
United Kingdom, excluding England and Scotland Middle River:
2.2% (103)Maryland:
0.7% (6,724)
Ghana Middle River:
2.2% (100)Maryland:
1.8% (17,774)
Guatemala Middle River:
2.1% (99)Maryland:
4.4% (42,350)
Egypt Middle River:
2.1% (99)Maryland:
0.5% (4,414)
Canada Middle River:
1.8% (84)Maryland:
0.9% (8,603)
Italy Middle River:
1.8% (84)Maryland:
0.5% (4,596)
Iran Middle River:
1.8% (81)Maryland:
1.3% (12,074)
Trinidad and Tobago Middle River:
1.6% (72)Maryland:
1.2% (11,481)
Brazil Middle River:
1.5% (70)Maryland:
1.2% (11,980)
Place of birth for U.S.-born residents:
This state: 19,942Other state: 5,959Northeast: 2,814Midwest: 413South: 2,263West: 412 89.5% of Middle River residents lived in the same house 1 years ago.
Out of people who lived in different houses, 37.5% lived in this county.
Out of people who lived in different counties, 76.7% lived in Maryland.
Middle River:
89.5%State average:
88.5%
Education attainment for males 25 years and older:
No schooling: 662Nursery to 4th grade: 615th and 6th grade: 397th and 8th grade: 1189th grade: 11810th grade: 6611th grade: 10212th grade, no diploma: 182High school graduate (or equivalency): 3,270Less than 1 year of college: 746Some college more than 1 year, no degree: 718Associate degree: 1,070Bachelor's degree: 1,781Master's degree: 670Professional school degree: 43Doctorate degree: 148
Education attainment for females 25 years and older:
No schooling: 506Nursery to 4th grade: 1165th and 6th grade: 207th and 8th grade: 1839th grade: 5910th grade: 21511th grade: 29312th grade, no diploma: 169High school graduate (or equivalency): 3,703Less than 1 year of college: 950Some college more than 1 year, no degree: 1,264Associate degree: 504Bachelor's degree: 2,013Master's degree: 1,208Professional school degree: 301Doctorate degree: 201
Housing units in structures:
One, detached: 5,011One, attached: 4,189Two: 653 or 4: 4605 to 9: 30910 to 19: 91420 to 49: 9450 or more: 1,088Mobile homes: 1,172Median worth of mobile homes: $62,335
Housing units lacking complete plumbing facilities in 2022: 0.6%Housing units lacking complete kitchen facilities in 2022: 1.5%House/condo owner moved in on average 12 years ago
Renter moved in on average 3 years ago
Private vs. public school enrollment:
Students in private schools in grades 1 to 8 (elementary and middle school): 258 Students in private schools in grades 9 to 12 (high school): 151 Students in private undergraduate colleges: 157