Mesquite, NV (Nevada) Houses and Residents
| Mesquite: | $390,805 |
| Nevada: | $434,700 |
Mean price in 2022:
Detached houses: $448,226
Here: $448,226 State: $549,327 Townhouses or other attached units: $314,476
Here: $314,476 State: $328,893 In 2-unit structures: $270,444
Here: $270,444 State: $326,466 In 3-to-4-unit structures: $225,357
Here: $225,357 State: $295,216 In 5-or-more-unit structures: $162,092
Here: $162,092 State: $297,847 Mobile homes: $104,566
Here: $104,566 State: $159,995
Total population: 16,970 (Urban population: 8,934 (all inside urban clusters), Rural population: 570 (all nonfarm))
Houses: 11,896 (9,318 occupied: 7,333 owner occupied, 1,985 renter occupied)
| % of renters here: | 21% |
| State: | 40% |
Housing density: 777 houses/condos per square mile
Median price asked for vacant for-sale houses and condos in 2022: $366,295.
Median contract rent in 2022: $1,005 (lower quartile is $864, upper quartile is $1,216)
Median rent asked for vacant for-rent units in 2022: $972
Median gross rent in Mesquite, NV in 2022: $1,147
Housing units in Mesquite with a mortgage: 3,956 (232 second mortgage, 6 home equity loan, 160 both second mortgage and home equity loan)
Houses without a mortgage: 25
Median household income for houses/condos with a mortgage: $82,203
Median household income for apartments without a mortgage: $66,456
Median monthly housing costs: $1,004
Compare current foreclosures near Mesquite, NV:
| Photo | Address | Area | Beds / Baths | Price | Details |
|---|---|---|---|---|---|

|
#1
Appletree Ln
Mesquite, NV 89027
|
1,078 sq. feet
|
2 baths 2 beds |
show details | |

|
#2
Via Ventana Dr
Mesquite, NV 89027
|
1,979 sq. feet
|
2 baths 2 beds |
show details | |

|
#3
Bobcat Run
Mesquite, NV 89034
|
1,390 sq. feet
|
2 baths 2 beds |
show details | |

|
#4
Sagedell Rd
Mesquite, NV 89027
|
1,779 sq. feet
|
2 baths 3 beds |
show details | |

|
#5
Greens Way
Mesquite, NV 89027
|
1,532 sq. feet
|
2 baths 2 beds |
show details | |

|
#6
Partridge Ln
Mesquite, NV 89027
|
1,634 sq. feet
|
2 baths 3 beds |
show details | |

|
#7
Thistle St
Mesquite, NV 89027
|
1,728 sq. feet
|
2 baths 3 beds |
show details | |

|
#8
Sagedell Rd
Mesquite, NV 89027
|
1,681 sq. feet
|
2 baths 3 beds |
show details | |

|
#9
Muscat Dr
Mesquite, NV 89027
|
1,360 sq. feet
|
2 baths 3 beds |
show details | |

|
#10
Clark St
Mesquite, NV 89027
|
1,669 sq. feet
|
2 baths 3 beds |
show details |
| Photo | Address | Area | Beds / Baths | Price | Details |
|---|---|---|---|---|---|

|
#11
Mesquite Springs Dr Unit 201
Mesquite, NV 89027
|
996 sq. feet
|
2 baths 2 beds |
show details | |

|
#12
Thompson Dr
Mesquite, NV 89027
|
1,360 sq. feet
|
2 baths 3 beds |
show details | |

|
#13
Turtleback Rd
Mesquite, NV 89027
|
- sq. feet
|
2 baths 2 beds |
show details | |

|
#14
Hardy Way
Mesquite, NV 89027
|
- sq. feet
|
2 baths 2 beds |
show details | |

|
#15
Riverside Rd Apt 11h
Mesquite, NV 89027
|
- sq. feet
|
- baths - beds |
show details | |

|
#16
Deep Gorge Trl
Mesquite, NV 89034
|
- sq. feet
|
- baths - beds |
show details | |

|
#17
Mesquite Springs Dr Unit 102
Mesquite, NV 89027
|
- sq. feet
|
- baths - beds |
show details | |

|
#18
W Mesquite Blvd # 9
Mesquite, NV 89027
|
- sq. feet
|
- baths - beds |
show details | |

|
#19
Dancing Sky Trl
Mesquite, NV 89027
|
- sq. feet
|
- baths - beds |
show details | |

|
#20
Bobcat Run
Mesquite, NV 89034
|
- sq. feet
|
- baths - beds |
show details |
| Photo | Address | Area | Beds / Baths | Price | Details |
|---|---|---|---|---|---|

|
#21
Haley Way, Unit 119
Mesquite, NV 89027
|
- sq. feet
|
- baths - beds |
show details | |

|
#22
E Old Mill Rd Apt 30
Mesquite, NV 89027
|
- sq. feet
|
- baths - beds |
show details | |

|
#23
2nd South St
Mesquite, NV 89027
|
- sq. feet
|
- baths - beds |
show details | |

|
#24
Hafen Ln
Mesquite, NV 89027
|
- sq. feet
|
- baths - beds |
show details | |

|
#25
Milky Way
Mesquite, NV 89027
|
- sq. feet
|
- baths - beds |
show details | |

|
#26
Kylee Ave
Mesquite, NV 89027
|
- sq. feet
|
- baths - beds |
show details | |

|
#27
E Mormon Trl
Littlefield, AZ 86432
|
- sq. feet
|
- baths - beds |
show details | |

|
Check over 1 million property listings on Foreclosure.com!
|
browse all offers | |||

Latest news about housing in Mesquite, NV collected exclusively by city-data.com from local newspapers, TV, and radio stations

 | LV Real Estate: 2006 all over again? (63 replies) |
| Pahrump vs Mesquite (22 replies) |
| Mesquite, NV (25 replies) |
| Visiting Mesquite, NV in March; what to do besides golf? (7 replies) |
| Why No Rentals in Pahrump?? (2 replies) |
| Thinking About South Las Vegas (194 replies) |

Median year apartment built: 2000
Household type by relationship:
Households: 21,179- Male householders: 5,454 (1,203 living alone), Female householders: 3,820 (1,163 living alone)
5,277 spouses (5,199 opposite-sex spouses), 452 unmarried partners, (415 opposite-sex unmarried partners), 3,679 children (3,397 natural, 87 adopted, 194 stepchildren), 349 grandchildren, 572 brothers or sisters, 709 parents, 0 foster children, 144 other relatives, 631 non-relatives
- In group quarters: 87
Size of family households: 4,480 2-persons, 662 3-persons, 746 4-persons, 306 5-persons, 235 6-persons, 57 7-or-more-persons.
Size of nonfamily households: 2,316 1-person, 388 2-persons, 94 3-persons.
1,784 married couples with children.
722 single-parent households (290 men, 432 women).
80.4% of residents of Mesquite speak English at home.
17.8% of residents speak Spanish at home (58% speak English very well, 16% speak English well, 19% speak English not well, 7% don't speak English at all).
0.8% of residents speak other Indo-European language at home (86% speak English very well, 14% speak English well).
1.8% of residents speak Asian or Pacific Island language at home (43% speak English very well, 34% speak English well, 16% speak English not well, 7% don't speak English at all).
0.1% of residents speak other language at home (100% speak English very well).
Foreign born population: 2,641 (12.5%)
(51.3% of them are naturalized citizens)
| Here: | 5.2 |
| State: | 6.0 |
| Here: | 4.6 |
| State: | 4.2 |

- Bedrooms in owner-occupied houses and condos in Mesquite, Nevada
- 26no bedroom
- 1071 bedroom
- 2,9242 bedrooms
- 3,5613 bedrooms
- 5474 bedrooms
- 1695+ bedrooms

- Bedrooms in renter-occupied apartments in Mesquite, Nevada
- 102no bedroom
- 1111 bedroom
- 1,1222 bedrooms
- 5933 bedrooms
- 394 bedrooms
- 195+ bedrooms

- Cars and other vehicles available in Mesquite in owner-occupied houses/condos
- 265no vehicle
- 2,5021 vehicle
- 3,4262 vehicles
- 8053 vehicles
- 2114 vehicles
- 1255+ vehicles

- Cars and other vehicles available in Mesquite in renter-occupied apartments
- 173no vehicle
- 9861 vehicle
- 6912 vehicles
- 1273 vehicles
- 94 vehicles
- 05+ vehicles

- Rooms in owner-occupied houses in Mesquite, Nevada
- 151 room
- 342 rooms
- 3803 rooms
- 1,5444 rooms
- 2,2175 rooms
- 1,4486 rooms
- 7597 rooms
- 4188 rooms
- 5189+ rooms

- Rooms in renter-occupied apartments in Mesquite, Nevada
- 791 room
- 942 rooms
- 2563 rooms
- 5304 rooms
- 5975 rooms
- 2526 rooms
- 587 rooms
- 728 rooms
- 469+ rooms


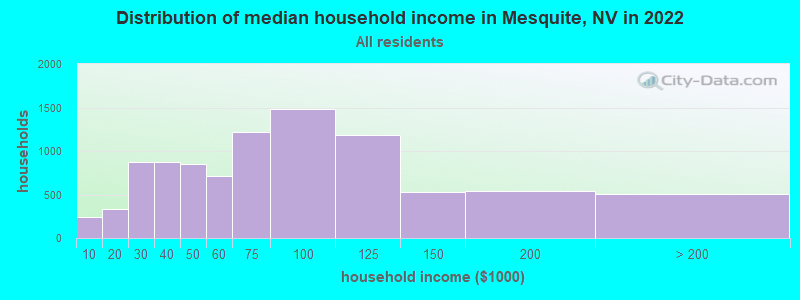
Mesquite, NV household income distribution

- 240Less than $10,000
- 338$10,000 to $19,999
- 876$20,000 to $29,999
- 875$30,000 to $39,999
- 845$40,000 to $49,999
- 710$50,000 to $59,999
- 1,214$60,000 to $74,999
- 1,487$75,000 to $99,999
- 1,183$100,000 to $124,999
- 531$125,000 to $149,999
- 538$150,000 to $199,999
- 507$200,000 or more
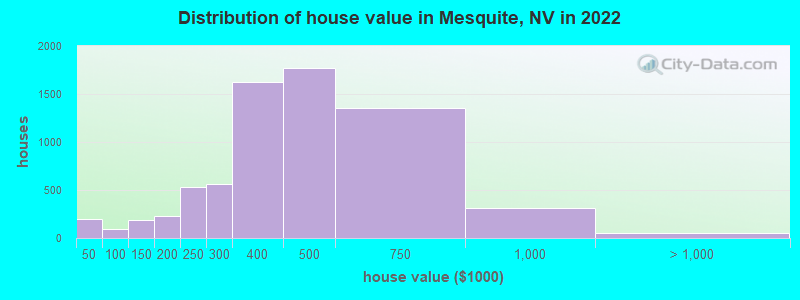
Home value of owner - occupied houses in 2022 in Mesquite, NV
-
- 88Less than $10,000
- 4$10,000 to $14,999
- 14$15,000 to $19,999
- 19$20,000 to $24,999
- 31$25,000 to $29,999
- 34$30,000 to $34,999
- 5$35,000 to $39,999
- 44$50,000 to $59,999
- 11$70,000 to $79,999
- 22$80,000 to $89,999
- 12$90,000 to $99,999
- 89$100,000 to $124,999
- 94$125,000 to $149,999
- 75$150,000 to $174,999
- 151$175,000 to $199,999
- 536$200,000 to $249,999
- 561$250,000 to $299,999
- 1,624$300,000 to $399,999
- 1,771$400,000 to $499,999
- 1,359$500,000 to $749,999
- 314$750,000 to $999,999
- 51$1,000,000 to $1,499,999
Rent paid by renters in 2022 in Mesquite, NV
-
- 25Less than $100
- 13$150 to $199
- 11$250 to $299
- 19$350 to $399
- 9$400 to $449
- 2$450 to $499
- 64$500 to $549
- 6$550 to $599
- 55$600 to $649
- 14$650 to $699
- 107$700 to $749
- 42$750 to $799
- 270$800 to $899
- 381$900 to $999
- 131$1,000 to $1,249
- 162$1,250 to $1,499
- 193$1,500 to $1,999
- 19$2,000 to $2,499
- 171No cash rent


Percentage of workers working in this county: 87.8%
Number of people working at home: 633 (9.6% of all workers)
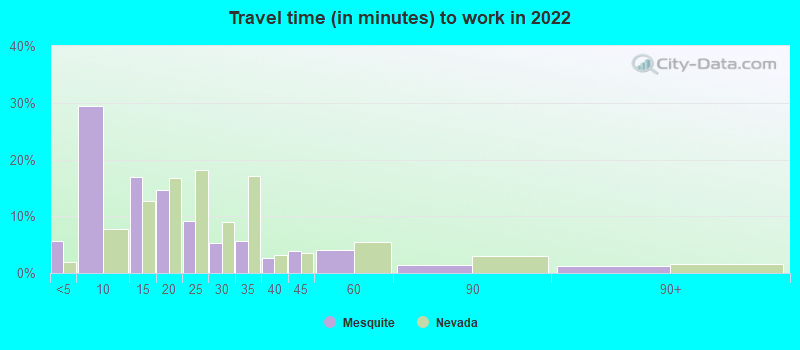
Travel time to work (commute)
- Less than 5 minutes: 492
- 5 to 9 minutes: 2,306
- 10 to 14 minutes: 1,325
- 15 to 19 minutes: 600
- 20 to 24 minutes: 19
- 25 to 29 minutes: 145
- 30 to 34 minutes: 108
- 35 to 39 minutes: 204
- 40 to 44 minutes: 145
- 45 to 59 minutes: 195
- 60 to 89 minutes: 127
- 90 or more minutes: 170
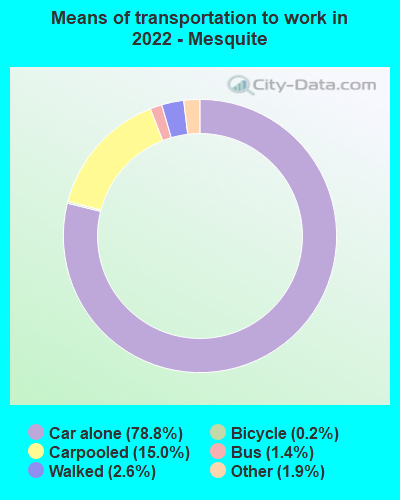
Means of transportation to work:
- Drove a car alone: 5,586 (70.3%)
- Carpooled: 1,155 (14.5%)
- Bus: 100 (1.3%)
- Taxi: 149 (1.9%)
- Bicycle: 21 (0.3%)
- Walked: 190 (2.4%)
- Worked at home: 633 (8.0%)

- Unemployment by race in 2022
- Unemployment rate for White non-Hispanic residents
- 5.5%Males
- 9.1%Females
- Unemployment rate for Black residents
- 49.6%Males
- Unemployment rate for American Indian and Alaska Native residents
- 13.4%Females
- Unemployment rate for Asian residents
- 10.2%Males
- Unemployment rate for other race residents
- 2.4%Males
- Unemployment rate for two or more race residents
- 0.6%Males
- 1.7%Females
- Unemployment rate for Hispanic or Latino residents
- 1.6%Males
- 3.1%Females

- Year of entry for the foreign-born population in Mesquite, Nevada
- 4172010 or later
- 4192000 to 2009
- 5491990 to 1999
- 4531980 to 1989
- 2451970 to 1979
- 211Before 1970

First ancestries reported:
- English: 1,609 (14.4%)
- German: 921 (8.2%)
- American: 749 (6.7%)
- Irish: 452 (4.0%)
- Italian: 339 (3.0%)
- European: 264 (2.4%)
- Polish: 211 (1.9%)
- French: 201 (1.8%)
- Danish: 174 (1.6%)
- Norwegian: 150 (1.3%)
- Scottish: 86 (0.8%)
- French Canadian: 79 (0.7%)
- Swedish: 56 (0.5%)
- Basque: 55 (0.5%)
- Dutch: 55 (0.5%)
- British: 46 (0.4%)
- Scotch-Irish: 34 (0.3%)
- Swiss: 33 (0.3%)
- Hungarian: 29 (0.3%)
- Czech: 28 (0.3%)
- Portuguese: 28 (0.3%)
- Scandinavian: 27 (0.2%)
- Greek: 25 (0.2%)
- Russian: 25 (0.2%)
- Eastern European: 22 (0.2%)
- Welsh: 22 (0.2%)
- Northern European: 20 (0.2%)
- Belgian: 18 (0.2%)
- Austrian: 18 (0.2%)
- Lithuanian: 16 (0.1%)
- Armenian: 11 (0.10%)
- Finnish: 11 (0.10%)
- Canadian: 10 (0.09%)
- Turkish: 9 (0.08%)
- Brazilian: 6 (0.05%)
- Iranian: 4 (0.04%)
- Romanian: 4 (0.04%)
- Slovak: 3 (0.03%)
Most common places of birth for foreign-born residents (%):
| Mesquite: | 48.0% (1,269) |
| Nevada: | 36.8% (218,248) |
| Mesquite: | 8.4% (221) |
| Nevada: | 15.5% (91,628) |
| Mesquite: | 7.1% (187) |
| Nevada: | 0.8% (4,679) |
| Mesquite: | 6.2% (164) |
| Nevada: | 1.9% (11,407) |
| Mesquite: | 5.8% (152) |
| Nevada: | 2.4% (14,384) |
| Mesquite: | 3.0% (80) |
| Nevada: | 0.6% (3,500) |
| Mesquite: | 2.8% (73) |
| Nevada: | 0.2% (1,328) |
| Mesquite: | 2.5% (66) |
| Nevada: | 1.0% (5,914) |
| Mesquite: | 2.5% (65) |
| Nevada: | 0.3% (1,951) |
| Mesquite: | 2.2% (57) |
| Nevada: | 1.8% (10,941) |
| Mesquite: | 2.1% (56) |
| Nevada: | 0.7% (4,038) |
| Mesquite: | 1.6% (41) |
| Nevada: | 0.5% (2,829) |
Place of birth for U.S.-born residents:
- This state: 1,918
- Other state: 16,294
- Northeast: 1,672
- Midwest: 2,822
- South: 1,110
- West: 10,715
87.1% of Mesquite residents lived in the same house 1 years ago.
Out of people who lived in different houses, 27.7% lived in this county.
Out of people who lived in different counties, 15.8% lived in Nevada.
| Mesquite: | 87.1% |
| State average: | 86.4% |
Education attainment for males 25 years and older:
- No schooling: 287
- Nursery to 4th grade: 111
- 5th and 6th grade: 85
- 7th and 8th grade: 8
- 9th grade: 37
- 10th grade: 122
- 11th grade: 35
- 12th grade, no diploma: 155
- High school graduate (or equivalency): 2,568
- Less than 1 year of college: 753
- Some college more than 1 year, no degree: 1,457
- Associate degree: 784
- Bachelor's degree: 1,591
- Master's degree: 487
- Professional school degree: 112
- Doctorate degree: 169

Education attainment for females 25 years and older:
- No schooling: 94
- Nursery to 4th grade: 34
- 5th and 6th grade: 107
- 7th and 8th grade: 49
- 9th grade: 63
- 10th grade: 37
- 11th grade: 103
- 12th grade, no diploma: 180
- High school graduate (or equivalency): 2,956
- Less than 1 year of college: 1,079
- Some college more than 1 year, no degree: 1,258
- Associate degree: 689
- Bachelor's degree: 1,268
- Master's degree: 612
- Professional school degree: 75
- Doctorate degree: 35


Housing units in structures:
- One, detached: 7,016
- One, attached: 1,849
- Two: 243
- 3 or 4: 1,541
- 5 to 9: 450
- 10 to 19: 163
- 20 to 49: 211
- 50 or more: 104
- Mobile homes: 295
- Boats, RVs, vans, etc.: 21
Housing units lacking complete kitchen facilities in 2022: 0.7%
House/condo owner moved in on average 6 years ago
Renter moved in on average 4 years ago

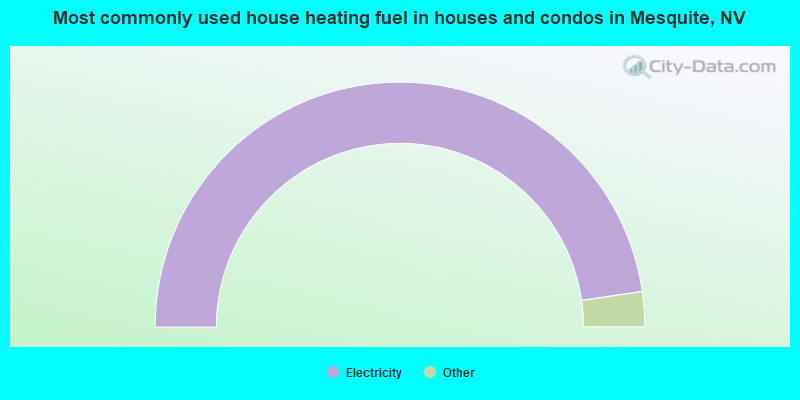
- 95.4%Electricity
- 2.9%Utility gas
- 0.7%Bottled, tank, or LP gas
- 0.5%No fuel used
- 0.3%Solar energy
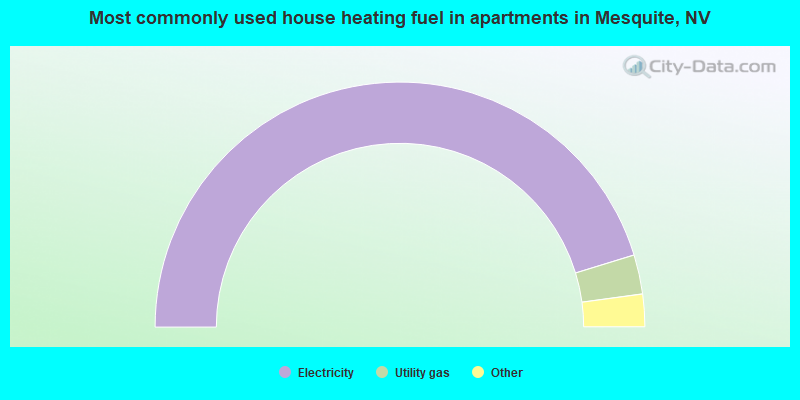
- 90.5%Electricity
- 5.2%Utility gas
- 2.1%No fuel used
- 1.5%Bottled, tank, or LP gas
- 0.6%Other fuel
Private vs. public school enrollment:
| Here: | 4.7% |
| Nevada: | 12.9% |
| Here: | 1.3% |
| Nevada: | 6.9% |
| Here: | 24.1% |
| Nevada: | 16.0% |


