Los Alamitos, CA (California) Houses and Residents
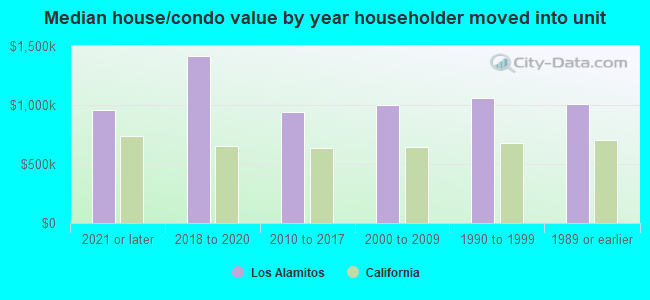
| Los Alamitos: | $1,025,842 |
| California: | $715,900 |
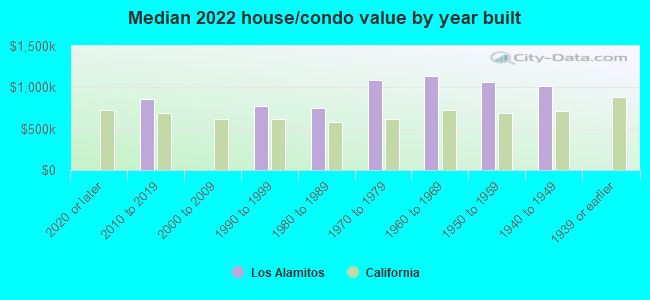
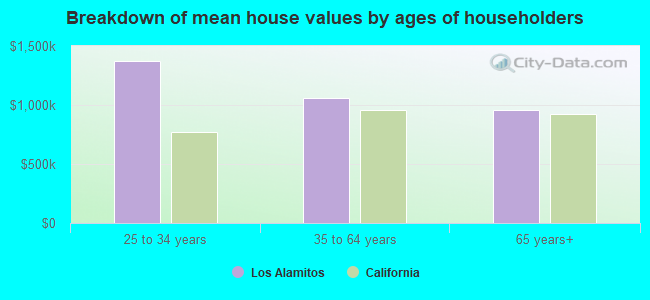
Mean price in 2022:
Detached houses: $1,065,178
Here: $1,065,178 State: $988,808 Townhouses or other attached units: $715,558
Here: $715,558 State: $838,546 In 3-to-4-unit structures: $1,320,216
Here: $1,320,216 State: $824,253 In 5-or-more-unit structures: $1,048,636
Here: $1,048,636 State: $730,996 Mobile homes: $201,773
Here: $201,773 State: $184,506
Total population: 11,716 (Urban population: 11,260, Rural population: 0)
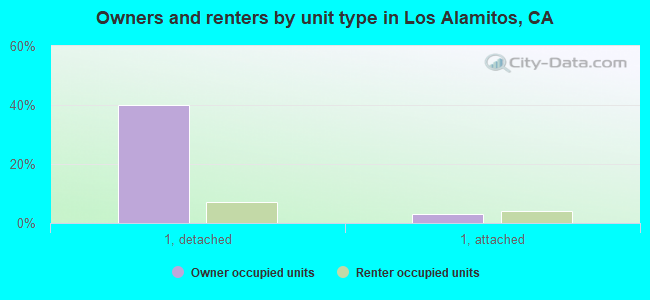
Houses: 4,356 (4,209 occupied: 1,790 owner occupied, 2,435 renter occupied)
| % of renters here: | 58% |
| State: | 44% |
Housing density: 1,086 houses/condos per square mile
Median price asked for vacant for-sale houses and condos in 2022 in this county: $1,279,555.
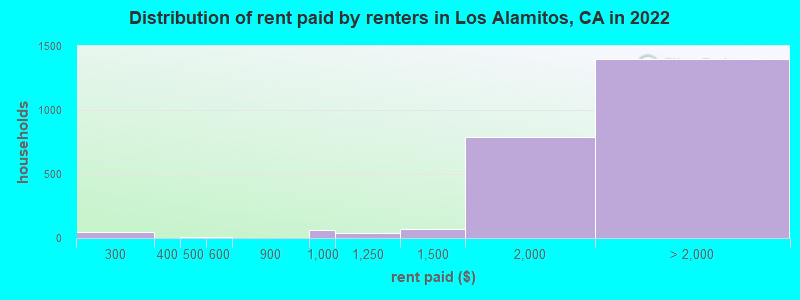
Median contract rent in 2022: over $2,000 (lower quartile is $1,721, upper quartile is over $2,000)
Median rent asked for vacant for-rent units in 2022: $6,979
Median gross rent in Los Alamitos, CA in 2022: over $2,000
Housing units in Los Alamitos with a mortgage: 1,079 (135 second mortgage, 5 home equity loan, 120 both second mortgage and home equity loan)
Houses without a mortgage: 0
Median household income for houses/condos with a mortgage: $171,884
Median household income for apartments without a mortgage: $86,462
Median monthly housing costs: $2,216
Compare current foreclosures near Los Alamitos, CA:
| Photo | Address | Area | Beds / Baths | Price | Details |
|---|---|---|---|---|---|

|
#1
Donnie Ann Rd
Los Alamitos, CA 90720
|
2,489 sq. feet
|
3 baths 4 beds |
show details | |

|
#2
Essex Dr
Los Alamitos, CA 90720
|
2,272 sq. feet
|
3 baths 4 beds |
show details | |

|
#3
Angler Ln
Los Alamitos, CA 90720
|
3,707 sq. feet
|
4 baths 4 beds |
show details | |

|
#4
Saint Albans Dr
Los Alamitos, CA 90720
|
- sq. feet
|
5 baths 5 beds |
show details | |

|
#5
Midway Dr
Los Alamitos, CA 90720
|
1,227 sq. feet
|
1 baths 2 beds |
show details | |

|
#6
Saint Albans Dr
Los Alamitos, CA 90720
|
- sq. feet
|
5 baths 5 beds |
show details | |

|
#7
Ticonderoga Dr
Los Alamitos, CA 90720
|
1,004 sq. feet
|
1 baths 3 beds |
show details | |

|
#8
Howard Ave
Los Alamitos, CA 90720
|
1,843 sq. feet
|
2 baths 3 beds |
show details | |

|
#9
Howard Ave Apt 3
Los Alamitos, CA 90720
|
- sq. feet
|
- baths - beds |
show details | |

|
#10
Farquhar Avenue, Unit 306
Los Alamitos, CA 90720
|
- sq. feet
|
- baths - beds |
show details |
| Photo | Address | Area | Beds / Baths | Price | Details |
|---|---|---|---|---|---|

|
#11
Green Ave Apt A
Los Alamitos, CA 90720
|
- sq. feet
|
- baths - beds |
show details | |

|
#12
Enterprise Dr
Los Alamitos, CA 90720
|
- sq. feet
|
- baths - beds |
show details | |

|
#13
Kempton Dr
Los Alamitos, CA 90720
|
- sq. feet
|
- baths - beds |
show details | |

|
#14
Green Ave
Los Alamitos, CA 90720
|
- sq. feet
|
- baths - beds |
show details | |

|
#15
Cerritos Ave # 326
Los Alamitos, CA 90720
|
- sq. feet
|
- baths - beds |
show details | |

|
#16
S Slater Ave
Compton, CA 90222
|
- sq. feet
|
2 baths 3 beds |
$572,000
|
show details |

|
#17
W Arbor St # 57
Long Beach, CA 90805
|
1,585 sq. feet
|
2 baths 3 beds |
show details | |

|
#18
N Magnolia Ave Apt D
Anaheim, CA 92801
|
1,292 sq. feet
|
2 baths 3 beds |
show details | |

|
#19
Talbot Dr
La Mirada, CA 90638
|
505 sq. feet
|
1 baths 1 beds |
show details | |

|
#20
Norwalk Blvd Apt
Hawaiian Gardens, CA 90716
|
800 sq. feet
|
2 baths 1 beds |
show details |
| Photo | Address | Area | Beds / Baths | Price | Details |
|---|---|---|---|---|---|

|
#21
Redondo Avenue, Units 5-8
Long Beach, CA 90804
|
3,360 sq. feet
|
4 baths 8 beds |
show details | |

|
#22
E 60th St
Los Angeles, CA 90001
|
1,883 sq. feet
|
3 baths 5 beds |
show details | |

|
#23
Elburg St Unit A
Paramount, CA 90723
|
1,131 sq. feet
|
2 baths 3 beds |
show details | |

|
#24
Hercules St
Norwalk, CA 90650
|
1,053 sq. feet
|
1 baths 3 beds |
show details | |

|
#25
Harbor Heights Dr Unit I
Harbor City, CA 90710
|
1,434 sq. feet
|
3 baths 3 beds |
show details | |

|
#26
E Osgood St
Long Beach, CA 90805
|
763 sq. feet
|
1 baths 2 beds |
show details | |

|
#27
Date St
Montebello, CA 90640
|
1,440 sq. feet
|
2 baths 3 beds |
show details | |

|
#28
Greenleaf Ave
Whittier, CA 90601
|
2,385 sq. feet
|
3 baths 4 beds |
show details | |

|
#29
Golden Ridge Ln
Hacienda Heights, CA 91745
|
2,046 sq. feet
|
3 baths 3 beds |
show details | |

|
#30
Wesleyan Bay # 19
Costa Mesa, CA 92626
|
1,065 sq. feet
|
2 baths 2 beds |
show details |
| Photo | Address | Area | Beds / Baths | Price | Details |
|---|---|---|---|---|---|

|
#31
Bonavista Ln
Whittier, CA 90604
|
1,246 sq. feet
|
2 baths 3 beds |
show details | |

|
#32
E 111th St
Los Angeles, CA 90059
|
1,048 sq. feet
|
1 baths 3 beds |
show details | |

|
#33
Caspian Ave
Long Beach, CA 90810
|
1,875 sq. feet
|
2 baths 4 beds |
show details | |

|
#34
Stephens Ave
Fullerton, CA 92833
|
1,802 sq. feet
|
2 baths 2 beds |
show details | |

|
#35
Cerritos Ave
Long Beach, CA 90805
|
1,129 sq. feet
|
1 baths 4 beds |
show details | |

|
#36
Lemoran Ave
Pico Rivera, CA 90660
|
1,633 sq. feet
|
2 baths 3 beds |
show details | |

|
#37
Amherst Rd
Costa Mesa, CA 92626
|
1,587 sq. feet
|
2 baths 3 beds |
show details | |

|
#38
Kellen Dr
Brea, CA 92821
|
2,415 sq. feet
|
3 baths 3 beds |
show details | |

|
#39
Rosemead Blvd
Pico Rivera, CA 90660
|
3,121 sq. feet
|
2 baths 5 beds |
show details | |

|
#40
Sherman Way
Bell, CA 90201
|
1,056 sq. feet
|
1 baths 2 beds |
show details |
| Photo | Address | Area | Beds / Baths | Price | Details |
|---|---|---|---|---|---|

|
#41
Nutwood St
Brea, CA 92821
|
1,430 sq. feet
|
2 baths 4 beds |
show details | |

|
#42
Norino Dr
Whittier, CA 90601
|
2,372 sq. feet
|
3 baths 4 beds |
show details | |

|
#43
E Janice St
Long Beach, CA 90805
|
1,375 sq. feet
|
2 baths 3 beds |
show details | |

|
#44
E 113th St
Los Angeles, CA 90059
|
1,552 sq. feet
|
2 baths 3 beds |
show details | |

|
#45
Olive Pl
Brea, CA 92821
|
750 sq. feet
|
1 baths 2 beds |
show details | |

|
#46
W 133rd St
Compton, CA 90222
|
1,161 sq. feet
|
2 baths 3 beds |
show details | |

|
#47
E Englander St
Gardena, CA 90248
|
1,314 sq. feet
|
2 baths 3 beds |
show details | |

|
#48
La Linda Ave
Fountain Valley, CA 92708
|
2,514 sq. feet
|
3 baths 4 beds |
show details | |

|
#49
Caspian Ave
Long Beach, CA 90810
|
1,235 sq. feet
|
2 baths 3 beds |
show details | |

|
Check over 1 million property listings on Foreclosure.com!
|
browse all offers | |||


 | Apartment search - Elementary schools Cypress/La Palma/Los Alamitos (3 replies) |
| price for renting a 3 BR apartment/house in laguna beach (13 replies) |
| Am I charging enough rent? (10 replies) |
| Where to live around Los Alamitos? (10 replies) |
| Finally Moving To LA/OC, Need Advice on Where to Live! (34 replies) |
| Is there anywhere in OC within a 'commutable' distance to LA? (52 replies) |

Median year apartment built: 1973
Household type by relationship:
Households: 11,639- Male householders: 1,837 (498 living alone), Female householders: 2,282 (498 living alone)
1,856 spouses (1,849 opposite-sex spouses), 172 unmarried partners, (172 opposite-sex unmarried partners), 4,024 children (3,894 natural, 32 adopted, 97 stepchildren), 219 grandchildren, 141 brothers or sisters, 187 parents, 0 foster children, 288 other relatives, 413 non-relatives
- In group quarters: 213
Size of family households: 1,005 2-persons, 917 3-persons, 657 4-persons, 265 5-persons, 82 6-persons, 39 7-or-more-persons.
Size of nonfamily households: 1,037 1-person, 155 2-persons, 58 3-persons, 7 4-persons.
1,523 married couples with children.
1,034 single-parent households (274 men, 760 women).
69.4% of residents of Los Alamitos speak English at home.
14.9% of residents speak Spanish at home (76% speak English very well, 18% speak English well, 5% speak English not well).
4.8% of residents speak other Indo-European language at home (94% speak English very well, 4% speak English well, 2% speak English not well).
8.8% of residents speak Asian or Pacific Island language at home (63% speak English very well, 19% speak English well, 10% speak English not well, 8% don't speak English at all).
1.0% of residents speak other language at home (100% speak English very well).
Foreign born population: 1,785 (15.3%)
(65.8% of them are naturalized citizens)
| Here: | 5.9 |
| State: | 6.0 |
| Here: | 4.1 |
| State: | 3.9 |
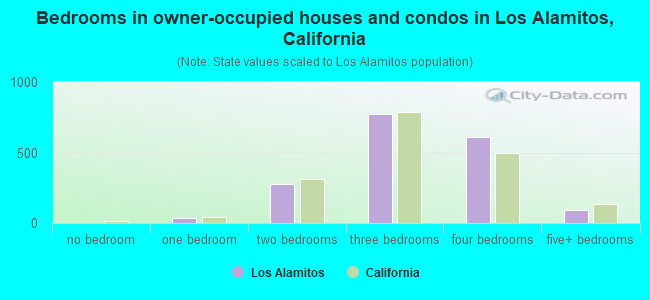
- Bedrooms in owner-occupied houses and condos in Los Alamitos, California
- 0no bedroom
- 381 bedroom
- 2782 bedrooms
- 7733 bedrooms
- 6134 bedrooms
- 895+ bedrooms
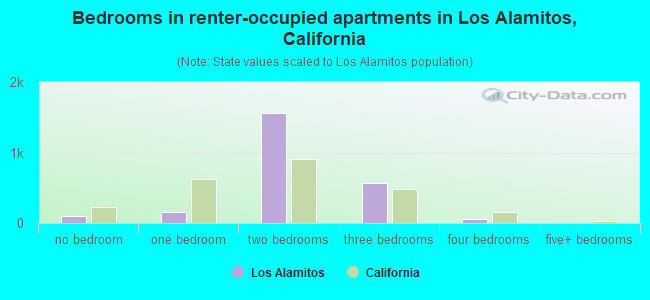
- Bedrooms in renter-occupied apartments in Los Alamitos, California
- 102no bedroom
- 1581 bedroom
- 1,5562 bedrooms
- 5683 bedrooms
- 524 bedrooms
- 05+ bedrooms
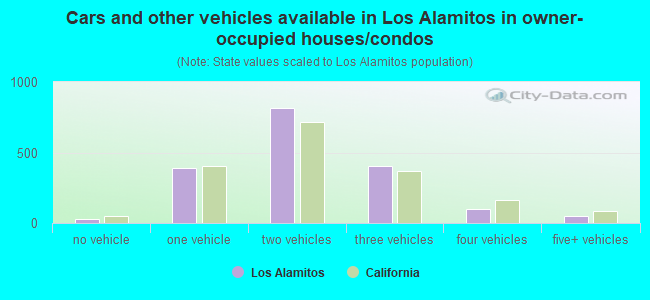
- Cars and other vehicles available in Los Alamitos in owner-occupied houses/condos
- 31no vehicle
- 3891 vehicle
- 8192 vehicles
- 4073 vehicles
- 964 vehicles
- 495+ vehicles
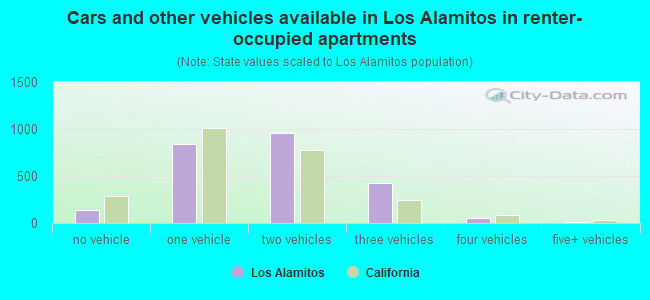
- Cars and other vehicles available in Los Alamitos in renter-occupied apartments
- 138no vehicle
- 8411 vehicle
- 9592 vehicles
- 4283 vehicles
- 554 vehicles
- 145+ vehicles
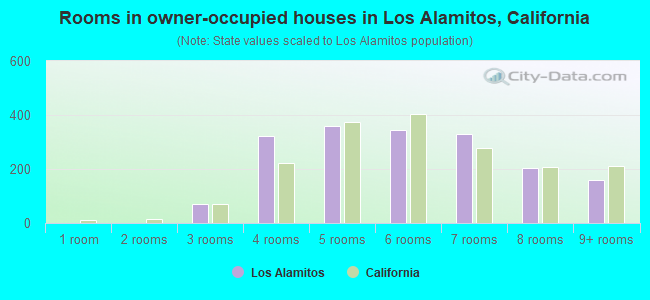
- Rooms in owner-occupied houses in Los Alamitos, California
- 01 room
- 02 rooms
- 723 rooms
- 3224 rooms
- 3585 rooms
- 3446 rooms
- 3317 rooms
- 2038 rooms
- 1619+ rooms
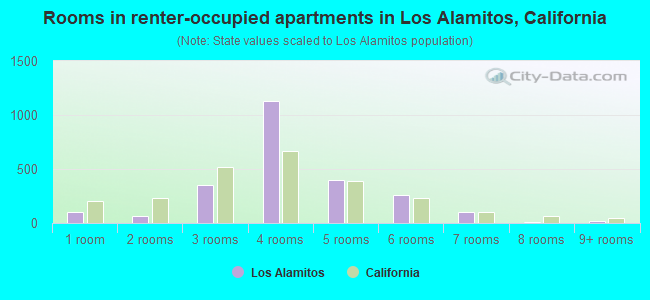
- Rooms in renter-occupied apartments in Los Alamitos, California
- 1021 room
- 692 rooms
- 3563 rooms
- 1,1284 rooms
- 3965 rooms
- 2636 rooms
- 1017 rooms
- 68 rooms
- 159+ rooms
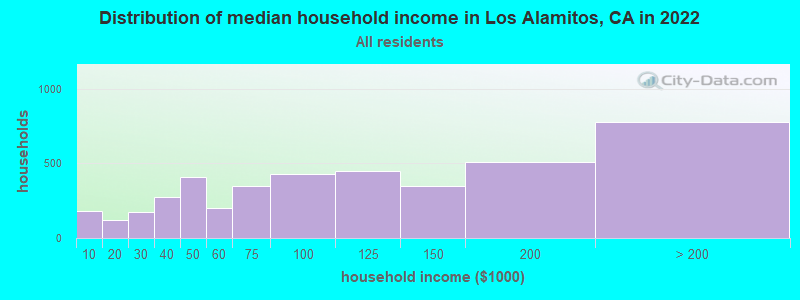
Los Alamitos, CA household income distribution

- 184Less than $10,000
- 122$10,000 to $19,999
- 174$20,000 to $29,999
- 273$30,000 to $39,999
- 408$40,000 to $49,999
- 202$50,000 to $59,999
- 352$60,000 to $74,999
- 428$75,000 to $99,999
- 451$100,000 to $124,999
- 351$125,000 to $149,999
- 509$150,000 to $199,999
- 778$200,000 or more
Home value of owner - occupied houses in 2022 in Los Alamitos, CA
-
- 64Less than $10,000
- 6$10,000 to $14,999
- 7$20,000 to $24,999
- 5$25,000 to $29,999
- 13$50,000 to $59,999
- 7$80,000 to $89,999
- 8$100,000 to $124,999
- 30$150,000 to $174,999
- 14$175,000 to $199,999
- 15$200,000 to $249,999
- 16$300,000 to $399,999
- 13$400,000 to $499,999
- 139$500,000 to $749,999
- 616$750,000 to $999,999
- 724$1,000,000 to $1,499,999
- 163$1,500,000 to $1,999,999
- 13$2,000,000 or more

Rent paid by renters in 2022 in Los Alamitos, CA
-
- 4$200 to $249
- 43$250 to $299
- 4$450 to $499
- 9$550 to $599
- 60$900 to $999
- 35$1,000 to $1,249
- 70$1,250 to $1,499
- 787$1,500 to $1,999
- 830$2,000 to $2,499
- 237$2,500 to $2,999
- 183$3,000 to $3,499
- 63$3,500 or more
- 86No cash rent
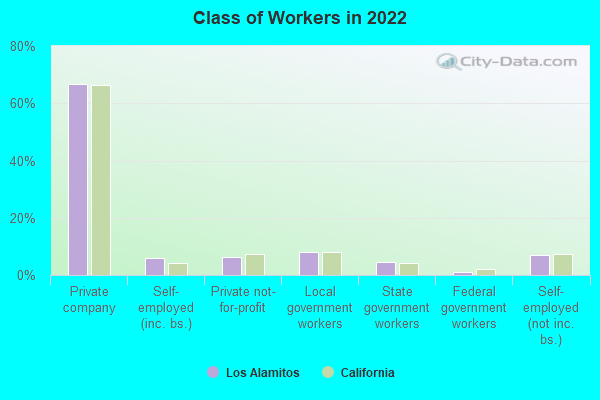
Percentage of workers working in this county: 64.5%
Number of people working at home: 793 (13.5% of all workers)
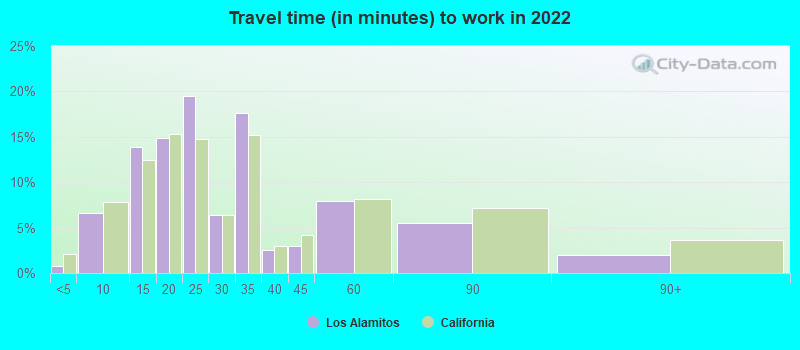
Travel time to work (commute)
- Less than 5 minutes: 123
- 5 to 9 minutes: 418
- 10 to 14 minutes: 332
- 15 to 19 minutes: 561
- 20 to 24 minutes: 768
- 25 to 29 minutes: 396
- 30 to 34 minutes: 837
- 35 to 39 minutes: 185
- 40 to 44 minutes: 238
- 45 to 59 minutes: 515
- 60 to 89 minutes: 441
- 90 or more minutes: 160
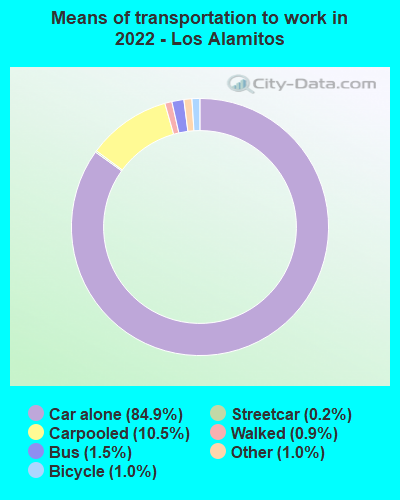
Means of transportation to work:
- Drove a car alone: 11,478 (77.6%)
- Carpooled: 1,532 (10.4%)
- Bus: 183 (1.2%)
- Subway or elevated rail: 12 (0.1%)
- Taxi: 160 (1.1%)
- Bicycle: 152 (1.0%)
- Walked: 116 (0.8%)
- Worked at home: 793 (5.4%)
- Unemployment by race in 2022
- Unemployment rate for White non-Hispanic residents
- 5.2%Males
- 3.8%Females
- Unemployment rate for Black residents
- 17.9%Females
- Unemployment rate for Asian residents
- 4.8%Males
- 1.0%Females
- Unemployment rate for other race residents
- 1.0%Males
- 27.4%Females
- Unemployment rate for two or more race residents
- 2.5%Males
- 4.0%Females
- Unemployment rate for Hispanic or Latino residents
- 1.4%Males
- 15.8%Females
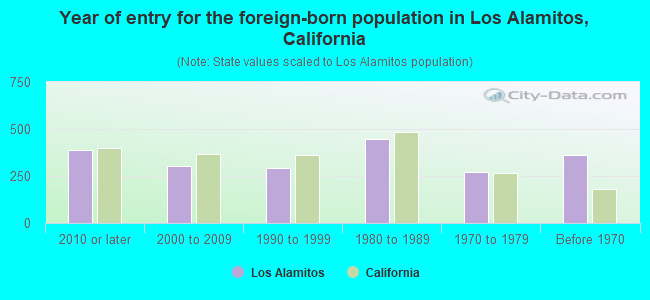
- Year of entry for the foreign-born population in Los Alamitos, California
- 3892010 or later
- 3032000 to 2009
- 2921990 to 1999
- 4471980 to 1989
- 2691970 to 1979
- 364Before 1970
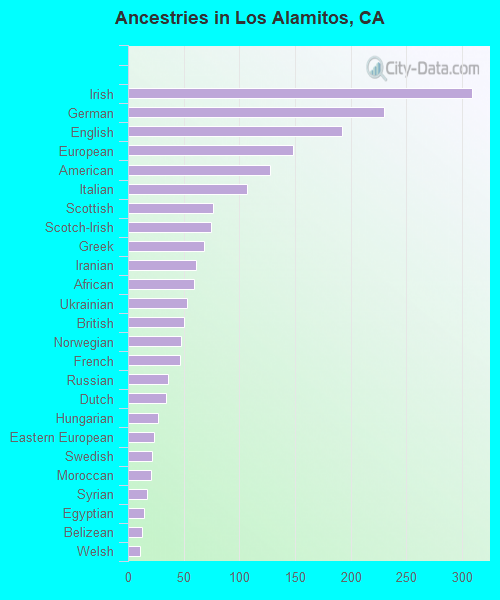
First ancestries reported:
- Irish: 309 (5.2%)
- German: 230 (3.9%)
- English: 192 (3.2%)
- European: 148 (2.5%)
- American: 128 (2.2%)
- Italian: 107 (1.8%)
- Scottish: 76 (1.3%)
- Scotch-Irish: 75 (1.3%)
- Greek: 68 (1.1%)
- Iranian: 61 (1.0%)
- African: 59 (1.0%)
- Ukrainian: 53 (0.9%)
- British: 50 (0.8%)
- Norwegian: 48 (0.8%)
- French: 47 (0.8%)
- Russian: 36 (0.6%)
- Dutch: 34 (0.6%)
- Hungarian: 27 (0.5%)
- Eastern European: 23 (0.4%)
- Swedish: 22 (0.4%)
- Moroccan: 21 (0.4%)
- Syrian: 17 (0.3%)
- Egyptian: 14 (0.2%)
- Belizean: 13 (0.2%)
- Welsh: 11 (0.2%)
- Armenian: 9 (0.2%)
- Polish: 9 (0.2%)
- Lebanese: 6 (0.1%)
- Czechoslovakian: 3 (0.05%)
- Belgian: 1 (0.02%)
Most common places of birth for foreign-born residents (%):
| Los Alamitos: | 12.7% (226) |
| California: | 37.2% (3,881,193) |
| Los Alamitos: | 11.5% (206) |
| California: | 3.0% (315,248) |
| Los Alamitos: | 7.9% (141) |
| California: | 7.8% (818,297) |
| Los Alamitos: | 7.3% (131) |
| California: | 5.2% (539,184) |
| Los Alamitos: | 7.2% (128) |
| California: | 6.6% (684,672) |
| Los Alamitos: | 4.7% (84) |
| California: | 0.7% (74,025) |
| Los Alamitos: | 4.4% (78) |
| California: | 0.2% (23,058) |
| Los Alamitos: | 4.3% (77) |
| California: | 0.7% (73,304) |
| Los Alamitos: | 4.1% (74) |
| California: | 4.9% (512,335) |
| Los Alamitos: | 4.0% (72) |
| California: | 0.5% (51,974) |
| Los Alamitos: | 3.1% (56) |
| California: | 0.6% (65,335) |
| Los Alamitos: | 2.7% (49) |
| California: | 0.3% (33,029) |
| Los Alamitos: | 2.4% (43) |
| California: | 2.8% (290,436) |
| Los Alamitos: | 1.7% (31) |
| California: | 2.0% (206,004) |
| Los Alamitos: | 1.7% (31) |
| California: | 1.7% (176,274) |
| Los Alamitos: | 1.5% (27) |
| California: | 1.2% (127,477) |
| Los Alamitos: | 1.5% (27) |
| California: | 0.6% (57,953) |
Place of birth for U.S.-born residents:
- This state: 8,273
- Other state: 1,557
- Northeast: 395
- Midwest: 351
- South: 374
- West: 437
89.2% of Los Alamitos residents lived in the same house 1 years ago.
Out of people who lived in different houses, 28.5% lived in this county.
Out of people who lived in different counties, 99.2% lived in California.
| Los Alamitos: | 89.2% |
| State average: | 88.9% |
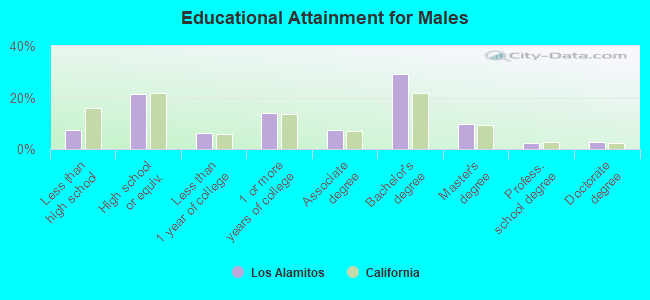
Education attainment for males 25 years and older:
- No schooling: 83
- Nursery to 4th grade: 0
- 5th and 6th grade: 54
- 7th and 8th grade: 0
- 9th grade: 15
- 10th grade: 36
- 11th grade: 33
- 12th grade, no diploma: 49
- High school graduate (or equivalency): 792
- Less than 1 year of college: 234
- Some college more than 1 year, no degree: 527
- Associate degree: 269
- Bachelor's degree: 1,081
- Master's degree: 358
- Professional school degree: 91
- Doctorate degree: 105
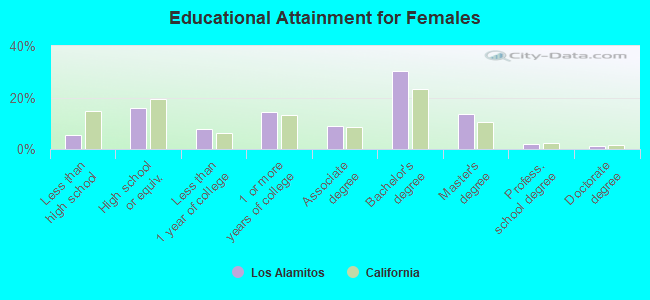
Education attainment for females 25 years and older:
- No schooling: 100
- Nursery to 4th grade: 0
- 5th and 6th grade: 7
- 7th and 8th grade: 14
- 9th grade: 8
- 10th grade: 22
- 11th grade: 32
- 12th grade, no diploma: 58
- High school graduate (or equivalency): 685
- Less than 1 year of college: 340
- Some college more than 1 year, no degree: 616
- Associate degree: 385
- Bachelor's degree: 1,302
- Master's degree: 589
- Professional school degree: 82
- Doctorate degree: 58


Housing units in structures:
- One, detached: 1,947
- One, attached: 377
- Two: 71
- 3 or 4: 828
- 5 to 9: 586
- 10 to 19: 127
- 20 to 49: 165
- 50 or more: 162
- Mobile homes: 90
Median worth of mobile homes: $215,002
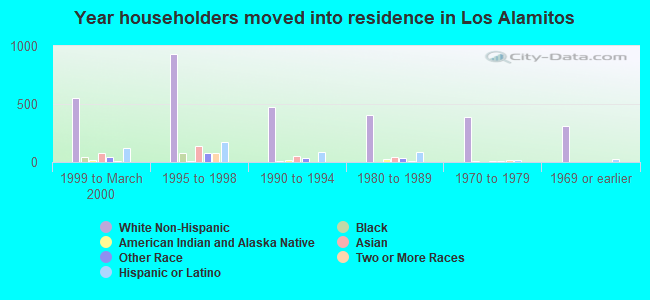
House/condo owner moved in on average 17 years ago
Renter moved in on average 5 years ago
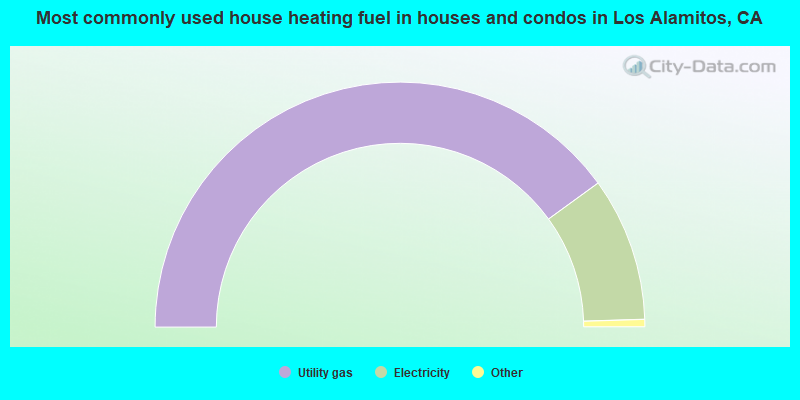
- 80.0%Utility gas
- 19.0%Electricity
- 0.6%Solar energy
- 0.4%No fuel used
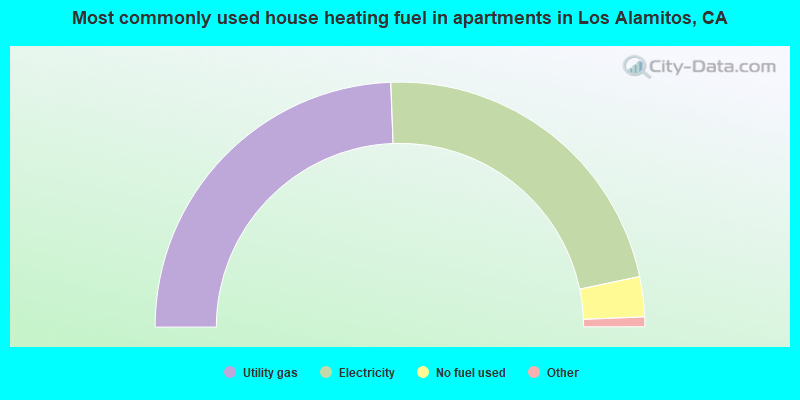
- 48.8%Utility gas
- 44.6%Electricity
- 5.3%No fuel used
- 1.1%Bottled, tank, or LP gas
- 0.2%Wood
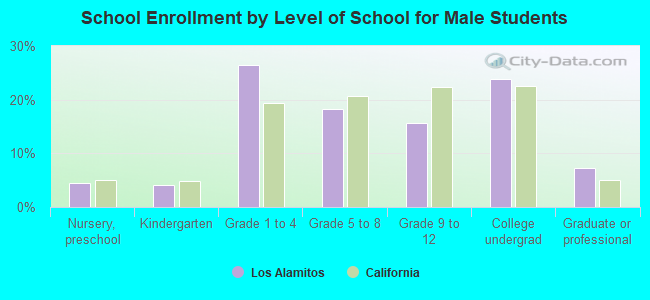
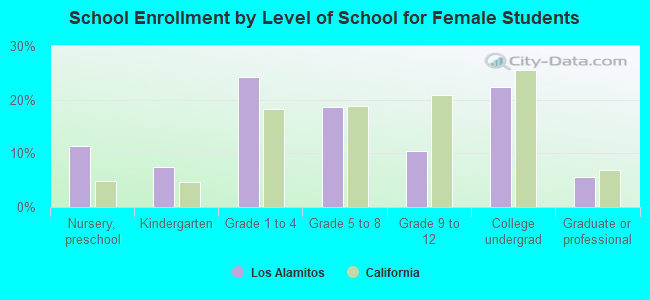
Private vs. public school enrollment:
| Here: | 3.1% |
| California: | 10.5% |
| Here: | 1.7% |
| California: | 8.5% |
| Here: | 3.6% |
| California: | 15.9% |