La Palma, CA (California) Houses and Residents
| La Palma: | $943,299 |
| California: | $715,900 |
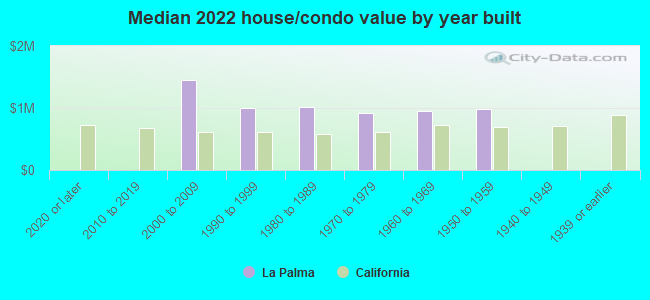
Mean price in 2022:
Detached houses: $1,004,492
Here: $1,004,492 State: $988,808 Townhouses or other attached units: $577,180
Here: $577,180 State: $838,546
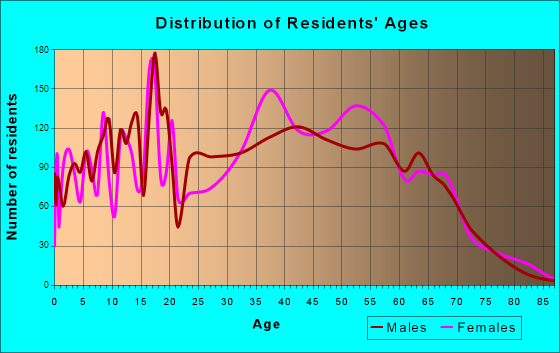
Total population: 15,911 (Urban population: 15,131, Rural population: 0)
Houses: 5,270 (5,155 occupied: 3,463 owner occupied, 1,711 renter occupied)
| % of renters here: | 33% |
| State: | 44% |
Housing density: 2,907 houses/condos per square mile
Median price asked for vacant for-sale houses and condos in 2022 in this county: $1,279,555.
Median contract rent in 2022: over $2,000 (lower quartile is $1,656, upper quartile is over $2,000)
Median rent asked for vacant for-rent units in 2022: $2,249
Median gross rent in La Palma, CA in 2022: over $2,000
Housing units in La Palma with a mortgage: 2,085 (219 second mortgage, 15 home equity loan, 163 both second mortgage and home equity loan)
Houses without a mortgage: 16
Median household income for houses/condos with a mortgage: $165,304
Median household income for apartments without a mortgage: $119,507
Median monthly housing costs: $2,129
Compare current foreclosures near La Palma, CA:
| Photo | Address | Area | Beds / Baths | Price | Details |
|---|---|---|---|---|---|

|
#1
La Palma Ave
La Palma, CA 90623
|
1,306 sq. feet
|
3 baths 3 beds |
show details | |

|
#2
Spruce Cir
La Palma, CA 90623
|
1,660 sq. feet
|
2 baths 4 beds |
show details | |

|
#3
Cornwall Dr
La Palma, CA 90623
|
925 sq. feet
|
1 baths 2 beds |
show details | |

|
#4
Sharon Dr
La Palma, CA 90623
|
2,347 sq. feet
|
2 baths 4 beds |
show details | |

|
#5
Windsong Ave
La Palma, CA 90623
|
2,347 sq. feet
|
2 baths 4 beds |
show details | |

|
#6
Orangethorpe Ave Apt 3903
La Palma, CA 90623
|
- sq. feet
|
- baths - beds |
show details | |

|
#7
Valley View St Apt H207
La Palma, CA 90623
|
- sq. feet
|
- baths - beds |
show details | |

|
#8
La Palma Ave
La Palma, CA 90623
|
- sq. feet
|
- baths - beds |
show details | |

|
#9
Millbury Ave
Baldwin Park, CA 91706
|
1,632 sq. feet
|
2 baths 4 beds |
$850,000
|
show details |

|
#10
E Holton St
West Covina, CA 91791
|
- sq. feet
|
2 baths 3 beds |
$450,000
|
show details |
| Photo | Address | Area | Beds / Baths | Price | Details |
|---|---|---|---|---|---|

|
#11
S Slater Ave
Compton, CA 90222
|
- sq. feet
|
2 baths 3 beds |
$572,000
|
show details |

|
#12
Bohlig Rd Apt 45
Los Angeles, CA 90032
|
813 sq. feet
|
2 baths 2 beds |
show details | |

|
#13
Elburg St Unit A
Paramount, CA 90723
|
1,131 sq. feet
|
2 baths 3 beds |
show details | |

|
#14
Norwalk Blvd Apt
Hawaiian Gardens, CA 90716
|
800 sq. feet
|
2 baths 1 beds |
show details | |

|
#15
N Magnolia Ave Apt D
Anaheim, CA 92801
|
1,292 sq. feet
|
2 baths 3 beds |
show details | |

|
#16
Talbot Dr
La Mirada, CA 90638
|
505 sq. feet
|
1 baths 1 beds |
show details | |

|
#17
W Arbor St # 57
Long Beach, CA 90805
|
1,585 sq. feet
|
2 baths 3 beds |
show details | |

|
#18
Redondo Avenue, Units 5-8
Long Beach, CA 90804
|
3,360 sq. feet
|
4 baths 8 beds |
show details | |

|
#19
E 60th St
Los Angeles, CA 90001
|
1,883 sq. feet
|
3 baths 5 beds |
show details | |

|
#20
Bright Ave
Whittier, CA 90602
|
2,112 sq. feet
|
3 baths 4 beds |
show details |
| Photo | Address | Area | Beds / Baths | Price | Details |
|---|---|---|---|---|---|

|
#21
S Vancouver Ave
Los Angeles, CA 90022
|
1,772 sq. feet
|
2 baths 2 beds |
show details | |

|
#22
Ryan Ave
La Habra, CA 90631
|
2,178 sq. feet
|
3 baths 4 beds |
show details | |

|
#23
Flower St
Huntington Park, CA 90255
|
1,588 sq. feet
|
2 baths 3 beds |
show details | |

|
#24
E 135th St
Los Angeles, CA 90061
|
1,774 sq. feet
|
2 baths 4 beds |
show details | |

|
#25
Elm Ave
Long Beach, CA 90807
|
1,401 sq. feet
|
2 baths 2 beds |
show details | |

|
#26
N Cypress St
La Habra, CA 90631
|
1,296 sq. feet
|
2 baths 3 beds |
show details | |

|
#27
E Pleasant St
Long Beach, CA 90805
|
861 sq. feet
|
2 baths 2 beds |
show details | |

|
#28
N Buttonwood St
Anaheim, CA 92805
|
1,293 sq. feet
|
2 baths 3 beds |
show details | |

|
#29
Stengel St
Garden Grove, CA 92843
|
1,890 sq. feet
|
3 baths 3 beds |
show details | |

|
#30
E Fairfield St
Anaheim, CA 92807
|
2,178 sq. feet
|
3 baths 3 beds |
show details |
| Photo | Address | Area | Beds / Baths | Price | Details |
|---|---|---|---|---|---|

|
#31
Rita Ave Unit 312
Huntington Park, CA 90255
|
843 sq. feet
|
2 baths 2 beds |
show details | |

|
#32
E Mcfadden Ave Unit C
Santa Ana, CA 92705
|
1,095 sq. feet
|
2 baths 3 beds |
show details | |

|
#33
Paros Cir
Costa Mesa, CA 92626
|
2,262 sq. feet
|
3 baths 5 beds |
show details | |

|
#34
E 14th St
Long Beach, CA 90804
|
1,221 sq. feet
|
1 baths 4 beds |
show details | |

|
#35
S Gerhart Ave
Los Angeles, CA 90022
|
2,170 sq. feet
|
2 baths 4 beds |
show details | |

|
#36
Westminster Ave
Garden Grove, CA 92843
|
1,152 sq. feet
|
3 baths 2 beds |
show details | |

|
#37
Orizaba Ave
Long Beach, CA 90804
|
888 sq. feet
|
1 baths 2 beds |
show details | |

|
#38
Henley Dr # 57
Westminster, CA 92683
|
1,175 sq. feet
|
2 baths 2 beds |
show details | |

|
#39
E Theresa St Apt 13
Long Beach, CA 90814
|
566 sq. feet
|
1 baths 1 beds |
show details | |

|
#40
Karns Ave
La Puente, CA 91746
|
1,134 sq. feet
|
2 baths 3 beds |
show details |
| Photo | Address | Area | Beds / Baths | Price | Details |
|---|---|---|---|---|---|

|
#41
Rita Ave Unit 207
Huntington Park, CA 90255
|
997 sq. feet
|
2 baths 3 beds |
show details | |

|
#42
Sunglow St
Pico Rivera, CA 90660
|
1,386 sq. feet
|
1 baths 2 beds |
show details | |

|
#43
E Sunny Hills Rd
Fullerton, CA 92835
|
2,370 sq. feet
|
3 baths 4 beds |
show details | |

|
#44
Cord Ave
Pico Rivera, CA 90660
|
1,473 sq. feet
|
1 baths 3 beds |
show details | |

|
#45
Mills Rd
Garden Grove, CA 92843
|
1,308 sq. feet
|
2 baths 5 beds |
show details | |

|
#46
Comstock Ave
Whittier, CA 90602
|
2,046 sq. feet
|
3 baths 4 beds |
show details | |

|
#47
Jennrich Ave
Garden Grove, CA 92843
|
1,388 sq. feet
|
2 baths 3 beds |
show details | |

|
#48
Ocean Ave Apt 3
Seal Beach, CA 90740
|
1,294 sq. feet
|
2 baths 2 beds |
show details | |

|
#49
E 2nd St
Long Beach, CA 90803
|
1,308 sq. feet
|
1 baths 2 beds |
show details | |

|
Check over 1 million property listings on Foreclosure.com!
|
browse all offers | |||


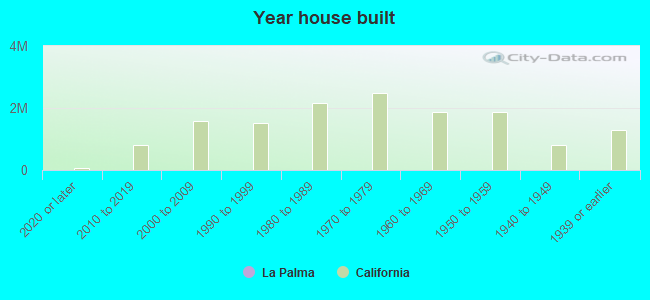
Median year apartment built: 1980
Household type by relationship:
Households: 15,404- Male householders: 2,819 (280 living alone), Female householders: 2,227 (601 living alone)
3,150 spouses (3,150 opposite-sex spouses), 105 unmarried partners, (105 opposite-sex unmarried partners), 4,875 children (4,729 natural, 76 adopted, 69 stepchildren), 483 grandchildren, 288 brothers or sisters, 442 parents, 9 foster children, 433 other relatives, 539 non-relatives
- In group quarters: 27
Size of family households: 1,290 2-persons, 1,030 3-persons, 927 4-persons, 476 5-persons, 193 6-persons, 38 7-or-more-persons.
Size of nonfamily households: 918 1-person, 180 2-persons, 71 3-persons, 13 4-persons, 13 5-persons.
2,116 married couples with children.
331 single-parent households (169 men, 162 women).
48.8% of residents of La Palma speak English at home.
11.6% of residents speak Spanish at home (81% speak English very well, 13% speak English well, 6% speak English not well).
6.2% of residents speak other Indo-European language at home (74% speak English very well, 26% speak English well).
32.9% of residents speak Asian or Pacific Island language at home (62% speak English very well, 23% speak English well, 12% speak English not well, 3% don't speak English at all).
1.1% of residents speak other language at home (76% speak English very well, 24% speak English well).
Foreign born population: 5,624 (36.5%)
(76.0% of them are naturalized citizens)
| Here: | 6.7 |
| State: | 6.0 |
| Here: | 4.1 |
| State: | 3.9 |
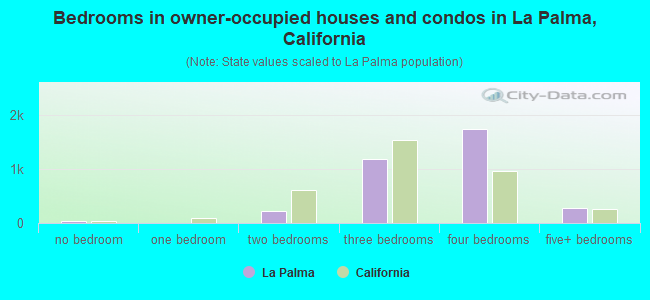
- Bedrooms in owner-occupied houses and condos in La Palma, California
- 38no bedroom
- 01 bedroom
- 2272 bedrooms
- 1,1793 bedrooms
- 1,7354 bedrooms
- 2855+ bedrooms
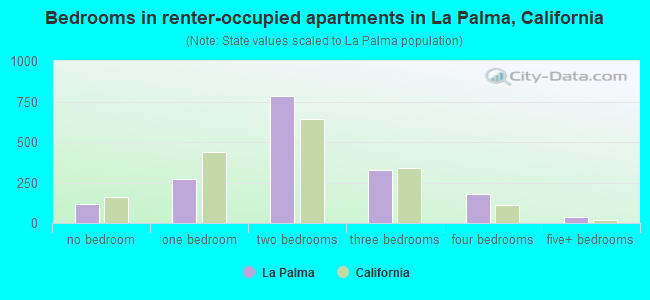
- Bedrooms in renter-occupied apartments in La Palma, California
- 116no bedroom
- 2731 bedroom
- 7812 bedrooms
- 3283 bedrooms
- 1784 bedrooms
- 375+ bedrooms
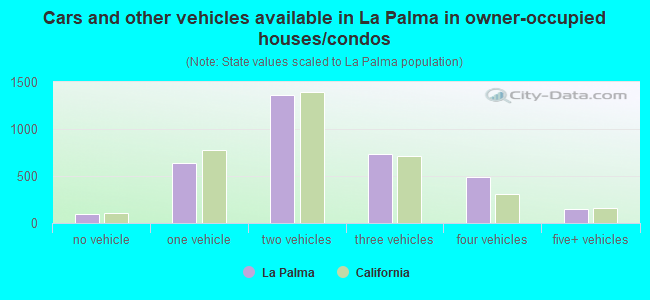
- Cars and other vehicles available in La Palma in owner-occupied houses/condos
- 93no vehicle
- 6361 vehicle
- 1,3612 vehicles
- 7383 vehicles
- 4854 vehicles
- 1515+ vehicles
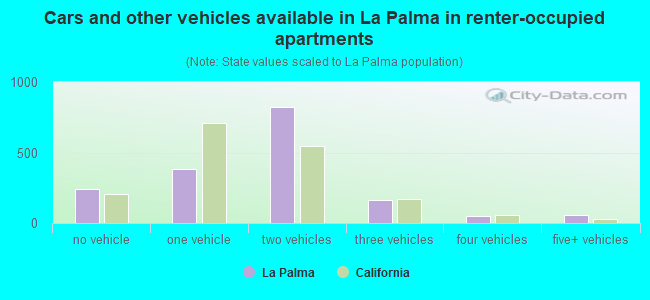
- Cars and other vehicles available in La Palma in renter-occupied apartments
- 241no vehicle
- 3821 vehicle
- 8252 vehicles
- 1633 vehicles
- 474 vehicles
- 545+ vehicles
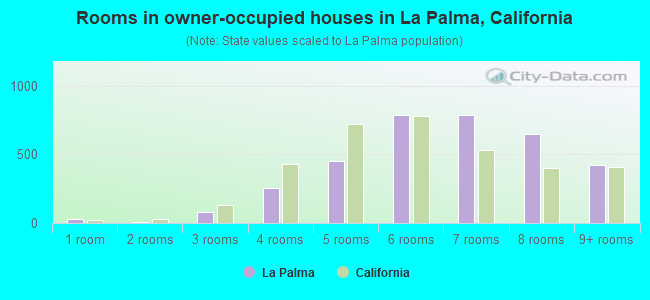
- Rooms in owner-occupied houses in La Palma, California
- 311 room
- 72 rooms
- 793 rooms
- 2554 rooms
- 4495 rooms
- 7886 rooms
- 7857 rooms
- 6468 rooms
- 4239+ rooms
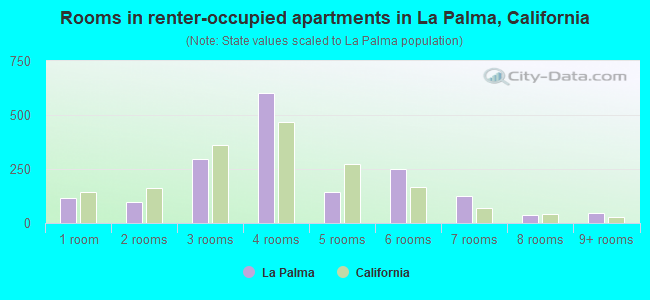
- Rooms in renter-occupied apartments in La Palma, California
- 1161 room
- 972 rooms
- 2983 rooms
- 6044 rooms
- 1425 rooms
- 2486 rooms
- 1247 rooms
- 378 rooms
- 469+ rooms
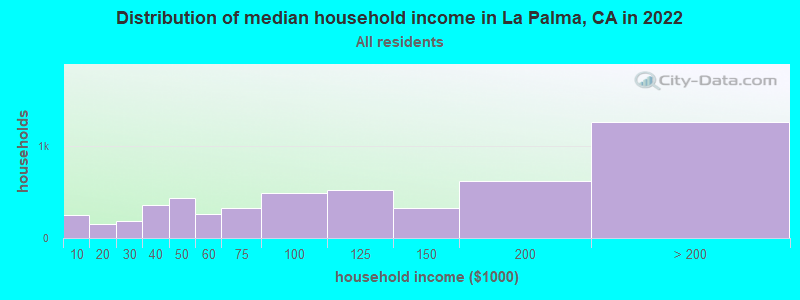
La Palma, CA household income distribution

- 251Less than $10,000
- 150$10,000 to $19,999
- 182$20,000 to $29,999
- 358$30,000 to $39,999
- 431$40,000 to $49,999
- 265$50,000 to $59,999
- 325$60,000 to $74,999
- 486$75,000 to $99,999
- 518$100,000 to $124,999
- 326$125,000 to $149,999
- 623$150,000 to $199,999
- 1,265$200,000 or more
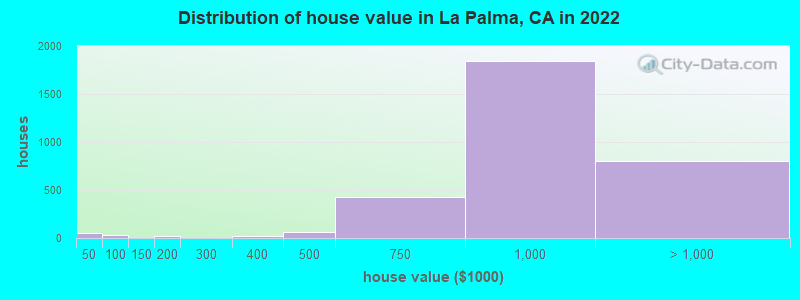
Home value of owner - occupied houses in 2022 in La Palma, CA
-
- 19Less than $10,000
- 32$10,000 to $14,999
- 5$40,000 to $49,999
- 23$80,000 to $89,999
- 17$175,000 to $199,999
- 20$300,000 to $399,999
- 62$400,000 to $499,999
- 427$500,000 to $749,999
- 1,845$750,000 to $999,999
- 702$1,000,000 to $1,499,999
- 84$1,500,000 to $1,999,999
- 12$2,000,000 or more
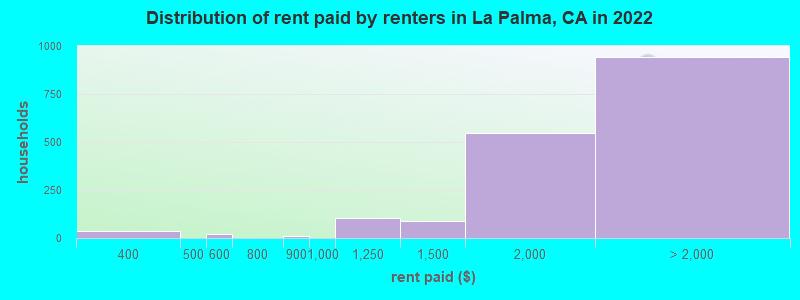
Rent paid by renters in 2022 in La Palma, CA
-
- 37$300 to $349
- 19$500 to $549
- 12$800 to $899
- 101$1,000 to $1,249
- 87$1,250 to $1,499
- 547$1,500 to $1,999
- 442$2,000 to $2,499
- 137$2,500 to $2,999
- 176$3,000 to $3,499
- 134$3,500 or more
- 51No cash rent
Percentage of workers working in this county: 56.2%
Number of people working at home: 1,035 (13.6% of all workers)
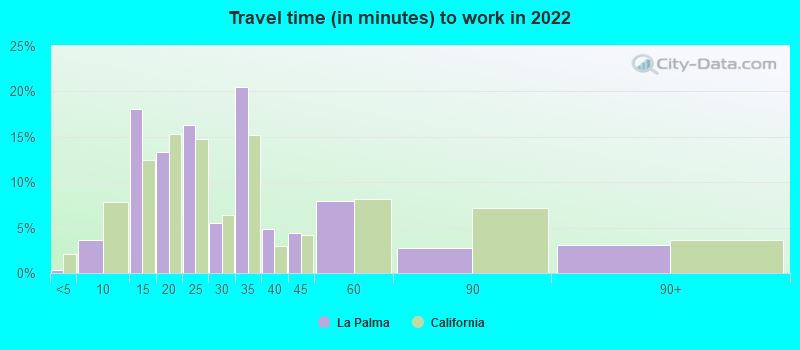
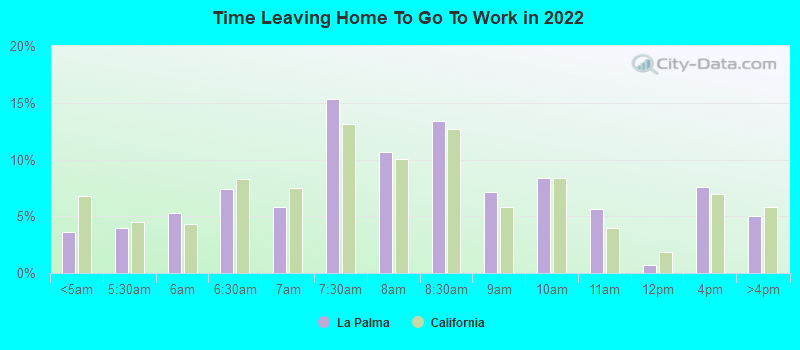
Travel time to work (commute)
- Less than 5 minutes: 22
- 5 to 9 minutes: 292
- 10 to 14 minutes: 607
- 15 to 19 minutes: 825
- 20 to 24 minutes: 939
- 25 to 29 minutes: 321
- 30 to 34 minutes: 1,012
- 35 to 39 minutes: 194
- 40 to 44 minutes: 449
- 45 to 59 minutes: 652
- 60 to 89 minutes: 855
- 90 or more minutes: 269
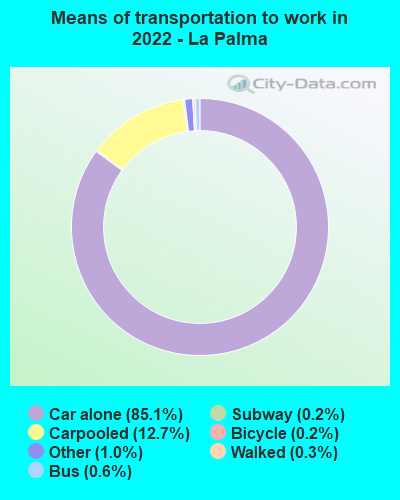
Means of transportation to work:
- Drove a car alone: 3,786 (68.7%)
- Carpooled: 613 (11.1%)
- Bus: 22 (0.4%)
- Long-distance train or commuter rail: 7 (0.1%)
- Taxi: 49 (0.9%)
- Bicycle: 9 (0.2%)
- Walked: 13 (0.2%)
- Worked at home: 1,035 (18.8%)
- Unemployment by race in 2022
- Unemployment rate for White non-Hispanic residents
- 2.5%Males
- 2.1%Females
- Unemployment rate for Black residents
- 9.2%Males
- 5.4%Females
- Unemployment rate for Asian residents
- 1.8%Males
- 2.5%Females
- Unemployment rate for other race residents
- 23.6%Females
- Unemployment rate for two or more race residents
- 5.1%Males
- 4.4%Females
- Unemployment rate for Hispanic or Latino residents
- 6.7%Males
- 9.0%Females
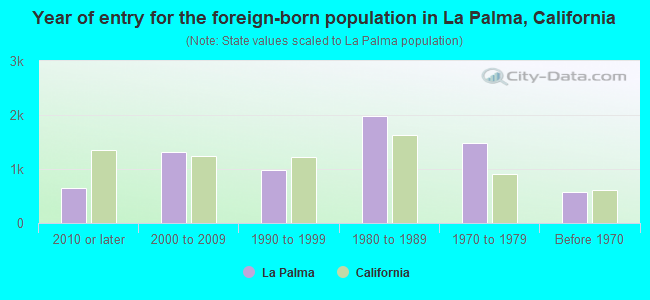
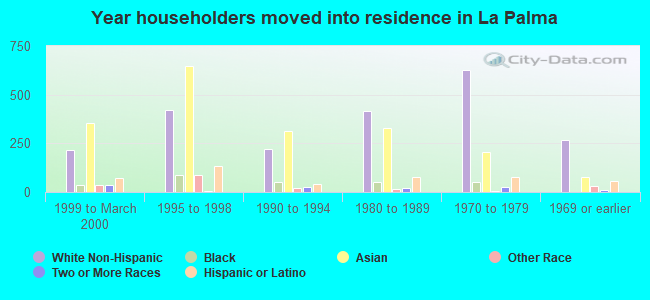
- Year of entry for the foreign-born population in La Palma, California
- 6532010 or later
- 1,3242000 to 2009
- 9771990 to 1999
- 1,9781980 to 1989
- 1,4831970 to 1979
- 578Before 1970
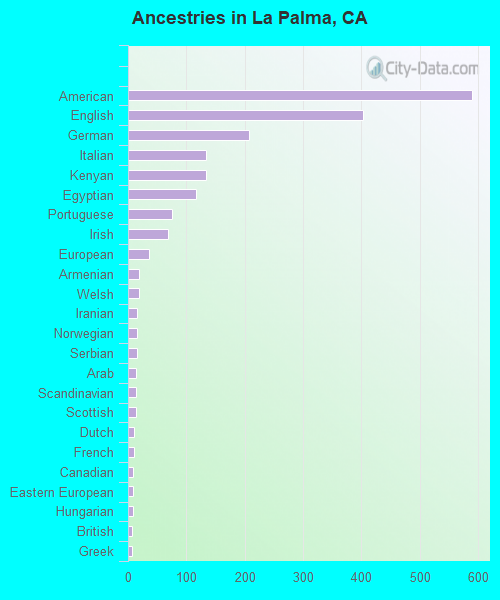
First ancestries reported:
- American: 589 (6.0%)
- English: 402 (4.1%)
- German: 208 (2.1%)
- Italian: 134 (1.4%)
- Kenyan: 133 (1.4%)
- Egyptian: 117 (1.2%)
- Portuguese: 76 (0.8%)
- Irish: 69 (0.7%)
- European: 36 (0.4%)
- Armenian: 18 (0.2%)
- Welsh: 18 (0.2%)
- Iranian: 16 (0.2%)
- Norwegian: 15 (0.2%)
- Serbian: 15 (0.2%)
- Arab: 14 (0.1%)
- Scandinavian: 14 (0.1%)
- Scottish: 14 (0.1%)
- Dutch: 11 (0.1%)
- French: 10 (0.1%)
- Canadian: 8 (0.08%)
- Eastern European: 8 (0.08%)
- Hungarian: 8 (0.08%)
- British: 6 (0.06%)
- Greek: 6 (0.06%)
- Lebanese: 4 (0.04%)
- Polish: 4 (0.04%)
Most common places of birth for foreign-born residents (%):
| La Palma: | 30.0% (1,687) |
| California: | 7.8% (818,297) |
| La Palma: | 20.4% (1,148) |
| California: | 3.0% (315,248) |
| La Palma: | 9.9% (554) |
| California: | 5.2% (539,184) |
| La Palma: | 7.2% (406) |
| California: | 1.7% (176,274) |
| La Palma: | 5.4% (306) |
| California: | 37.2% (3,881,193) |
| La Palma: | 3.6% (201) |
| California: | 6.6% (684,672) |
| La Palma: | 2.6% (144) |
| California: | 0.5% (55,249) |
| La Palma: | 2.5% (139) |
| California: | 4.9% (512,335) |
| La Palma: | 2.0% (113) |
| California: | 0.5% (49,399) |
| La Palma: | 1.9% (106) |
| California: | 1.2% (127,477) |
| La Palma: | 1.6% (91) |
| California: | 0.6% (65,335) |
Place of birth for U.S.-born residents:
- This state: 7,856
- Other state: 1,729
- Northeast: 316
- Midwest: 621
- South: 239
- West: 542
90.5% of La Palma residents lived in the same house 1 years ago.
Out of people who lived in different houses, 21.2% lived in this county.
Out of people who lived in different counties, 91.9% lived in California.
| La Palma: | 90.5% |
| State average: | 88.9% |
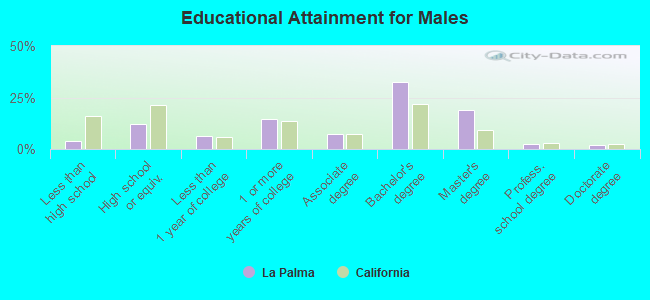
Education attainment for males 25 years and older:
- No schooling: 0
- Nursery to 4th grade: 44
- 5th and 6th grade: 38
- 7th and 8th grade: 66
- 9th grade: 0
- 10th grade: 0
- 11th grade: 27
- 12th grade, no diploma: 24
- High school graduate (or equivalency): 643
- Less than 1 year of college: 319
- Some college more than 1 year, no degree: 769
- Associate degree: 388
- Bachelor's degree: 1,683
- Master's degree: 981
- Professional school degree: 118
- Doctorate degree: 97
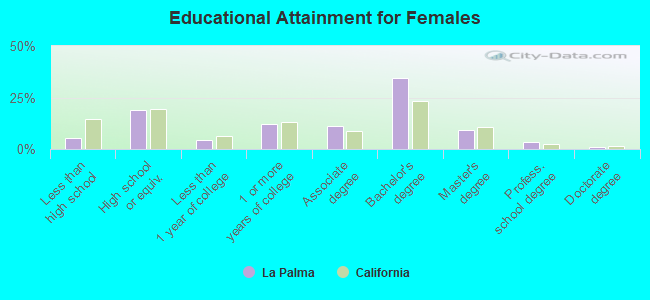
Education attainment for females 25 years and older:
- No schooling: 76
- Nursery to 4th grade: 0
- 5th and 6th grade: 77
- 7th and 8th grade: 14
- 9th grade: 6
- 10th grade: 13
- 11th grade: 36
- 12th grade, no diploma: 114
- High school graduate (or equivalency): 1,171
- Less than 1 year of college: 261
- Some college more than 1 year, no degree: 737
- Associate degree: 674
- Bachelor's degree: 2,134
- Master's degree: 572
- Professional school degree: 216
- Doctorate degree: 59
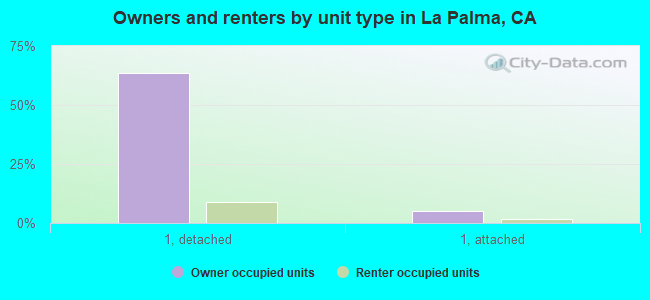
Housing units in structures:
- One, detached: 3,564
- One, attached: 449
- Two: 8
- 3 or 4: 49
- 5 to 9: 197
- 10 to 19: 190
- 20 to 49: 176
- 50 or more: 588
- Mobile homes: 45
Housing units lacking complete kitchen facilities in 2022: 4.9%
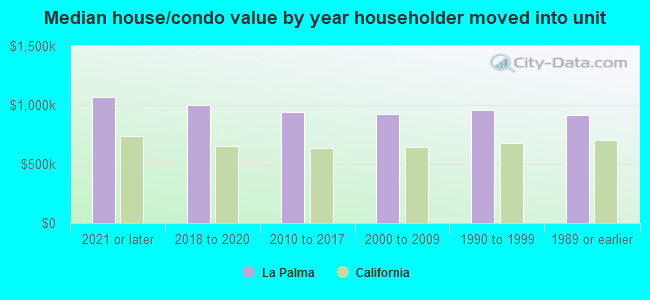
House/condo owner moved in on average 19 years ago
Renter moved in on average 6 years ago
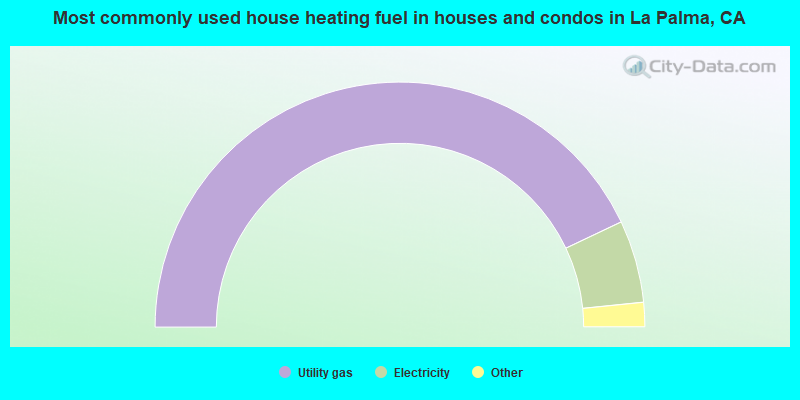
- 85.9%Utility gas
- 10.9%Electricity
- 1.1%Solar energy
- 1.1%No fuel used
- 0.9%Bottled, tank, or LP gas
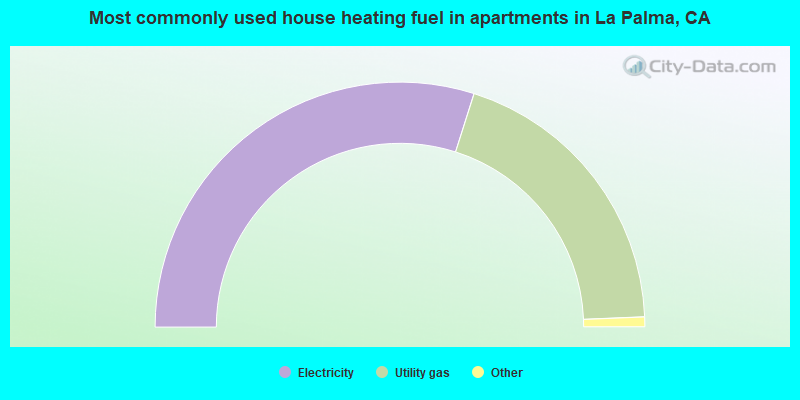
- 59.8%Electricity
- 38.9%Utility gas
- 0.8%No fuel used
- 0.5%Bottled, tank, or LP gas
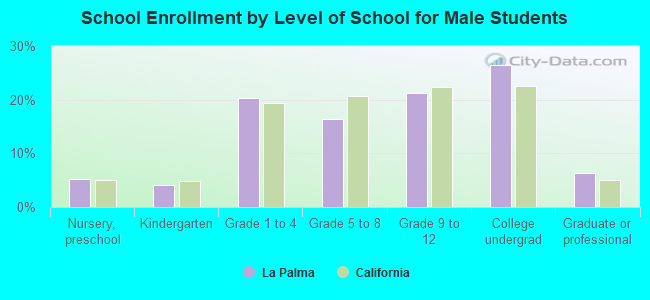
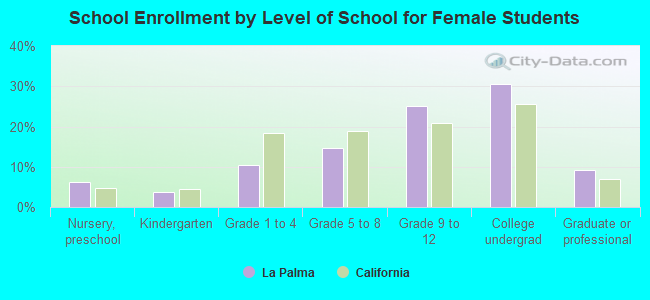
Private vs. public school enrollment:
| Here: | 28.6% |
| California: | 10.5% |
| Here: | 15.7% |
| California: | 8.5% |
| Here: | 12.4% |
| California: | 15.9% |