Kyle, TX (Texas) Houses and Residents
Estimated median house or condo value in 2022: $322,907 (it was $90,900 in 2000 )
Kyle:
$322,907Texas:
$275,400
Lower value quartile - upper value quartile: $287,601 - $434,575Mean price in 2022: Detached houses: $282,841 Here:
$282,841State:
$369,058
Townhouses or other attached units: $267,453 Here:
$267,453State:
$327,631
Mobile homes: $170,724 Here:
$170,724State:
$124,413
Total population: 32,881 (Urban population: 5,339 (all inside urban clusters), Rural population: 10 (all nonfarm) )
Houses: 19,776 (19,109 occupied: 13,126 owner occupied, 6,539 renter occupied )
% of renters here:
33%State:
38%
Housing density: 3,346 houses/condos per square mile
Median price asked for vacant for-sale houses and condos in 2022: $372,956.
Median contract rent in 2022: $1,411 (lower quartile is $1,089, upper quartile is $1,676)
Median rent asked for vacant for-rent units in 2022: $954
Median gross rent in Kyle, TX in 2022: $1,519
Housing units in Kyle with a mortgage: 10,867 (162 second mortgage, 0 home equity loan, 64 both second mortgage and home equity loan )Houses without a mortgage: 113
Median household income for houses/condos with a mortgage: $104,782
Median household income for apartments without a mortgage: $93,184
Median monthly housing costs: $1,711
Data:
Median house or condo value ($)
Median house or condo value ($ change since 2000)
Median house or condo value ($) - White
Median house or condo value ($) - Black or African American
Median house or condo value ($) - Asian
Median house or condo value ($) - Hispanic or Latino
Median house or condo value ($) - American Indian and Alaska Native
Median house or condo value ($) - Multirace
Median house or condo value ($) - Other Race
Median price asked for mobile homes ($)
Household density (households per square mile)
Mean house or condo value by units in structure - 1, detached ($)
Mean house or condo value by units in structure - 1, attached ($)
Mean house or condo value by units in structure - 2 ($)
Mean house or condo value by units in structure by units in structure - 3 or 4 ($)
Mean house or condo value by units in structure - 5 or more ($)
Mean house or condo value by units in structure - Boat, RV, van, etc. ($)
Mean house or condo value by units in structure - Mobile home ($)
Median contract rent ($)
Median contract rent - Lower quartile ($)
Median contract rent - Upper quartile ($)
Median gross rent ($)
Urban houses (%)
Rural houses (%)
Houses occupied (%)
Houses occupied (% change since 2000)
Houses owner occupied (%)
Houses owner occupied (% change since 2000)
Houses renter occupied (%)
Houses renter occupied (% change since 2000)
Vacant housing units - For rent (%)
Vacant housing units - For rent (% change since 2000)
Vacant housing units - For sale only (%)
Vacant housing units - For sale only (% change since 2000)
Vacant housing units - Rented or sold, not occupied (%)
Vacant housing units - Rented or sold, not occupied (% change since 2000)
Vacant housing units - For seasonal, recreational, or occasional use (%)
Vacant housing units - For seasonal, recreational, or occasional use (% change since 2000)
Vacant housing units - For migrant workers (%)
Vacant housing units - For migrant workers (% change since 2000)
Vacant housing units - Other vacant (%)
Vacant housing units - Other vacant (% change since 2000)
Median monthly housing costs ($)
Median household income for houses/condos with a mortgage ($)
Median household income for houses/condos without a mortgage ($)
Median household income ($)
Median household income ($) - White
Median household income ($) - Black or African American
Median household income ($) - Asian
Median household income ($) - Hispanic or Latino
Median household income ($) - American Indian and Alaska Native
Median household income ($) - Multirace
Median household income ($) - Other Race
Mortgage status - with mortgage (%)
Mortgage status - with second mortgage (%)
Mortgage status - with home equity loan (%)
Mortgage status - with both second mortgage and home equity loan (%)
Mortgage status - without a mortgage (%)
Median year house/condo built
Median year apartment built
Household type by relationship - Male householder living alone (%)
Household type by relationship - Male householder not living alone (%)
Household type by relationship - Female householder living alone (%)
Household type by relationship - Female householder not living alone (%)
Household type by relationship - Opposite-Sex spouse (%)
Household type by relationship - Same-Sex spouse (%)
Household type by relationship - Opposite-Sex unmarried partner (%)
Household type by relationship - Same-Sex unmarried partner (%)
Household type by relationship - In group quarters (%)
Size of family households - 2-person household (%)
Size of family households - 3-person household (%)
Size of family households - 4-person household (%)
Size of family households - 5-person household (%)
Size of family households - 6-person household (%)
Size of family households - 7-or-more-person household (%)
Size of nonfamily households - 1-person household (%)
Size of nonfamily households - 2-person household (%)
Size of nonfamily households - 3-person household (%)
Size of nonfamily households - 4-person household (%)
Size of nonfamily households - 5-person household (%)
Size of nonfamily households - 6-person household (%)
Size of nonfamily households - 7-or-moreperson household (%)
Year house built - Built 2010 or later (%)
Year house built - Built 2000 to 2009 (%)
Year house built - Built 1990 to 1999 (%)
Year house built - Built 1980 to 1989 (%)
Year house built - Built 1970 to 1979 (%)
Year house built - Built 1960 to 1969 (%)
Year house built - Built 1950 to 1959 (%)
Year house built - Built 1940 to 1949 (%)
Year house built - Built 1939 or earlier (%)
Median number of rooms in houses and condos
Median number of rooms in apartments
Median number of bedrooms in owner occupied houses
Mean number of bedrooms in owner occupied houses
Median number of bedrooms in renter occupied houses
Mean number of bedrooms in renter occupied houses
Median number of vehichles in owner occupied houses
Mean number of vehichles in owner occupied houses
Median number of vehichles in renter occupied houses
Mean number of vehichles in renter occupied houses
Rooms in owner-occupied houses - 1 room (%)
Rooms in owner-occupied houses - 2 rooms (%)
Rooms in owner-occupied houses - 3 rooms (%)
Rooms in owner-occupied houses - 4 rooms (%)
Rooms in owner-occupied houses - 5 rooms (%)
Rooms in owner-occupied houses - 6 rooms (%)
Rooms in owner-occupied houses - 7 rooms (%)
Rooms in owner-occupied houses - 8 rooms (%)
Rooms in owner-occupied houses - 9+ rooms (%)
Rooms in renter-occupied houses - 1 room (%)
Rooms in renter-occupied houses - 2 rooms (%)
Rooms in renter-occupied houses - 3 rooms (%)
Rooms in renter-occupied houses - 4 rooms (%)
Rooms in renter-occupied houses - 5 rooms (%)
Rooms in renter-occupied houses - 6 rooms (%)
Rooms in renter-occupied houses - 7 rooms (%)
Rooms in renter-occupied houses - 8 rooms (%)
Rooms in renter-occupied houses - 9+ rooms (%)
Bedrooms in owner-occupied houses - no bedrooms (%)
Bedrooms in owner-occupied houses - 1 bedroom (%)
Bedrooms in owner-occupied houses - 2 bedrooms (%)
Bedrooms in owner-occupied houses - 3 bedrooms (%)
Bedrooms in owner-occupied houses - 4 bedrooms (%)
Bedrooms in owner-occupied houses - 5+ bedrooms (%)
Bedrooms in renter-occupied houses - no bedrooms (%)
Bedrooms in renter-occupied houses - 1 bedroom (%)
Bedrooms in renter-occupied houses - 2 bedrooms (%)
Bedrooms in renter-occupied houses - 3 bedrooms (%)
Bedrooms in renter-occupied houses - 4 bedrooms (%)
Bedrooms in renter-occupied houses - 5+ bedrooms (%)
Vehicles available in owner-occupied houses - no vehicle available (%)
Vehicles available in owner-occupied houses - 1 vehicle available(%)
Vehicles available in owner-occupied houses - 2 Vehicles available (%)
Vehicles available in owner-occupied houses - 3 Vehicles available (%)
Vehicles available in owner-occupied houses - 4 Vehicles available (%)
Vehicles available in owner-occupied houses - 5+ Vehicles available (%)
Vehicles available in renter-occupied houses - no vehicle available (%)
Vehicles available in renter-occupied houses - 1 vehicle available (%)
Vehicles available in renter-occupied houses - 2 Vehicles available (%)
Vehicles available in renter-occupied houses - 3 Vehicles available (%)
Vehicles available in renter-occupied houses - 4 Vehicles available (%)
Vehicles available in renter-occupied houses - 5+ Vehicles available (%)
Housing units in structures - 1, detached (%)
Housing units in structures - 1, attached (%)
Housing units in structures - 2 (%)
Housing units in structures - 3 or 4 (%)
Housing units in structures - 5 to 9 (%)
Housing units in structures - 10 to 19 (%)
Housing units in structures - 20 to 49 (%)
Housing units in structures - 50 or more (%)
Housing units in structures - Mobile home (%)
Housing units in structures - Boat, RV, van, etc. (%)
Housing units in structures - Owners - 1, detached (%)
Housing units in structures - Owners - 1, attached (%)
Housing units in structures - Owners - 2 (%)
Housing units in structures - Owners - 3 or 4 (%)
Housing units in structures - Owners - 5 to 9 (%)
Housing units in structures - Owners - 10 to 19 (%)
Housing units in structures - Owners - 20 to 49 (%)
Housing units in structures - Owners - 50 or more (%)
Housing units in structures - Owners - Mobile home (%)
Housing units in structures - Owners - Boat, RV, van, etc. (%)
Housing units in structures - Renters - 1, detached (%)
Housing units in structures - Renters - 1, attached (%)
Housing units in structures - Renters - 2 (%)
Housing units in structures - Renters - 3 or 4 (%)
Housing units in structures - Renters - 5 to 9 (%)
Housing units in structures - Renters - 10 to 19 (%)
Housing units in structures - Renters - 20 to 49 (%)
Housing units in structures - Renters - 50 or more (%)
Housing units in structures - Renters - Mobile home (%)
Housing units in structures - Renters - Boat, RV, van, etc. (%)
House/condo owner moved in on average (years ago)
Renter moved in on average (years ago)
Year householder moved into unit - Moved in 1999 to March 2000 (%)
Year householder moved into unit - Moved in 1999 to March 2000 (%) - White
Year householder moved into unit - Moved in 1999 to March 2000 (%) - Black or African American
Year householder moved into unit - Moved in 1999 to March 2000 (%) - Asian
Year householder moved into unit - Moved in 1999 to March 2000 (%) - Hispanic or Latino
Year householder moved into unit - Moved in 1999 to March 2000 (%) - American Indian and Alaska Native
Year householder moved into unit - Moved in 1999 to March 2000 (%) - Multirace
Year householder moved into unit - Moved in 1999 to March 2000 (%) - Other Race
Year householder moved into unit - Moved in 1995 to 1998 (%)
Year householder moved into unit - Moved in 1995 to 1998 (%) - White
Year householder moved into unit - Moved in 1995 to 1998 (%) - Black or African American
Year householder moved into unit - Moved in 1995 to 1998 (%) - Asian
Year householder moved into unit - Moved in 1995 to 1998 (%) - Hispanic or Latino
Year householder moved into unit - Moved in 1995 to 1998 (%) - American Indian and Alaska Native
Year householder moved into unit - Moved in 1995 to 1998 (%) - Multirace
Year householder moved into unit - Moved in 1995 to 1998 (%) - Other Race
Year householder moved into unit - Moved in 1990 to 1994 (%)
Year householder moved into unit - Moved in 1990 to 1994 (%) - White
Year householder moved into unit - Moved in 1990 to 1994 (%) - Black or African American
Year householder moved into unit - Moved in 1990 to 1994 (%) - Asian
Year householder moved into unit - Moved in 1990 to 1994 (%) - Hispanic or Latino
Year householder moved into unit - Moved in 1990 to 1994 (%) - American Indian and Alaska Native
Year householder moved into unit - Moved in 1990 to 1994 (%) - Multirace
Year householder moved into unit - Moved in 1990 to 1994 (%) - Other Race
Year householder moved into unit - Moved in 1980 to 1989 (%)
Year householder moved into unit - Moved in 1980 to 1989 (%) - White
Year householder moved into unit - Moved in 1980 to 1989 (%) - Black or African American
Year householder moved into unit - Moved in 1980 to 1989 (%) - Asian
Year householder moved into unit - Moved in 1980 to 1989 (%) - Hispanic or Latino
Year householder moved into unit - Moved in 1980 to 1989 (%) - American Indian and Alaska Native
Year householder moved into unit - Moved in 1980 to 1989 (%) - Multirace
Year householder moved into unit - Moved in 1980 to 1989 (%) - Other Race
Year householder moved into unit - Moved in 1970 to 1979 (%)
Year householder moved into unit - Moved in 1970 to 1979 (%) - White
Year householder moved into unit - Moved in 1970 to 1979 (%) - Black or African American
Year householder moved into unit - Moved in 1970 to 1979 (%) - Asian
Year householder moved into unit - Moved in 1970 to 1979 (%) - Hispanic or Latino
Year householder moved into unit - Moved in 1970 to 1979 (%) - American Indian and Alaska Native
Year householder moved into unit - Moved in 1970 to 1979 (%) - Multirace
Year householder moved into unit - Moved in 1970 to 1979 (%) - Other Race
Year householder moved into unit - Moved in 1969 or earlier (%)
Year householder moved into unit - Moved in 1969 or earlier (%) - White
Year householder moved into unit - Moved in 1969 or earlier (%) - Black or African American
Year householder moved into unit - Moved in 1969 or earlier (%) - Asian
Year householder moved into unit - Moved in 1969 or earlier (%) - Hispanic or Latino
Year householder moved into unit - Moved in 1969 or earlier (%) - American Indian and Alaska Native
Year householder moved into unit - Moved in 1969 or earlier (%) - Multirace
Year householder moved into unit - Moved in 1969 or earlier (%) - Other Race
Housing units lacking complete plumbing facilities (%)
Housing units lacking complete kitchen facilities (%)
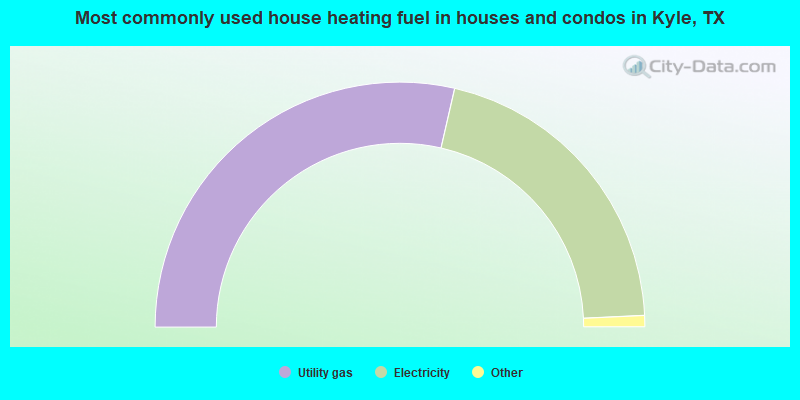
House heating fuel used in houses and condos - Utility gas (%)
House heating fuel used in houses and condos - Bottled, tank, or LP gas (%)
House heating fuel used in houses and condos - Electricity (%)
House heating fuel used in houses and condos - Fuel oil, kerosene, etc. (%)
House heating fuel used in houses and condos - Coal or coke (%)
House heating fuel used in houses and condos - Wood (%)
House heating fuel used in houses and condos - Solar energy (%)
House heating fuel used in houses and condos - Other fuel (%)
House heating fuel used in houses and condos - No fuel used (%)
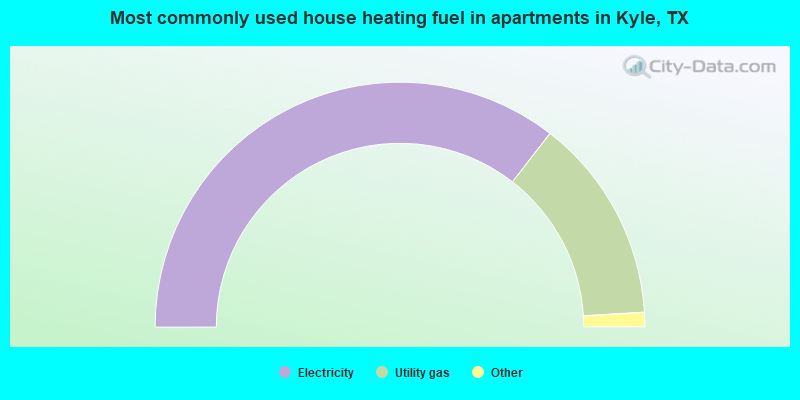
House heating fuel used in apartments - Utility gas (%)
House heating fuel used in apartments - Bottled, tank, or LP gas (%)
House heating fuel used in apartments - Electricity (%)
House heating fuel used in apartments - Fuel oil, kerosene, etc. (%)
House heating fuel used in apartments - Coal or coke (%)
House heating fuel used in apartments - Wood (%)
House heating fuel used in apartments - Solar energy (%)
House heating fuel used in apartments - Other fuel (%)
House heating fuel used in apartments - No fuel used (%)
Latest news about housing in Kyle, TX collected exclusively by city-data.com from local newspapers, TV, and radio stations
Median year house/condo built: 2011Median year apartment built: 2012Household type by relationship:
Households: 53,201
Male householders: 9,370 (2,169 living alone ), Female householders: 9,629 (2,050 living alone )9,423 spouses (9,344 opposite-sex spouses ), 2,106 unmarried partners , (2,026 opposite-sex unmarried partners ), 17,229 children (15,461 natural , 364 adopted , 1,404 stepchildren ), 1,232 grandchildren , 854 brothers or sisters , 669 parents , 303 foster children , 595 other relatives , 1,204 non-relatives In group quarters: 579
Size of family households: 5,007 2-persons , 2,582 3-persons , 3,113 4-persons , 1,599 5-persons , 691 6-persons , 802 7-or-more-persons .
Size of nonfamily households: 3,828 1-person , 1,559 2-persons , 319 3-persons .
10,429 married couples with children. single-parent households (699 men , 1,189 women ).
68.4% of residents of Kyle speak English at home. of residents speak Spanish at home (65% speak English very well , 25% speak English well , 9% speak English not well , 1% don't speak English at all ).of residents speak other Indo-European language at home (100% speak English very well ).of residents speak Asian or Pacific Island language at home (73% speak English very well , 21% speak English well , 6% speak English not well ).of residents speak other language at home (90% speak English very well , 5% speak English well , 5% speak English not well ).
Foreign born population: 4,313 (8.1%)of them are naturalized citizens )
Median number of rooms in houses and condos:
Median number of rooms in apartments
Owner-occupied Renter-occupied
Rooms in owner-occupied houses in Kyle, Texas
0 1 room 18 2 rooms 106 3 rooms 989 4 rooms 2,913 5 rooms 3,491 6 rooms 2,108 7 rooms 2,168 8 rooms 1,333 9+ rooms
Rooms in renter-occupied apartments in Kyle, Texas
196 1 room 1,104 2 rooms 1,119 3 rooms 1,256 4 rooms 1,231 5 rooms 852 6 rooms 577 7 rooms 109 8 rooms 95 9+ rooms
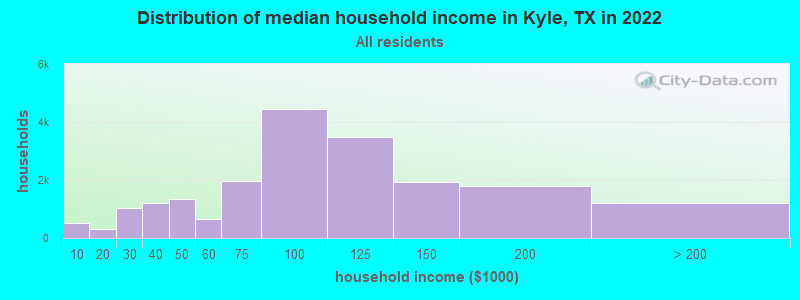
Kyle, TX household income distribution 517 Less than $10,000308 $10,000 to $19,9991,031 $20,000 to $29,9991,196 $30,000 to $39,9991,347 $40,000 to $49,999657 $50,000 to $59,9991,976 $60,000 to $74,9994,459 $75,000 to $99,9993,495 $100,000 to $124,9991,944 $125,000 to $149,9991,807 $150,000 to $199,9991,191 $200,000 or more
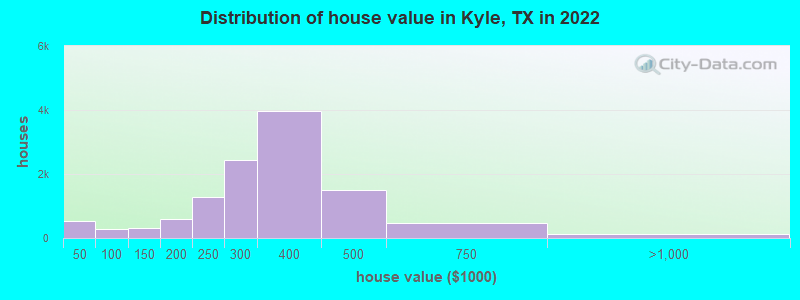
Home value of owner - occupied houses in 2022 in Kyle, TX 177 Less than $10,00060 $10,000 to $14,99983 $15,000 to $19,99919 $25,000 to $29,99916 $30,000 to $34,999159 $40,000 to $49,99919 $50,000 to $59,99919 $70,000 to $79,99990 $80,000 to $89,999204 $100,000 to $124,999104 $125,000 to $149,999266 $150,000 to $174,999318 $175,000 to $199,9991,275 $200,000 to $249,9992,446 $250,000 to $299,9993,955 $300,000 to $399,9991,504 $400,000 to $499,999465 $500,000 to $749,999138 $750,000 to $999,999Rent paid by renters in 2022 in Kyle, TX 101 $300 to $34921 $400 to $44927 $550 to $59994 $650 to $699129 $700 to $749390 $800 to $89982 $900 to $9991,013 $1,000 to $1,2491,556 $1,250 to $1,4991,862 $1,500 to $1,999116 $2,000 to $2,49922 $2,500 to $2,999126 No cash rent
Percentage of workers working in this county: 47.1%Number of people working at home: 3,665 (12.4% of all workers )
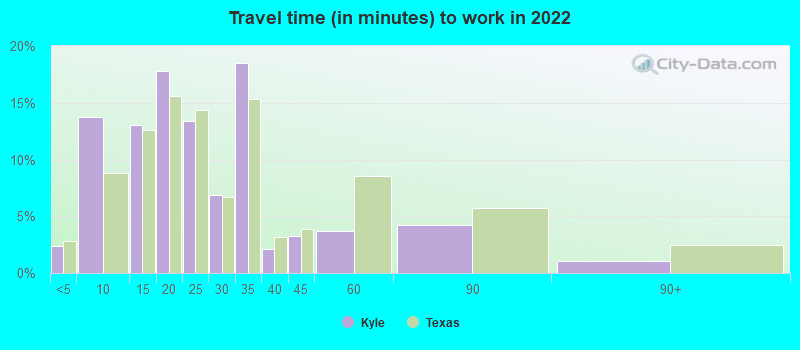
Travel time to work (commute)
Less than 5 minutes: 5145 to 9 minutes: 1,71510 to 14 minutes: 1,81115 to 19 minutes: 2,31720 to 24 minutes: 3,04425 to 29 minutes: 1,60430 to 34 minutes: 3,04835 to 39 minutes: 50340 to 44 minutes: 1,71245 to 59 minutes: 4,64160 to 89 minutes: 2,65690 or more minutes: 1,216
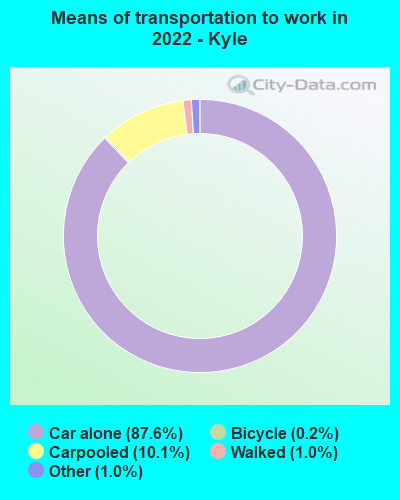
Means of transportation to work:
Drove a car alone: 12,041 (68.4%)Carpooled: 1,445 (8.2%)Taxi: 182 (1.0%)Bicycle: 27 (0.2%)Walked: 105 (0.6%)Worked at home: 3,665 (20.8%)
Unemployment by race in 2022
Unemployment rate for White non-Hispanic residents 1.7% Males2.0% FemalesUnemployment rate for Black residents 17.5% MalesUnemployment rate for American Indian and Alaska Native residents 24.5% MalesUnemployment rate for other race residents 1.6% MalesUnemployment rate for two or more race residents 3.5% Males0.8% FemalesUnemployment rate for Hispanic or Latino residents 2.4% Males1.2% Females
Year of entry for the foreign-born population in Kyle, Texas
874 2010 or later 1,214 2000 to 2009 1,029 1990 to 1999 141 1980 to 1989 77 1970 to 1979 35 Before 1970
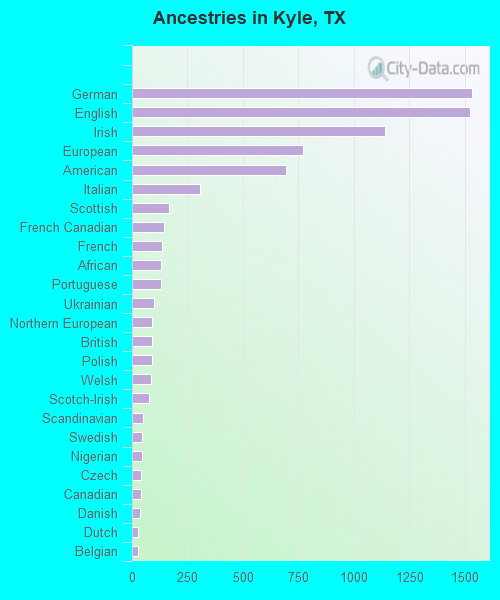
First ancestries reported:
German: 1,532 (5.4%)
English: 1,525 (5.4%)
Irish: 1,138 (4.0%)
European: 771 (2.7%)
American: 695 (2.5%)
Italian: 306 (1.1%)
Scottish: 165 (0.6%)
French Canadian: 143 (0.5%)
French: 133 (0.5%)
African: 131 (0.5%)
Portuguese: 129 (0.5%)
Ukrainian: 100 (0.4%)
Northern European: 92 (0.3%)
British: 91 (0.3%)
Polish: 90 (0.3%)
Welsh: 86 (0.3%)
Scotch-Irish: 75 (0.3%)
Scandinavian: 51 (0.2%)
Swedish: 46 (0.2%)
Nigerian: 43 (0.2%)
Czech: 40 (0.1%)
Canadian: 39 (0.1%)
Danish: 37 (0.1%)
Dutch: 29 (0.1%)
Belgian: 29 (0.1%)
Slovak: 28 (0.10%)
Ghanaian: 24 (0.08%)
Lebanese: 20 (0.07%)
Arab: 18 (0.06%)
Greek: 16 (0.06%)
Norwegian: 14 (0.05%)
Australian: 11 (0.04%)
Eastern European: 7 (0.02%)
Hungarian: 4 (0.01%) Most common places of birth for foreign-born residents (%): Mexico Kyle:
60.7% (2,763)Texas:
48.4% (2,411,723)
Dominican Republic Kyle:
9.0% (411)Texas:
0.3% (13,763)
Philippines Kyle:
4.7% (214)Texas:
2.1% (103,148)
Honduras Kyle:
2.2% (101)Texas:
3.0% (147,182)
England Kyle:
2.0% (92)Texas:
0.4% (20,885)
Nicaragua Kyle:
2.0% (90)Texas:
0.4% (18,642)
Guatemala Kyle:
1.8% (84)Texas:
1.8% (87,382)
Zimbabwe Kyle:
1.6% (75)Texas:
0.1% (4,593)
Place of birth for U.S.-born residents:
This state: 33,971Other state: 12,919Northeast: 1,671Midwest: 3,543South: 3,678West: 3,973 88.9% of Kyle residents lived in the same house 1 years ago.
Out of people who lived in different houses, 16.6% lived in this county.
Out of people who lived in different counties, 79.4% lived in Texas.
Kyle:
88.9%State average:
85.7%
Education attainment for males 25 years and older:
No schooling: 145Nursery to 4th grade: 565th and 6th grade: 1977th and 8th grade: 779th grade: 10210th grade: 12611th grade: 30212th grade, no diploma: 743High school graduate (or equivalency): 4,234Less than 1 year of college: 2,280Some college more than 1 year, no degree: 1,838Associate degree: 1,378Bachelor's degree: 3,976Master's degree: 1,649Professional school degree: 133Doctorate degree: 136
Education attainment for females 25 years and older:
No schooling: 278Nursery to 4th grade: 05th and 6th grade: 2317th and 8th grade: 1939th grade: 5310th grade: 10711th grade: 12112th grade, no diploma: 85High school graduate (or equivalency): 3,724Less than 1 year of college: 1,472Some college more than 1 year, no degree: 1,759Associate degree: 1,765Bachelor's degree: 4,673Master's degree: 1,654Professional school degree: 74Doctorate degree: 140
Housing units in structures:
One, detached: 14,697One, attached: 412Two: 673 or 4: 815 to 9: 26310 to 19: 1,30720 to 49: 89250 or more: 881Mobile homes: 1,170Median worth of mobile homes: $125,633
Housing units lacking complete plumbing facilities in 2022: 0.4%Housing units lacking complete kitchen facilities in 2022: 0.5%House/condo owner moved in on average 6 years ago
Renter moved in on average 0 years ago
Private vs. public school enrollment:
Students in private schools in grades 1 to 8 (elementary and middle school): 499 Students in private schools in grades 9 to 12 (high school): 115 Students in private undergraduate colleges: 678