Kentwood, MI (Michigan) Houses and Residents
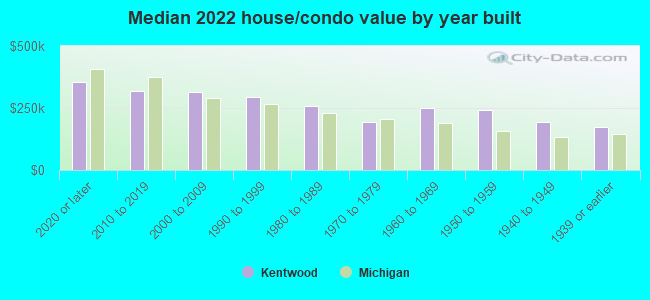
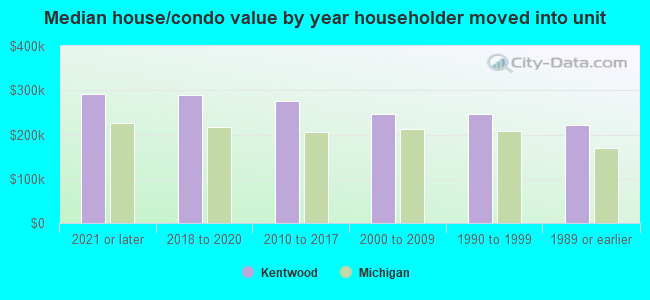
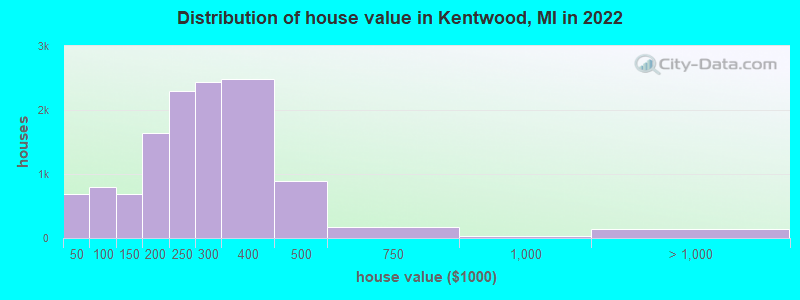
Estimated median house or condo value in 2022: $263,552 (it was $114,000 in 2000 )
Kentwood:
$263,552Michigan:
$224,400
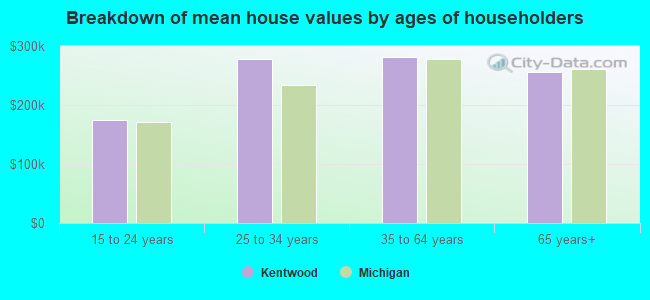
Lower value quartile - upper value quartile: $190,522 - $329,239Mean price in 2022: Detached houses: $297,829 Here:
$297,829State:
$280,038
Townhouses or other attached units: $180,981 Here:
$180,981State:
$239,520
In 2-unit structures: $306,155 Here:
$306,155State:
$219,481
In 3-to-4-unit structures: $142,524 Here:
$142,524State:
$207,067
In 5-or-more-unit structures: $152,547 Here:
$152,547State:
$192,733
Mobile homes: $41,576 Here:
$41,576State:
$72,868
Total population: 50,764 (Urban population: 45,136, Rural population: 103 (all nonfarm) )
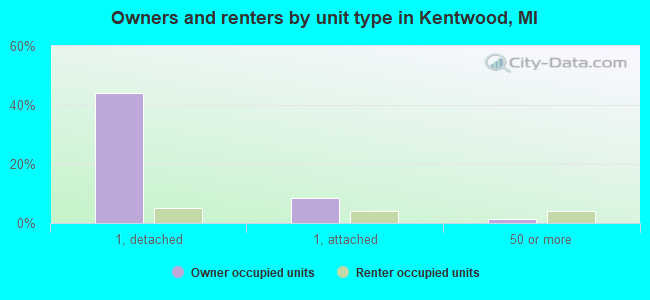
Houses: 22,447 (21,783 occupied: 12,928 owner occupied, 8,847 renter occupied )
% of renters here:
41%State:
27%
Housing density: 1,067 houses/condos per square mile
Median price asked for vacant for-sale houses and condos in 2022: $280,606.
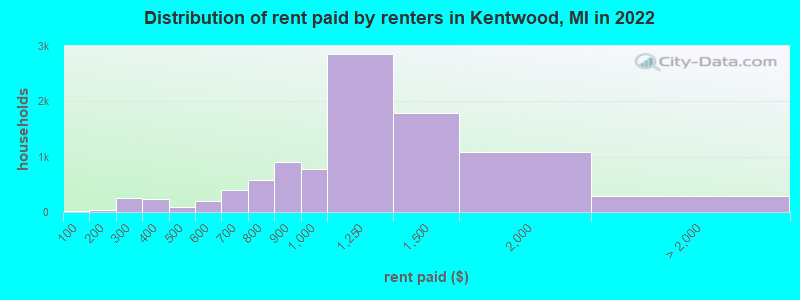
Median contract rent in 2022: $1,118 (lower quartile is $857, upper quartile is $1,357)
Median rent asked for vacant for-rent units in 2022: $1,508
Median gross rent in Kentwood, MI in 2022: $1,208
Housing units in Kentwood with a mortgage: 8,029 (721 second mortgage, 6 home equity loan, 606 both second mortgage and home equity loan )Houses without a mortgage: 197
Median household income for houses/condos with a mortgage: $95,003
Median household income for apartments without a mortgage: $67,460
Median monthly housing costs: $1,146
Data:
Median house or condo value ($)
Median house or condo value ($ change since 2000)
Median house or condo value ($) - White
Median house or condo value ($) - Black or African American
Median house or condo value ($) - Asian
Median house or condo value ($) - Hispanic or Latino
Median house or condo value ($) - American Indian and Alaska Native
Median house or condo value ($) - Multirace
Median house or condo value ($) - Other Race
Median price asked for mobile homes ($)
Household density (households per square mile)
Mean house or condo value by units in structure - 1, detached ($)
Mean house or condo value by units in structure - 1, attached ($)
Mean house or condo value by units in structure - 2 ($)
Mean house or condo value by units in structure by units in structure - 3 or 4 ($)
Mean house or condo value by units in structure - 5 or more ($)
Mean house or condo value by units in structure - Boat, RV, van, etc. ($)
Mean house or condo value by units in structure - Mobile home ($)
Median contract rent ($)
Median contract rent - Lower quartile ($)
Median contract rent - Upper quartile ($)
Median gross rent ($)
Urban houses (%)
Rural houses (%)
Houses occupied (%)
Houses occupied (% change since 2000)
Houses owner occupied (%)
Houses owner occupied (% change since 2000)
Houses renter occupied (%)
Houses renter occupied (% change since 2000)
Vacant housing units - For rent (%)
Vacant housing units - For rent (% change since 2000)
Vacant housing units - For sale only (%)
Vacant housing units - For sale only (% change since 2000)
Vacant housing units - Rented or sold, not occupied (%)
Vacant housing units - Rented or sold, not occupied (% change since 2000)
Vacant housing units - For seasonal, recreational, or occasional use (%)
Vacant housing units - For seasonal, recreational, or occasional use (% change since 2000)
Vacant housing units - For migrant workers (%)
Vacant housing units - For migrant workers (% change since 2000)
Vacant housing units - Other vacant (%)
Vacant housing units - Other vacant (% change since 2000)
Median monthly housing costs ($)
Median household income for houses/condos with a mortgage ($)
Median household income for houses/condos without a mortgage ($)
Median household income ($)
Median household income ($) - White
Median household income ($) - Black or African American
Median household income ($) - Asian
Median household income ($) - Hispanic or Latino
Median household income ($) - American Indian and Alaska Native
Median household income ($) - Multirace
Median household income ($) - Other Race
Mortgage status - with mortgage (%)
Mortgage status - with second mortgage (%)
Mortgage status - with home equity loan (%)
Mortgage status - with both second mortgage and home equity loan (%)
Mortgage status - without a mortgage (%)
Median year house/condo built
Median year apartment built
Household type by relationship - Male householder living alone (%)
Household type by relationship - Male householder not living alone (%)
Household type by relationship - Female householder living alone (%)
Household type by relationship - Female householder not living alone (%)
Household type by relationship - Opposite-Sex spouse (%)
Household type by relationship - Same-Sex spouse (%)
Household type by relationship - Opposite-Sex unmarried partner (%)
Household type by relationship - Same-Sex unmarried partner (%)
Household type by relationship - In group quarters (%)
Size of family households - 2-person household (%)
Size of family households - 3-person household (%)
Size of family households - 4-person household (%)
Size of family households - 5-person household (%)
Size of family households - 6-person household (%)
Size of family households - 7-or-more-person household (%)
Size of nonfamily households - 1-person household (%)
Size of nonfamily households - 2-person household (%)
Size of nonfamily households - 3-person household (%)
Size of nonfamily households - 4-person household (%)
Size of nonfamily households - 5-person household (%)
Size of nonfamily households - 6-person household (%)
Size of nonfamily households - 7-or-moreperson household (%)
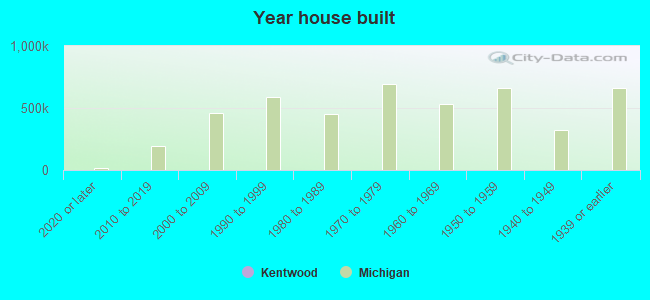
Year house built - Built 2010 or later (%)
Year house built - Built 2000 to 2009 (%)
Year house built - Built 1990 to 1999 (%)
Year house built - Built 1980 to 1989 (%)
Year house built - Built 1970 to 1979 (%)
Year house built - Built 1960 to 1969 (%)
Year house built - Built 1950 to 1959 (%)
Year house built - Built 1940 to 1949 (%)
Year house built - Built 1939 or earlier (%)
Median number of rooms in houses and condos
Median number of rooms in apartments
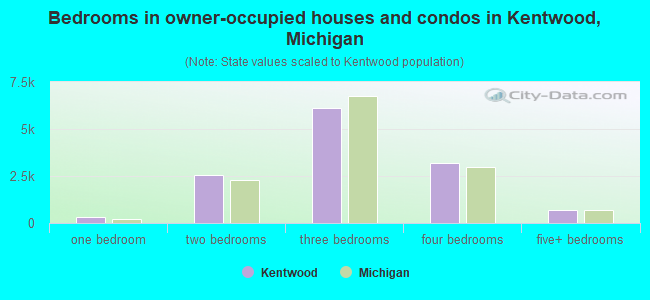
Median number of bedrooms in owner occupied houses
Mean number of bedrooms in owner occupied houses
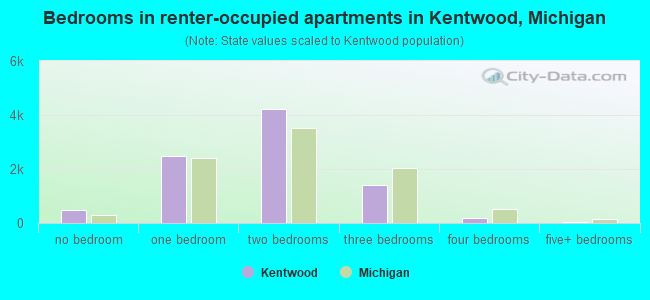
Median number of bedrooms in renter occupied houses
Mean number of bedrooms in renter occupied houses
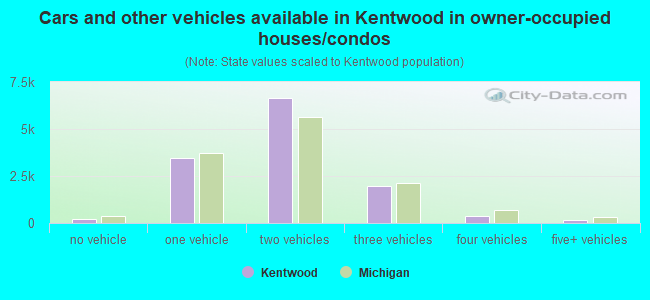
Median number of vehichles in owner occupied houses
Mean number of vehichles in owner occupied houses
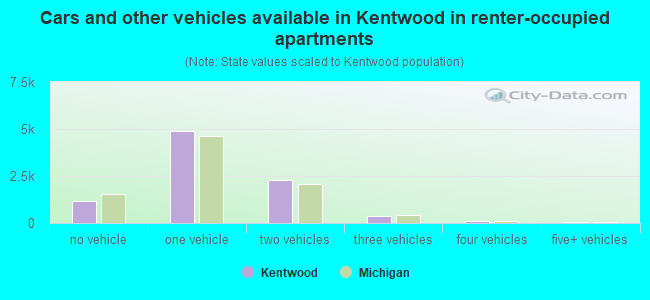
Median number of vehichles in renter occupied houses
Mean number of vehichles in renter occupied houses
Rooms in owner-occupied houses - 1 room (%)
Rooms in owner-occupied houses - 2 rooms (%)
Rooms in owner-occupied houses - 3 rooms (%)
Rooms in owner-occupied houses - 4 rooms (%)
Rooms in owner-occupied houses - 5 rooms (%)
Rooms in owner-occupied houses - 6 rooms (%)
Rooms in owner-occupied houses - 7 rooms (%)
Rooms in owner-occupied houses - 8 rooms (%)
Rooms in owner-occupied houses - 9+ rooms (%)
Rooms in renter-occupied houses - 1 room (%)
Rooms in renter-occupied houses - 2 rooms (%)
Rooms in renter-occupied houses - 3 rooms (%)
Rooms in renter-occupied houses - 4 rooms (%)
Rooms in renter-occupied houses - 5 rooms (%)
Rooms in renter-occupied houses - 6 rooms (%)
Rooms in renter-occupied houses - 7 rooms (%)
Rooms in renter-occupied houses - 8 rooms (%)
Rooms in renter-occupied houses - 9+ rooms (%)
Bedrooms in owner-occupied houses - no bedrooms (%)
Bedrooms in owner-occupied houses - 1 bedroom (%)
Bedrooms in owner-occupied houses - 2 bedrooms (%)
Bedrooms in owner-occupied houses - 3 bedrooms (%)
Bedrooms in owner-occupied houses - 4 bedrooms (%)
Bedrooms in owner-occupied houses - 5+ bedrooms (%)
Bedrooms in renter-occupied houses - no bedrooms (%)
Bedrooms in renter-occupied houses - 1 bedroom (%)
Bedrooms in renter-occupied houses - 2 bedrooms (%)
Bedrooms in renter-occupied houses - 3 bedrooms (%)
Bedrooms in renter-occupied houses - 4 bedrooms (%)
Bedrooms in renter-occupied houses - 5+ bedrooms (%)
Vehicles available in owner-occupied houses - no vehicle available (%)
Vehicles available in owner-occupied houses - 1 vehicle available(%)
Vehicles available in owner-occupied houses - 2 Vehicles available (%)
Vehicles available in owner-occupied houses - 3 Vehicles available (%)
Vehicles available in owner-occupied houses - 4 Vehicles available (%)
Vehicles available in owner-occupied houses - 5+ Vehicles available (%)
Vehicles available in renter-occupied houses - no vehicle available (%)
Vehicles available in renter-occupied houses - 1 vehicle available (%)
Vehicles available in renter-occupied houses - 2 Vehicles available (%)
Vehicles available in renter-occupied houses - 3 Vehicles available (%)
Vehicles available in renter-occupied houses - 4 Vehicles available (%)
Vehicles available in renter-occupied houses - 5+ Vehicles available (%)
Housing units in structures - 1, detached (%)
Housing units in structures - 1, attached (%)
Housing units in structures - 2 (%)
Housing units in structures - 3 or 4 (%)
Housing units in structures - 5 to 9 (%)
Housing units in structures - 10 to 19 (%)
Housing units in structures - 20 to 49 (%)
Housing units in structures - 50 or more (%)
Housing units in structures - Mobile home (%)
Housing units in structures - Boat, RV, van, etc. (%)
Housing units in structures - Owners - 1, detached (%)
Housing units in structures - Owners - 1, attached (%)
Housing units in structures - Owners - 2 (%)
Housing units in structures - Owners - 3 or 4 (%)
Housing units in structures - Owners - 5 to 9 (%)
Housing units in structures - Owners - 10 to 19 (%)
Housing units in structures - Owners - 20 to 49 (%)
Housing units in structures - Owners - 50 or more (%)
Housing units in structures - Owners - Mobile home (%)
Housing units in structures - Owners - Boat, RV, van, etc. (%)
Housing units in structures - Renters - 1, detached (%)
Housing units in structures - Renters - 1, attached (%)
Housing units in structures - Renters - 2 (%)
Housing units in structures - Renters - 3 or 4 (%)
Housing units in structures - Renters - 5 to 9 (%)
Housing units in structures - Renters - 10 to 19 (%)
Housing units in structures - Renters - 20 to 49 (%)
Housing units in structures - Renters - 50 or more (%)
Housing units in structures - Renters - Mobile home (%)
Housing units in structures - Renters - Boat, RV, van, etc. (%)
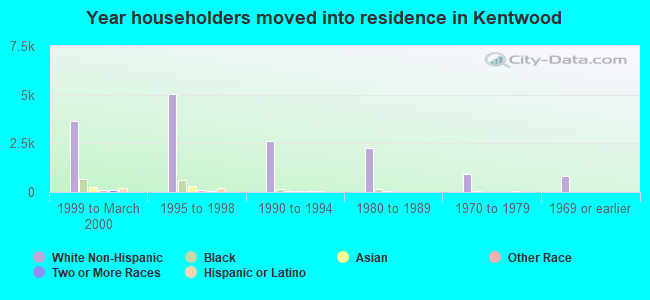
House/condo owner moved in on average (years ago)
Renter moved in on average (years ago)
Year householder moved into unit - Moved in 1999 to March 2000 (%)
Year householder moved into unit - Moved in 1999 to March 2000 (%) - White
Year householder moved into unit - Moved in 1999 to March 2000 (%) - Black or African American
Year householder moved into unit - Moved in 1999 to March 2000 (%) - Asian
Year householder moved into unit - Moved in 1999 to March 2000 (%) - Hispanic or Latino
Year householder moved into unit - Moved in 1999 to March 2000 (%) - American Indian and Alaska Native
Year householder moved into unit - Moved in 1999 to March 2000 (%) - Multirace
Year householder moved into unit - Moved in 1999 to March 2000 (%) - Other Race
Year householder moved into unit - Moved in 1995 to 1998 (%)
Year householder moved into unit - Moved in 1995 to 1998 (%) - White
Year householder moved into unit - Moved in 1995 to 1998 (%) - Black or African American
Year householder moved into unit - Moved in 1995 to 1998 (%) - Asian
Year householder moved into unit - Moved in 1995 to 1998 (%) - Hispanic or Latino
Year householder moved into unit - Moved in 1995 to 1998 (%) - American Indian and Alaska Native
Year householder moved into unit - Moved in 1995 to 1998 (%) - Multirace
Year householder moved into unit - Moved in 1995 to 1998 (%) - Other Race
Year householder moved into unit - Moved in 1990 to 1994 (%)
Year householder moved into unit - Moved in 1990 to 1994 (%) - White
Year householder moved into unit - Moved in 1990 to 1994 (%) - Black or African American
Year householder moved into unit - Moved in 1990 to 1994 (%) - Asian
Year householder moved into unit - Moved in 1990 to 1994 (%) - Hispanic or Latino
Year householder moved into unit - Moved in 1990 to 1994 (%) - American Indian and Alaska Native
Year householder moved into unit - Moved in 1990 to 1994 (%) - Multirace
Year householder moved into unit - Moved in 1990 to 1994 (%) - Other Race
Year householder moved into unit - Moved in 1980 to 1989 (%)
Year householder moved into unit - Moved in 1980 to 1989 (%) - White
Year householder moved into unit - Moved in 1980 to 1989 (%) - Black or African American
Year householder moved into unit - Moved in 1980 to 1989 (%) - Asian
Year householder moved into unit - Moved in 1980 to 1989 (%) - Hispanic or Latino
Year householder moved into unit - Moved in 1980 to 1989 (%) - American Indian and Alaska Native
Year householder moved into unit - Moved in 1980 to 1989 (%) - Multirace
Year householder moved into unit - Moved in 1980 to 1989 (%) - Other Race
Year householder moved into unit - Moved in 1970 to 1979 (%)
Year householder moved into unit - Moved in 1970 to 1979 (%) - White
Year householder moved into unit - Moved in 1970 to 1979 (%) - Black or African American
Year householder moved into unit - Moved in 1970 to 1979 (%) - Asian
Year householder moved into unit - Moved in 1970 to 1979 (%) - Hispanic or Latino
Year householder moved into unit - Moved in 1970 to 1979 (%) - American Indian and Alaska Native
Year householder moved into unit - Moved in 1970 to 1979 (%) - Multirace
Year householder moved into unit - Moved in 1970 to 1979 (%) - Other Race
Year householder moved into unit - Moved in 1969 or earlier (%)
Year householder moved into unit - Moved in 1969 or earlier (%) - White
Year householder moved into unit - Moved in 1969 or earlier (%) - Black or African American
Year householder moved into unit - Moved in 1969 or earlier (%) - Asian
Year householder moved into unit - Moved in 1969 or earlier (%) - Hispanic or Latino
Year householder moved into unit - Moved in 1969 or earlier (%) - American Indian and Alaska Native
Year householder moved into unit - Moved in 1969 or earlier (%) - Multirace
Year householder moved into unit - Moved in 1969 or earlier (%) - Other Race
Housing units lacking complete plumbing facilities (%)
Housing units lacking complete kitchen facilities (%)
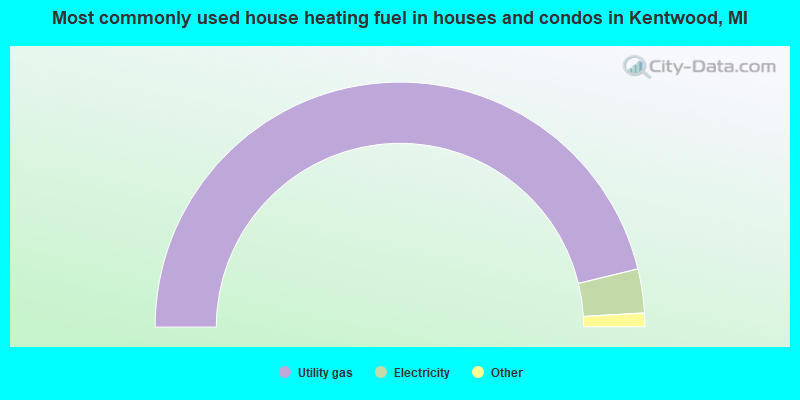
House heating fuel used in houses and condos - Utility gas (%)
House heating fuel used in houses and condos - Bottled, tank, or LP gas (%)
House heating fuel used in houses and condos - Electricity (%)
House heating fuel used in houses and condos - Fuel oil, kerosene, etc. (%)
House heating fuel used in houses and condos - Coal or coke (%)
House heating fuel used in houses and condos - Wood (%)
House heating fuel used in houses and condos - Solar energy (%)
House heating fuel used in houses and condos - Other fuel (%)
House heating fuel used in houses and condos - No fuel used (%)
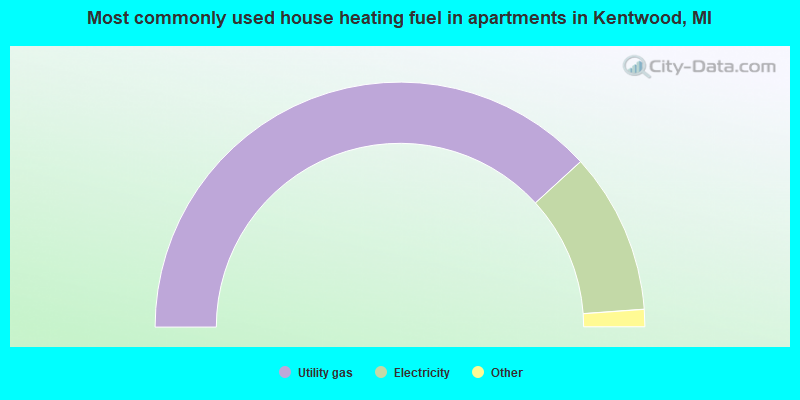
House heating fuel used in apartments - Utility gas (%)
House heating fuel used in apartments - Bottled, tank, or LP gas (%)
House heating fuel used in apartments - Electricity (%)
House heating fuel used in apartments - Fuel oil, kerosene, etc. (%)
House heating fuel used in apartments - Coal or coke (%)
House heating fuel used in apartments - Wood (%)
House heating fuel used in apartments - Solar energy (%)
House heating fuel used in apartments - Other fuel (%)
House heating fuel used in apartments - No fuel used (%)
Latest news about housing in Kentwood, MI collected exclusively by city-data.com from local newspapers, TV, and radio stations
Median year house/condo built: 1984Median year apartment built: 1985Household type by relationship:
Households: 54,186
Male householders: 11,120 (2,896 living alone ), Female householders: 10,416 (3,362 living alone )9,280 spouses (9,255 opposite-sex spouses ), 1,733 unmarried partners , (1,539 opposite-sex unmarried partners ), 16,184 children (15,252 natural , 389 adopted , 542 stepchildren ), 818 grandchildren , 545 brothers or sisters , 761 parents , 51 foster children , 1,091 other relatives , 1,802 non-relatives In group quarters: 380
Size of family households: 5,648 2-persons , 3,278 3-persons , 2,245 4-persons , 891 5-persons , 475 6-persons , 489 7-or-more-persons .
Size of nonfamily households: 6,613 1-person , 2,100 2-persons , 153 3-persons , 29 4-persons , 20 5-persons .
7,848 married couples with children. single-parent households (903 men , 2,801 women ).
76.8% of residents of Kentwood speak English at home. of residents speak Spanish at home (67% speak English very well , 28% speak English well , 5% speak English not well ).of residents speak other Indo-European language at home (44% speak English very well , 21% speak English well , 26% speak English not well , 9% don't speak English at all ).of residents speak Asian or Pacific Island language at home (26% speak English very well , 34% speak English well , 30% speak English not well , 9% don't speak English at all ).of residents speak other language at home (50% speak English very well , 20% speak English well , 27% speak English not well , 2% don't speak English at all ).
Foreign born population: 10,292 (19.0%)of them are naturalized citizens )
Median number of rooms in houses and condos:
Median number of rooms in apartments
Owner-occupied Renter-occupied
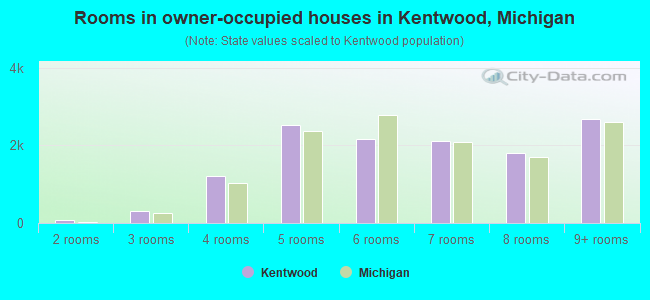
Rooms in owner-occupied houses in Kentwood, Michigan
0 1 room 76 2 rooms 311 3 rooms 1,214 4 rooms 2,536 5 rooms 2,167 6 rooms 2,114 7 rooms 1,818 8 rooms 2,692 9+ rooms
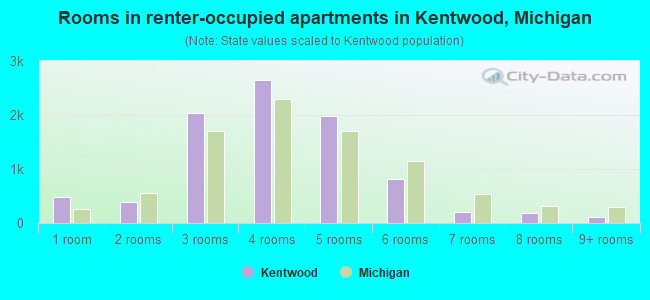
Rooms in renter-occupied apartments in Kentwood, Michigan
474 1 room 397 2 rooms 2,039 3 rooms 2,649 4 rooms 1,989 5 rooms 813 6 rooms 200 7 rooms 183 8 rooms 102 9+ rooms
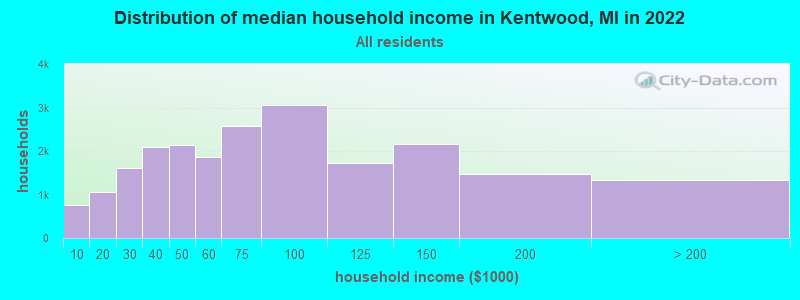
Kentwood, MI household income distribution 765 Less than $10,0001,065 $10,000 to $19,9991,613 $20,000 to $29,9992,098 $30,000 to $39,9992,136 $40,000 to $49,9991,855 $50,000 to $59,9992,569 $60,000 to $74,9993,066 $75,000 to $99,9991,715 $100,000 to $124,9992,150 $125,000 to $149,9991,467 $150,000 to $199,9991,322 $200,000 or more
Home value of owner - occupied houses in 2022 in Kentwood, MI 145 Less than $10,00069 $10,000 to $14,999131 $15,000 to $19,99977 $20,000 to $24,99957 $25,000 to $29,99932 $30,000 to $34,99913 $35,000 to $39,999162 $40,000 to $49,99976 $50,000 to $59,999233 $60,000 to $69,99917 $70,000 to $79,999205 $80,000 to $89,999100 $90,000 to $99,999271 $100,000 to $124,999408 $125,000 to $149,999849 $150,000 to $174,999785 $175,000 to $199,9992,294 $200,000 to $249,9992,443 $250,000 to $299,9992,484 $300,000 to $399,999892 $400,000 to $499,999171 $500,000 to $749,99935 $750,000 to $999,999122 $1,000,000 to $1,499,99923 $2,000,000 or moreRent paid by renters in 2022 in Kentwood, MI 25 Less than $1005 $100 to $14926 $150 to $199100 $200 to $249160 $250 to $299150 $300 to $34981 $350 to $39945 $400 to $44944 $450 to $499130 $500 to $54962 $550 to $599252 $600 to $649152 $650 to $699313 $700 to $749268 $750 to $799904 $800 to $899786 $900 to $9992,857 $1,000 to $1,2491,786 $1,250 to $1,4991,079 $1,500 to $1,99919 $2,000 to $2,49938 $2,500 to $2,999228 No cash rent
Percentage of workers working in this county: 93.9%Number of people working at home: 3,338 (11.7% of all workers )
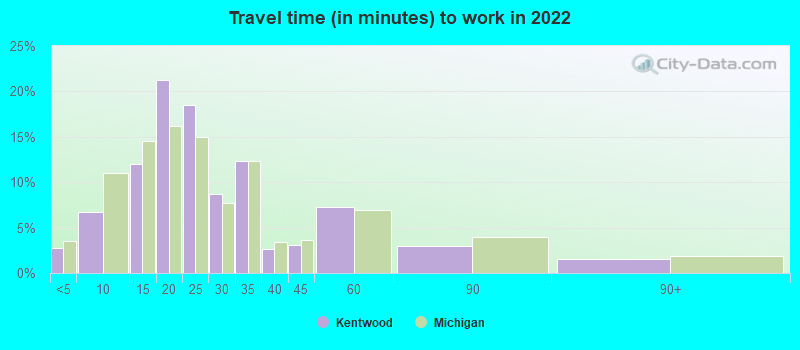
Travel time to work (commute)
Less than 5 minutes: 8455 to 9 minutes: 3,58810 to 14 minutes: 5,37215 to 19 minutes: 5,63020 to 24 minutes: 4,31425 to 29 minutes: 1,81530 to 34 minutes: 1,35835 to 39 minutes: 35840 to 44 minutes: 31545 to 59 minutes: 77860 to 89 minutes: 52690 or more minutes: 157
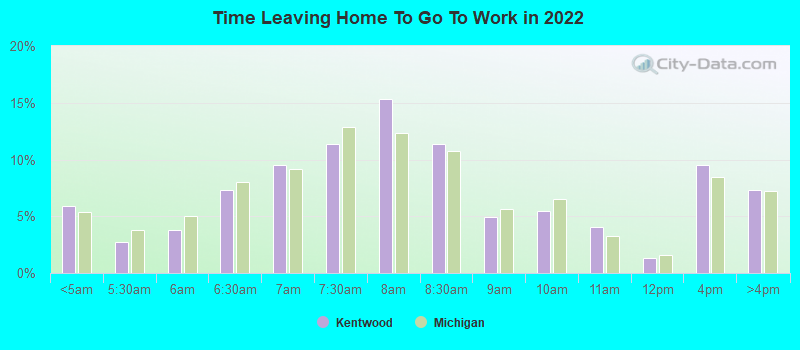
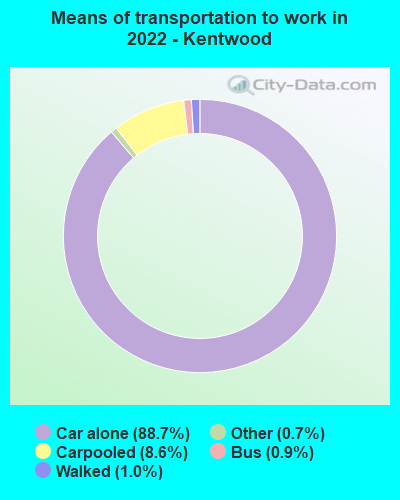
Means of transportation to work:
Drove a car alone: 31,844 (80.2%)Carpooled: 3,186 (8.0%)Bus : 246 (0.6%)Taxi: 368 (0.9%)Bicycle: 4 (0.0%)Walked: 353 (0.9%)Worked at home: 3,338 (8.4%)
Unemployment by race in 2022
Unemployment rate for White non-Hispanic residents 3.1% Males2.1% FemalesUnemployment rate for Black residents 2.1% Males0.7% FemalesUnemployment rate for Asian residents 2.9% Males1.2% FemalesUnemployment rate for other race residents 11.1% MalesUnemployment rate for two or more race residents 9.4% Males9.4% FemalesUnemployment rate for Hispanic or Latino residents 12.2% Males7.5% Females
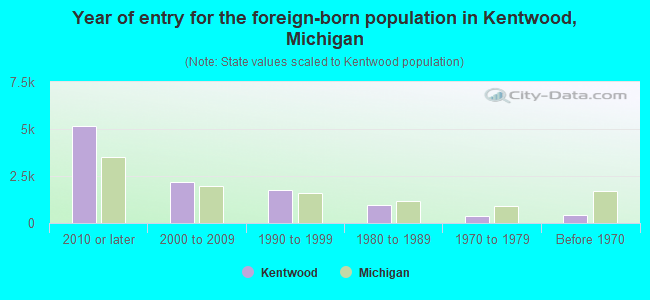
Year of entry for the foreign-born population in Kentwood, Michigan
5,138 2010 or later 2,196 2000 to 2009 1,740 1990 to 1999 935 1980 to 1989 388 1970 to 1979 435 Before 1970
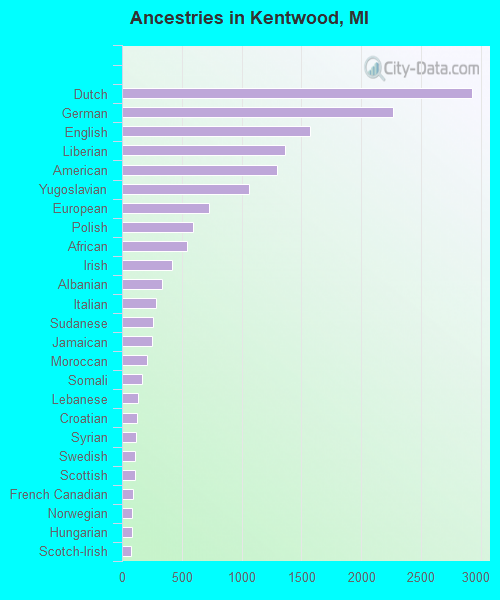
First ancestries reported:
Dutch: 2,924 (10.8%)
German: 2,271 (8.4%)
English: 1,573 (5.8%)
Liberian: 1,360 (5.0%)
American: 1,293 (4.8%)
Yugoslavian: 1,062 (3.9%)
European: 731 (2.7%)
Polish: 598 (2.2%)
African: 546 (2.0%)
Irish: 416 (1.5%)
Albanian: 338 (1.2%)
Italian: 287 (1.1%)
Sudanese: 260 (1.0%)
Jamaican: 248 (0.9%)
Moroccan: 206 (0.8%)
Somali: 166 (0.6%)
Lebanese: 132 (0.5%)
Croatian: 124 (0.5%)
Syrian: 117 (0.4%)
Swedish: 110 (0.4%)
Scottish: 109 (0.4%)
French Canadian: 91 (0.3%)
Norwegian: 83 (0.3%)
Hungarian: 80 (0.3%)
Scotch-Irish: 76 (0.3%)
Ethiopian: 69 (0.3%)
Arab: 66 (0.2%)
Haitian: 65 (0.2%)
Ukrainian: 53 (0.2%)
Palestinian: 51 (0.2%)
Canadian: 50 (0.2%)
Scandinavian: 48 (0.2%)
Danish: 47 (0.2%)
Kenyan: 46 (0.2%)
Latvian: 38 (0.1%)
Eastern European: 37 (0.1%)
Belgian: 31 (0.1%)
French: 30 (0.1%)
Iraqi: 28 (0.1%)
Maltese: 26 (0.10%)
Russian: 25 (0.09%)
Pennsylvania German: 23 (0.08%)
Swiss: 23 (0.08%)
Dutch West Indian: 21 (0.08%)
Lithuanian: 19 (0.07%)
Welsh: 17 (0.06%)
Austrian: 17 (0.06%)
Egyptian: 17 (0.06%)
Northern European: 14 (0.05%)
Brazilian: 14 (0.05%)
Czechoslovakian: 10 (0.04%)
Slovene: 10 (0.04%)
British: 5 (0.02%)
Israeli: 5 (0.02%)
Slavic: 3 (0.01%)
Slovak: 3 (0.01%)
Most common places of birth for foreign-born residents (%): Vietnam Kentwood:
11.6% (1,148)Michigan:
1.8% (12,679)
Bosnia and Herzegovina Kentwood:
9.5% (942)Michigan:
0.9% (6,009)
Burma (Myanmar) Kentwood:
9.0% (894)Michigan:
0.6% (4,087)
Liberia Kentwood:
7.4% (730)Michigan:
0.2% (1,679)
Mexico Kentwood:
6.8% (677)Michigan:
10.9% (75,965)
Bhutan Kentwood:
6.4% (636)Michigan:
0.1% (825)
Congo Kentwood:
5.3% (523)Michigan:
0.1% (963)
India Kentwood:
5.0% (497)Michigan:
11.1% (77,240)
Other Eastern Africa Kentwood:
3.9% (390)Michigan:
0.5% (3,687)
Sudan Kentwood:
2.8% (279)Michigan:
0.3% (1,860)
Germany Kentwood:
2.5% (249)Michigan:
2.3% (16,126)
Philippines Kentwood:
2.1% (207)Michigan:
2.8% (19,112)
Guatemala Kentwood:
1.9% (184)Michigan:
1.0% (7,097)
China, excluding Hong Kong and Taiwan Kentwood:
1.8% (180)Michigan:
4.9% (34,295)
Nepal Kentwood:
1.7% (167)Michigan:
0.4% (2,853)
Korea Kentwood:
1.6% (162)Michigan:
3.0% (20,884)
Albania Kentwood:
1.6% (160)Michigan:
1.9% (12,910)
Tanzania Kentwood:
1.6% (156)Michigan:
0.1% (547)
Cuba Kentwood:
1.5% (153)Michigan:
0.9% (6,481)
Place of birth for U.S.-born residents:
This state: 35,222Other state: 8,254Northeast: 1,156Midwest: 3,252South: 2,336West: 1,516 84.4% of Kentwood residents lived in the same house 1 years ago.
Out of people who lived in different houses, 41.8% lived in this county.
Out of people who lived in different counties, 50.0% lived in Michigan.
Kentwood:
84.4%State average:
88.4%
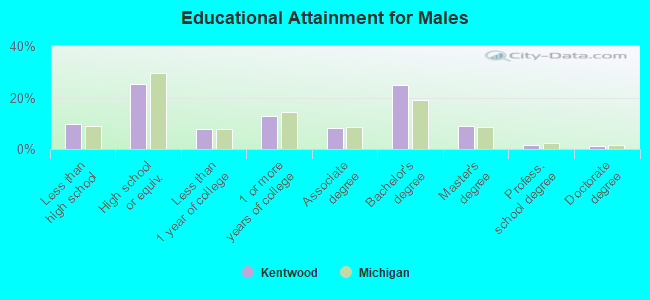
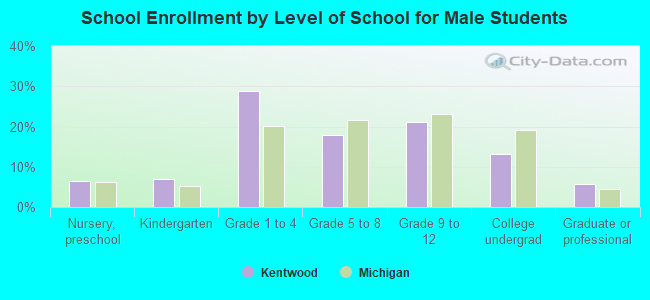
Education attainment for males 25 years and older:
No schooling: 558Nursery to 4th grade: 545th and 6th grade: 1037th and 8th grade: 359th grade: 3710th grade: 18511th grade: 25812th grade, no diploma: 471High school graduate (or equivalency): 4,521Less than 1 year of college: 1,361Some college more than 1 year, no degree: 2,299Associate degree: 1,458Bachelor's degree: 4,453Master's degree: 1,565Professional school degree: 279Doctorate degree: 226
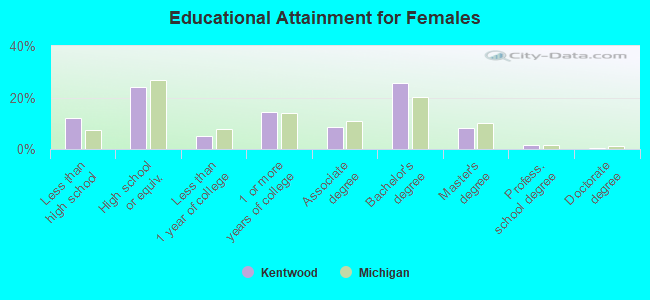
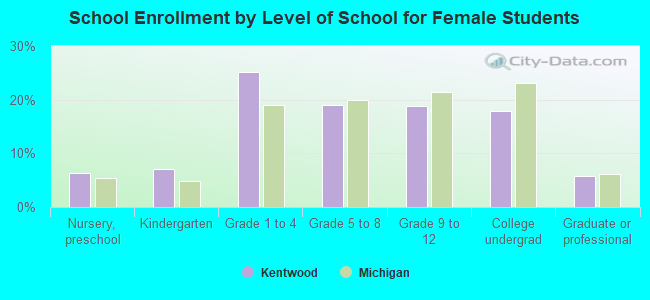
Education attainment for females 25 years and older:
No schooling: 1,194Nursery to 4th grade: 535th and 6th grade: 1527th and 8th grade: 1329th grade: 7210th grade: 12511th grade: 8012th grade, no diploma: 465High school graduate (or equivalency): 4,530Less than 1 year of college: 961Some college more than 1 year, no degree: 2,735Associate degree: 1,651Bachelor's degree: 4,834Master's degree: 1,517Professional school degree: 320Doctorate degree: 90
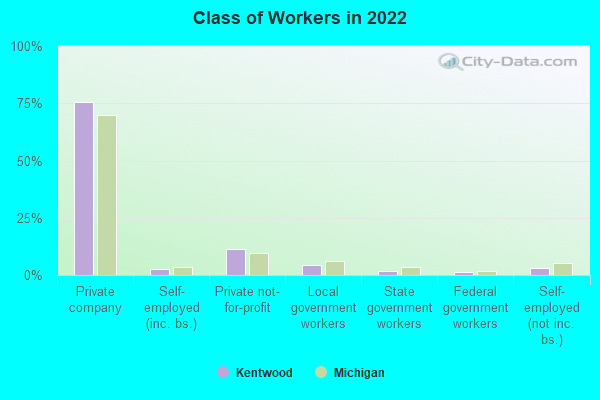
Housing units in structures:
One, detached: 11,091One, attached: 2,621Two: 6383 or 4: 5615 to 9: 1,58110 to 19: 3,35120 to 49: 83550 or more: 1,058Mobile homes: 705Median worth of mobile homes: $24,843
Housing units lacking complete plumbing facilities in 2022: 0.3%Housing units lacking complete kitchen facilities in 2022: 0.7%House/condo owner moved in on average 9 years ago
Renter moved in on average 3 years ago
Private vs. public school enrollment:
Students in private schools in grades 1 to 8 (elementary and middle school): 574 Students in private schools in grades 9 to 12 (high school): 253 Students in private undergraduate colleges: 621