Hudson, MA (Massachusetts) Houses and Residents
| Hudson: | $463,490 |
| Massachusetts: | $534,700 |
Mean price in 2022:
Detached houses: $492,737
Here: $492,737 State: $651,570 Townhouses or other attached units: $499,132
Here: $499,132 State: $617,749 In 2-unit structures: $415,170
Here: $415,170 State: $594,808 In 3-to-4-unit structures: $281,389
Here: $281,389 State: $601,912 In 5-or-more-unit structures: $310,163
Here: $310,163 State: $555,768 Mobile homes: $56,718
Here: $56,718 State: $170,209
Total population: 14,907 (Urban population: 14,375, Rural population: 0)
Houses: 7,059 (6,627 occupied: 4,475 owner occupied, 2,146 renter occupied)
| % of renters here: | 32% |
| State: | 38% |
Housing density: 1,235 houses/condos per square mile
Median price asked for vacant for-sale houses and condos in 2022 in this county: $1,068,910.
Median contract rent in 2022: $1,292 (lower quartile is $1,033, upper quartile is $1,847)
Median rent asked for vacant for-rent units in 2022: $1,847
Median gross rent in Hudson, MA in 2022: $1,478
Housing units in Hudson with a mortgage: 2,511 (354 second mortgage, 5 home equity loan, 317 both second mortgage and home equity loan)
Houses without a mortgage: 56
Median household income for houses/condos with a mortgage: $134,610
Median household income for apartments without a mortgage: $78,215
Median monthly housing costs: $1,500
Compare current foreclosures near Hudson, MA:
| Photo | Address | Area | Beds / Baths | Price | Details |
|---|---|---|---|---|---|

|
#1
Old Bolton Rd
Hudson, MA 01749
|
1,244 sq. feet
|
1 baths 3 beds |
show details | |

|
#2
Johnson Ave
Hudson, MA 01749
|
1,236 sq. feet
|
1 baths 3 beds |
show details | |

|
#3
Manning St Apt 27c
Hudson, MA 01749
|
957 sq. feet
|
1 baths 2 beds |
show details | |

|
#4
Ontario Dr
Hudson, MA 01749
|
1,179 sq. feet
|
1 baths 3 beds |
show details | |

|
#5
Main St
Hudson, MA 01749
|
1,074 sq. feet
|
2 baths 3 beds |
show details | |

|
#6
Priest St
Hudson, MA 01749
|
3,197 sq. feet
|
2 baths 6 beds |
show details | |

|
#7
Brigham St Unit 1a
Hudson, MA 01749
|
1,140 sq. feet
|
2 baths 2 beds |
show details | |

|
#8
Kent Dr
Hudson, MA 01749
|
1,284 sq. feet
|
1 baths 3 beds |
show details | |

|
#9
Howe St
Hudson, MA 01749
|
1,450 sq. feet
|
1 baths 3 beds |
show details | |

|
#10
Dewey St
Hudson, MA 01749
|
1,704 sq. feet
|
1 baths 3 beds |
show details |
| Photo | Address | Area | Beds / Baths | Price | Details |
|---|---|---|---|---|---|

|
#11
Alberta Dr
Hudson, MA 01749
|
2,845 sq. feet
|
2 baths 3 beds |
show details | |

|
#12
River St Apt 4
Hudson, MA 01749
|
- sq. feet
|
- baths - beds |
show details | |

|
#13
Main St
Hudson, MA 01749
|
- sq. feet
|
- baths - beds |
show details | |

|
#14
Glen Rd Apt 121
Hudson, MA 01749
|
- sq. feet
|
- baths - beds |
show details | |

|
#15
Stillman St
Framingham, MA 01702
|
1,122 sq. feet
|
1 baths 2 beds |
$290,000
|
show details |

|
#16
Sylvan Ave
Leominster, MA 01453
|
720 sq. feet
|
1 baths 2 beds |
$365,000
|
show details |

|
#17
Main St
Hudson, MA 01749
|
- sq. feet
|
- baths - beds |
show details | |

|
#18
Abigail Dr
Hudson, MA 01749
|
- sq. feet
|
- baths - beds |
show details | |

|
#19
Northridge St
Worcester, MA 01603
|
3,085 sq. feet
|
3 baths 5 beds |
show details | |

|
#20
Stoneland Rd
Worcester, MA 01603
|
3,197 sq. feet
|
3 baths 5 beds |
show details |
| Photo | Address | Area | Beds / Baths | Price | Details |
|---|---|---|---|---|---|

|
#21
Grv St
Needham, MA 02492
|
6,542 sq. feet
|
4 baths 6 beds |
show details | |

|
#22
Western Ave
Natick, MA 01760
|
1,508 sq. feet
|
2 baths 3 beds |
show details | |

|
#23
Olde Coach Rd
Westborough, MA 01581
|
2,740 sq. feet
|
3 baths 4 beds |
show details | |

|
#24
Chestnut Ln
Carlisle, MA 01741
|
5,031 sq. feet
|
5 baths 5 beds |
show details | |

|
#25
S Great Rd
Lincoln, MA 01773
|
3,765 sq. feet
|
3 baths 4 beds |
show details | |

|
#26
Deer Path Apt 5
Maynard, MA 01754
|
1,540 sq. feet
|
1 baths 2 beds |
show details | |

|
#27
Helen Dr
West Boylston, MA 01583
|
1,536 sq. feet
|
1 baths 3 beds |
show details | |

|
#28
Greenwich Ave
Leominster, MA 01453
|
966 sq. feet
|
1 baths 2 beds |
show details | |

|
#29
Barnard Rd
Worcester, MA 01605
|
1,320 sq. feet
|
2 baths 3 beds |
show details | |

|
#30
Cedar St
Westborough, MA 01581
|
1,342 sq. feet
|
1 baths 3 beds |
show details |
| Photo | Address | Area | Beds / Baths | Price | Details |
|---|---|---|---|---|---|

|
#31
Lincoln St
Leominster, MA 01453
|
1,600 sq. feet
|
2 baths 3 beds |
show details | |

|
#32
Hancock St
Bedford, MA 01730
|
2,083 sq. feet
|
2 baths 4 beds |
show details | |

|
#33
Goodrich St
Lunenburg, MA 01462
|
2,976 sq. feet
|
4 baths 6 beds |
show details | |

|
#34
Linda Ave
Framingham, MA 01701
|
1,670 sq. feet
|
3 baths 4 beds |
show details | |

|
#35
Reo Rd
Maynard, MA 01754
|
987 sq. feet
|
1 baths 3 beds |
show details | |

|
#36
Lake Ave
Worcester, MA 01604
|
3,265 sq. feet
|
2 baths 3 beds |
show details | |

|
#37
Liberty St
Clinton, MA 01510
|
1,632 sq. feet
|
3 baths 3 beds |
show details | |

|
#38
Grove St
Clinton, MA 01510
|
940 sq. feet
|
1 baths 3 beds |
show details | |

|
#39
Main St
Concord, MA 01742
|
1,906 sq. feet
|
2 baths 3 beds |
show details | |

|
#40
Chestnut St
Leominster, MA 01453
|
2,430 sq. feet
|
2 baths 5 beds |
show details |
| Photo | Address | Area | Beds / Baths | Price | Details |
|---|---|---|---|---|---|

|
#41
Grove Ave
Leominster, MA 01453
|
3,097 sq. feet
|
1 baths 4 beds |
show details | |

|
#42
Parkerville Rd
Southborough, MA 01772
|
2,060 sq. feet
|
3 baths 4 beds |
show details | |

|
#43
Hartwell Ave
Littleton, MA 01460
|
1,644 sq. feet
|
2 baths 4 beds |
show details | |

|
#44
Enid St
Worcester, MA 01604
|
1,088 sq. feet
|
2 baths 2 beds |
show details | |

|
#45
Surro Dr
Framingham, MA 01701
|
2,912 sq. feet
|
4 baths 4 beds |
show details | |

|
#46
Vaillencourt Dr
Framingham, MA 01701
|
2,318 sq. feet
|
4 baths 4 beds |
show details | |

|
#47
Hadley Rd
Sudbury, MA 01776
|
1,360 sq. feet
|
3 baths 3 beds |
show details | |

|
#48
Fiske St
Holliston, MA 01746
|
1,182 sq. feet
|
2 baths 4 beds |
show details | |

|
#49
Grafton St
Worcester, MA 01604
|
1,668 sq. feet
|
3 baths 3 beds |
show details | |

|
Check over 1 million property listings on Foreclosure.com!
|
browse all offers | |||

Latest news about housing in Hudson, MA collected exclusively by city-data.com from local newspapers, TV, and radio stations

 | How Much Massachusetts Households Make Per Year: Census Data (37 replies) |
| 2023 Real Estate Observations (5278 replies) |
| People are leaving Massachusetts in droves. Who are they? (334 replies) |
| Is waiting for home prices to come down pointless? (148 replies) |
| towns that offer the most jobs per dollar of house (58 replies) |
| Looking for a condo for my mother (11 replies) |

Median year apartment built: 1968
Household type by relationship:
Households: 15,438- Male householders: 3,195 (636 living alone), Female householders: 3,314 (1,284 living alone)
3,147 spouses (3,120 opposite-sex spouses), 700 unmarried partners, (651 opposite-sex unmarried partners), 4,096 children (3,920 natural, 94 adopted, 81 stepchildren), 160 grandchildren, 9 brothers or sisters, 352 parents, 0 foster children, 136 other relatives, 270 non-relatives
- In group quarters: 53
Size of family households: 1,718 2-persons, 968 3-persons, 727 4-persons, 401 5-persons, 55 6-persons, 39 7-or-more-persons.
Size of nonfamily households: 2,002 1-person, 678 2-persons, 38 3-persons, 11 4-persons.
2,273 married couples with children.
386 single-parent households (101 men, 285 women).
73.9% of residents of Hudson speak English at home.
5.5% of residents speak Spanish at home (43% speak English very well, 18% speak English well, 24% speak English not well, 15% don't speak English at all).
16.2% of residents speak other Indo-European language at home (58% speak English very well, 21% speak English well, 12% speak English not well, 9% don't speak English at all).
2.6% of residents speak Asian or Pacific Island language at home (49% speak English very well, 27% speak English well, 25% speak English not well).
2.1% of residents speak other language at home (67% speak English very well, 33% speak English well).
Foreign born population: 3,048 (19.7%)
(54.6% of them are naturalized citizens)
| Here: | 6.6 |
| State: | 6.5 |
| Here: | 4.1 |
| State: | 4.0 |

- Bedrooms in owner-occupied houses and condos in Hudson, Massachusetts
- 0no bedroom
- 901 bedroom
- 1,2552 bedrooms
- 2,0333 bedrooms
- 9114 bedrooms
- 1865+ bedrooms

- Bedrooms in renter-occupied apartments in Hudson, Massachusetts
- 53no bedroom
- 8461 bedroom
- 7212 bedrooms
- 4253 bedrooms
- 884 bedrooms
- 145+ bedrooms

- Cars and other vehicles available in Hudson in owner-occupied houses/condos
- 134no vehicle
- 1,1331 vehicle
- 2,2262 vehicles
- 5883 vehicles
- 2424 vehicles
- 1525+ vehicles

- Cars and other vehicles available in Hudson in renter-occupied apartments
- 165no vehicle
- 1,0111 vehicle
- 8122 vehicles
- 1263 vehicles
- 04 vehicles
- 325+ vehicles

- Rooms in owner-occupied houses in Hudson, Massachusetts
- 01 room
- 162 rooms
- 573 rooms
- 5504 rooms
- 7055 rooms
- 7696 rooms
- 9987 rooms
- 7648 rooms
- 6159+ rooms

- Rooms in renter-occupied apartments in Hudson, Massachusetts
- 241 room
- 2752 rooms
- 5013 rooms
- 4604 rooms
- 3705 rooms
- 2316 rooms
- 1267 rooms
- 828 rooms
- 789+ rooms


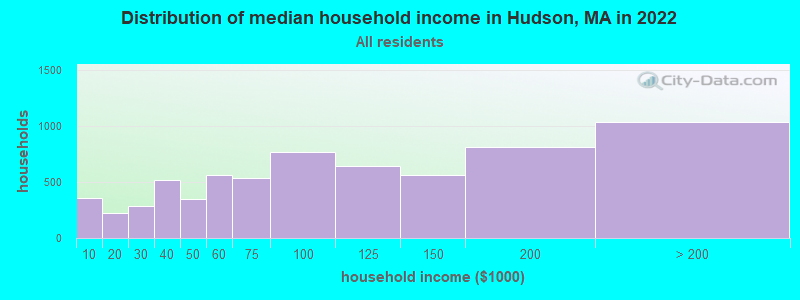
Hudson, MA household income distribution

- 358Less than $10,000
- 223$10,000 to $19,999
- 286$20,000 to $29,999
- 517$30,000 to $39,999
- 352$40,000 to $49,999
- 567$50,000 to $59,999
- 539$60,000 to $74,999
- 766$75,000 to $99,999
- 646$100,000 to $124,999
- 563$125,000 to $149,999
- 814$150,000 to $199,999
- 1,037$200,000 or more
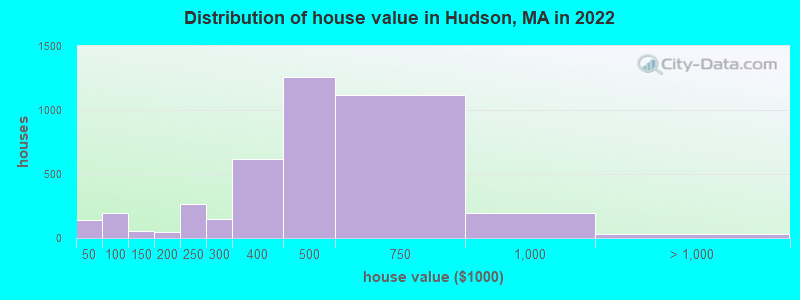
Home value of owner - occupied houses in 2022 in Hudson, MA
-
- 42Less than $10,000
- 40$10,000 to $14,999
- 46$20,000 to $24,999
- 9$40,000 to $49,999
- 105$60,000 to $69,999
- 33$80,000 to $89,999
- 48$90,000 to $99,999
- 48$100,000 to $124,999
- 8$125,000 to $149,999
- 38$150,000 to $174,999
- 9$175,000 to $199,999
- 266$200,000 to $249,999
- 145$250,000 to $299,999
- 616$300,000 to $399,999
- 1,256$400,000 to $499,999
- 1,118$500,000 to $749,999
- 193$750,000 to $999,999
- 19$1,000,000 to $1,499,999
- 12$2,000,000 or more
Rent paid by renters in 2022 in Hudson, MA
-
- 53$200 to $249
- 57$250 to $299
- 21$300 to $349
- 53$350 to $399
- 74$400 to $449
- 18$500 to $549
- 4$550 to $599
- 9$650 to $699
- 142$800 to $899
- 65$900 to $999
- 526$1,000 to $1,249
- 229$1,250 to $1,499
- 476$1,500 to $1,999
- 379$2,000 to $2,499
- 29$3,000 to $3,499
- 54No cash rent


Percentage of workers working in this county: 78.1%
Number of people working at home: 1,626 (20.5% of all workers)
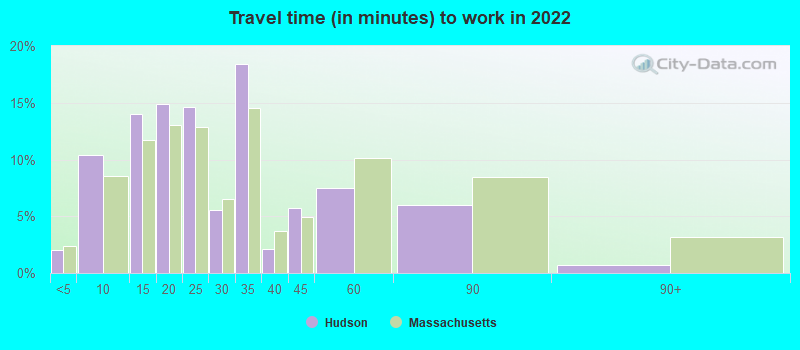
Travel time to work (commute)
- Less than 5 minutes: 173
- 5 to 9 minutes: 818
- 10 to 14 minutes: 767
- 15 to 19 minutes: 790
- 20 to 24 minutes: 702
- 25 to 29 minutes: 398
- 30 to 34 minutes: 875
- 35 to 39 minutes: 365
- 40 to 44 minutes: 176
- 45 to 59 minutes: 713
- 60 to 89 minutes: 323
- 90 or more minutes: 117
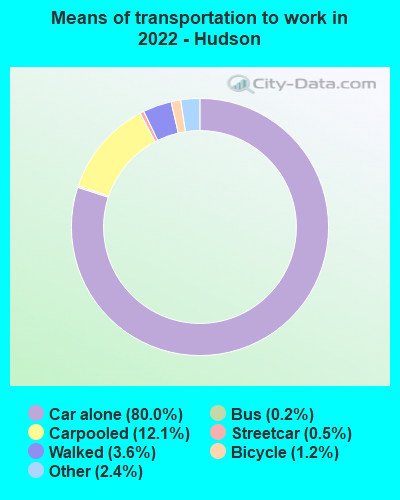
Means of transportation to work:
- Drove a car alone: 5,823 (64.1%)
- Carpooled: 922 (10.1%)
- Bus: 9 (0.1%)
- Subway or elevated rail: 36 (0.4%)
- Taxi: 223 (2.5%)
- Bicycle: 112 (1.2%)
- Walked: 275 (3.0%)
- Worked at home: 1,626 (17.9%)

- Unemployment by race in 2022
- Unemployment rate for White non-Hispanic residents
- 2.3%Males
- 4.1%Females
- Unemployment rate for Black residents
- 39.8%Females
- Unemployment rate for other race residents
- 4.3%Females
- Unemployment rate for two or more race residents
- 3.6%Males

- Year of entry for the foreign-born population in Hudson, Massachusetts
- 8422010 or later
- 6592000 to 2009
- 6691990 to 1999
- 3481980 to 1989
- 6931970 to 1979
- 570Before 1970
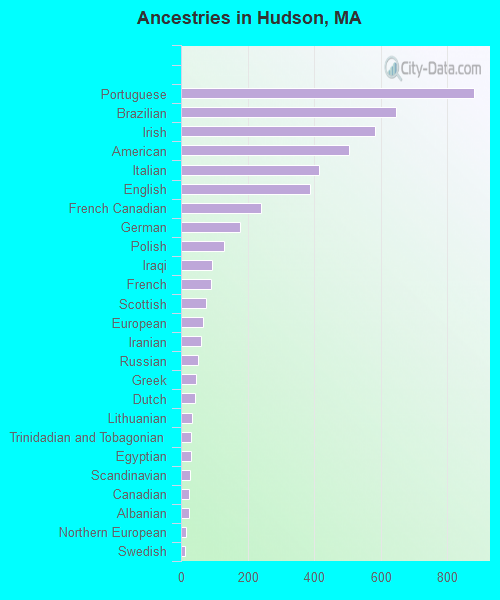
First ancestries reported:
- Portuguese: 882 (12.5%)
- Brazilian: 645 (9.2%)
- Irish: 584 (8.3%)
- American: 506 (7.2%)
- Italian: 414 (5.9%)
- English: 388 (5.5%)
- French Canadian: 241 (3.4%)
- German: 176 (2.5%)
- Polish: 128 (1.8%)
- Iraqi: 94 (1.3%)
- French: 91 (1.3%)
- Scottish: 74 (1.1%)
- European: 66 (0.9%)
- Iranian: 61 (0.9%)
- Russian: 52 (0.7%)
- Greek: 45 (0.6%)
- Dutch: 41 (0.6%)
- Lithuanian: 32 (0.5%)
- Trinidadian and Tobagonian: 31 (0.4%)
- Egyptian: 29 (0.4%)
- Scandinavian: 28 (0.4%)
- Canadian: 25 (0.4%)
- Albanian: 24 (0.3%)
- Northern European: 15 (0.2%)
- Swedish: 11 (0.2%)
- Bahamian: 11 (0.2%)
- Norwegian: 8 (0.1%)
- Scotch-Irish: 6 (0.09%)
- British: 3 (0.04%)
- Haitian: 3 (0.04%)
Most common places of birth for foreign-born residents (%):
| Hudson: | 26.3% (801) |
| Massachusetts: | 7.6% (92,959) |
| Hudson: | 15.9% (486) |
| Massachusetts: | 4.1% (50,360) |
| Hudson: | 12.6% (384) |
| Massachusetts: | 0.4% (4,735) |
| Hudson: | 6.3% (193) |
| Massachusetts: | 0.6% (7,349) |
| Hudson: | 5.1% (155) |
| Massachusetts: | 0.1% (1,720) |
| Hudson: | 4.4% (134) |
| Massachusetts: | 2.7% (32,733) |
| Hudson: | 4.3% (132) |
| Massachusetts: | 2.3% (28,158) |
| Hudson: | 3.4% (104) |
| Massachusetts: | 0.9% (10,768) |
| Hudson: | 2.5% (76) |
| Massachusetts: | 8.4% (103,233) |
| Hudson: | 2.3% (70) |
| Massachusetts: | 0.9% (10,810) |
| Hudson: | 2.1% (63) |
| Massachusetts: | 0.6% (7,213) |
| Hudson: | 2.0% (62) |
| Massachusetts: | 0.6% (7,364) |
| Hudson: | 1.9% (59) |
| Massachusetts: | 3.7% (45,667) |
Place of birth for U.S.-born residents:
- This state: 8,993
- Other state: 3,189
- Northeast: 1,714
- Midwest: 332
- South: 710
- West: 450
92.1% of Hudson residents lived in the same house 1 years ago.
Out of people who lived in different houses, 34.5% lived in this county.
Out of people who lived in different counties, 81.5% lived in Massachusetts.
| Hudson: | 92.1% |
| State average: | 87.7% |
Education attainment for males 25 years and older:
- No schooling: 121
- Nursery to 4th grade: 34
- 5th and 6th grade: 0
- 7th and 8th grade: 6
- 9th grade: 73
- 10th grade: 6
- 11th grade: 25
- 12th grade, no diploma: 279
- High school graduate (or equivalency): 1,326
- Less than 1 year of college: 309
- Some college more than 1 year, no degree: 619
- Associate degree: 312
- Bachelor's degree: 1,412
- Master's degree: 458
- Professional school degree: 207
- Doctorate degree: 212

Education attainment for females 25 years and older:
- No schooling: 281
- Nursery to 4th grade: 16
- 5th and 6th grade: 39
- 7th and 8th grade: 103
- 9th grade: 9
- 10th grade: 223
- 11th grade: 14
- 12th grade, no diploma: 216
- High school graduate (or equivalency): 1,134
- Less than 1 year of college: 513
- Some college more than 1 year, no degree: 428
- Associate degree: 467
- Bachelor's degree: 1,716
- Master's degree: 823
- Professional school degree: 96
- Doctorate degree: 60


Housing units in structures:
- One, detached: 3,514
- One, attached: 415
- Two: 509
- 3 or 4: 737
- 5 to 9: 248
- 10 to 19: 451
- 20 to 49: 390
- 50 or more: 543
- Mobile homes: 248
Median worth of mobile homes: $111,456
House/condo owner moved in on average 13 years ago
Renter moved in on average 4 years ago

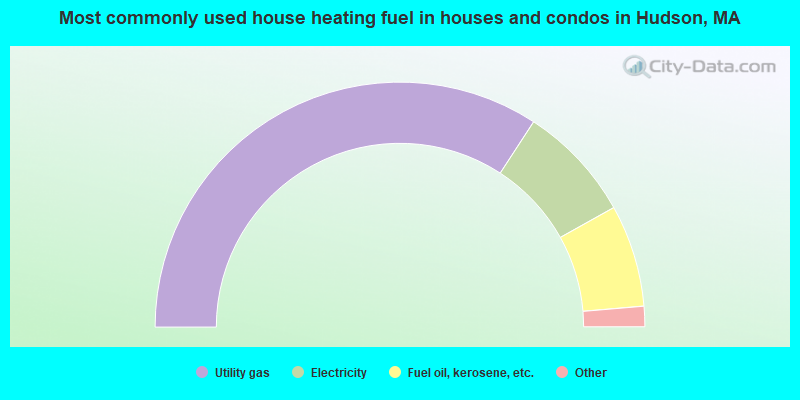
- 68.4%Utility gas
- 15.4%Electricity
- 13.5%Fuel oil, kerosene, etc.
- 1.4%Bottled, tank, or LP gas
- 0.7%Wood
- 0.6%Other fuel
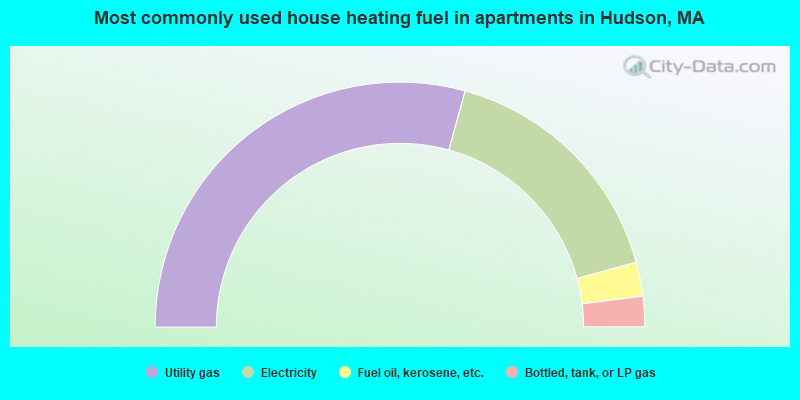
- 58.6%Utility gas
- 32.9%Electricity
- 4.5%Fuel oil, kerosene, etc.
- 4.0%Bottled, tank, or LP gas
Private vs. public school enrollment:
| Here: | 0.5% |
| Massachusetts: | 10.3% |
| Here: | 17.3% |
| Massachusetts: | 12.3% |
| Here: | 29.3% |
| Massachusetts: | 51.2% |


