Golden Valley, AZ (Arizona) Houses and Residents
Estimated median house or condo value in 2022: $131,152 (it was $61,200 in 2000 )
Golden Valley:
$131,152Arizona:
$402,800
Lower value quartile - upper value quartile: $86,769 - $246,837Mean price in 2022: Detached houses: $239,908 Here:
$239,908State:
$521,408
Mobile homes: $112,340 Here:
$112,340State:
$141,516
Occupied boats, RVs, vans, etc.: $28,084 Here:
$28,084State:
$60,504
Total population: 8,370 (Urban population: 0, Rural population: 4,587 (70 farm, 4,517 nonfarm ))
Houses: 4,600 (3,951 occupied: 3,744 owner occupied, 292 renter occupied )
% of renters here:
7%State:
33%
Housing density: 164 houses/condos per square mile
Median price asked for vacant for-sale houses and condos in 2022: $195,576.
Median contract rent in 2022: $811
Median rent asked for vacant for-rent units in 2022: $797
Median gross rent in Golden Valley, AZ in 2022: $1,067
Housing units in Golden Valley with a mortgage: 1,924 (97 second mortgage, 0 home equity loan, 87 both second mortgage and home equity loan )Houses without a mortgage: 0
Median household income for houses/condos with a mortgage: $62,291
Median household income for apartments without a mortgage: $39,294
Median monthly housing costs: $644
Data:
Median house or condo value ($)
Median house or condo value ($ change since 2000)
Median house or condo value ($) - White
Median house or condo value ($) - Black or African American
Median house or condo value ($) - Asian
Median house or condo value ($) - Hispanic or Latino
Median house or condo value ($) - American Indian and Alaska Native
Median house or condo value ($) - Multirace
Median house or condo value ($) - Other Race
Median price asked for mobile homes ($)
Household density (households per square mile)
Mean house or condo value by units in structure - 1, detached ($)
Mean house or condo value by units in structure - 1, attached ($)
Mean house or condo value by units in structure - 2 ($)
Mean house or condo value by units in structure by units in structure - 3 or 4 ($)
Mean house or condo value by units in structure - 5 or more ($)
Mean house or condo value by units in structure - Boat, RV, van, etc. ($)
Mean house or condo value by units in structure - Mobile home ($)
Median contract rent ($)
Median contract rent - Lower quartile ($)
Median contract rent - Upper quartile ($)
Median gross rent ($)
Urban houses (%)
Rural houses (%)
Houses occupied (%)
Houses occupied (% change since 2000)
Houses owner occupied (%)
Houses owner occupied (% change since 2000)
Houses renter occupied (%)
Houses renter occupied (% change since 2000)
Vacant housing units - For rent (%)
Vacant housing units - For rent (% change since 2000)
Vacant housing units - For sale only (%)
Vacant housing units - For sale only (% change since 2000)
Vacant housing units - Rented or sold, not occupied (%)
Vacant housing units - Rented or sold, not occupied (% change since 2000)
Vacant housing units - For seasonal, recreational, or occasional use (%)
Vacant housing units - For seasonal, recreational, or occasional use (% change since 2000)
Vacant housing units - For migrant workers (%)
Vacant housing units - For migrant workers (% change since 2000)
Vacant housing units - Other vacant (%)
Vacant housing units - Other vacant (% change since 2000)
Median monthly housing costs ($)
Median household income for houses/condos with a mortgage ($)
Median household income for houses/condos without a mortgage ($)
Median household income ($)
Median household income ($) - White
Median household income ($) - Black or African American
Median household income ($) - Asian
Median household income ($) - Hispanic or Latino
Median household income ($) - American Indian and Alaska Native
Median household income ($) - Multirace
Median household income ($) - Other Race
Mortgage status - with mortgage (%)
Mortgage status - with second mortgage (%)
Mortgage status - with home equity loan (%)
Mortgage status - with both second mortgage and home equity loan (%)
Mortgage status - without a mortgage (%)
Median year house/condo built
Median year apartment built
Household type by relationship - Male householder living alone (%)
Household type by relationship - Male householder not living alone (%)
Household type by relationship - Female householder living alone (%)
Household type by relationship - Female householder not living alone (%)
Household type by relationship - Opposite-Sex spouse (%)
Household type by relationship - Same-Sex spouse (%)
Household type by relationship - Opposite-Sex unmarried partner (%)
Household type by relationship - Same-Sex unmarried partner (%)
Household type by relationship - In group quarters (%)
Size of family households - 2-person household (%)
Size of family households - 3-person household (%)
Size of family households - 4-person household (%)
Size of family households - 5-person household (%)
Size of family households - 6-person household (%)
Size of family households - 7-or-more-person household (%)
Size of nonfamily households - 1-person household (%)
Size of nonfamily households - 2-person household (%)
Size of nonfamily households - 3-person household (%)
Size of nonfamily households - 4-person household (%)
Size of nonfamily households - 5-person household (%)
Size of nonfamily households - 6-person household (%)
Size of nonfamily households - 7-or-moreperson household (%)
Year house built - Built 2010 or later (%)
Year house built - Built 2000 to 2009 (%)
Year house built - Built 1990 to 1999 (%)
Year house built - Built 1980 to 1989 (%)
Year house built - Built 1970 to 1979 (%)
Year house built - Built 1960 to 1969 (%)
Year house built - Built 1950 to 1959 (%)
Year house built - Built 1940 to 1949 (%)
Year house built - Built 1939 or earlier (%)
Median number of rooms in houses and condos
Median number of rooms in apartments
Median number of bedrooms in owner occupied houses
Mean number of bedrooms in owner occupied houses
Median number of bedrooms in renter occupied houses
Mean number of bedrooms in renter occupied houses
Median number of vehichles in owner occupied houses
Mean number of vehichles in owner occupied houses
Median number of vehichles in renter occupied houses
Mean number of vehichles in renter occupied houses
Rooms in owner-occupied houses - 1 room (%)
Rooms in owner-occupied houses - 2 rooms (%)
Rooms in owner-occupied houses - 3 rooms (%)
Rooms in owner-occupied houses - 4 rooms (%)
Rooms in owner-occupied houses - 5 rooms (%)
Rooms in owner-occupied houses - 6 rooms (%)
Rooms in owner-occupied houses - 7 rooms (%)
Rooms in owner-occupied houses - 8 rooms (%)
Rooms in owner-occupied houses - 9+ rooms (%)
Rooms in renter-occupied houses - 1 room (%)
Rooms in renter-occupied houses - 2 rooms (%)
Rooms in renter-occupied houses - 3 rooms (%)
Rooms in renter-occupied houses - 4 rooms (%)
Rooms in renter-occupied houses - 5 rooms (%)
Rooms in renter-occupied houses - 6 rooms (%)
Rooms in renter-occupied houses - 7 rooms (%)
Rooms in renter-occupied houses - 8 rooms (%)
Rooms in renter-occupied houses - 9+ rooms (%)
Bedrooms in owner-occupied houses - no bedrooms (%)
Bedrooms in owner-occupied houses - 1 bedroom (%)
Bedrooms in owner-occupied houses - 2 bedrooms (%)
Bedrooms in owner-occupied houses - 3 bedrooms (%)
Bedrooms in owner-occupied houses - 4 bedrooms (%)
Bedrooms in owner-occupied houses - 5+ bedrooms (%)
Bedrooms in renter-occupied houses - no bedrooms (%)
Bedrooms in renter-occupied houses - 1 bedroom (%)
Bedrooms in renter-occupied houses - 2 bedrooms (%)
Bedrooms in renter-occupied houses - 3 bedrooms (%)
Bedrooms in renter-occupied houses - 4 bedrooms (%)
Bedrooms in renter-occupied houses - 5+ bedrooms (%)
Vehicles available in owner-occupied houses - no vehicle available (%)
Vehicles available in owner-occupied houses - 1 vehicle available(%)
Vehicles available in owner-occupied houses - 2 Vehicles available (%)
Vehicles available in owner-occupied houses - 3 Vehicles available (%)
Vehicles available in owner-occupied houses - 4 Vehicles available (%)
Vehicles available in owner-occupied houses - 5+ Vehicles available (%)
Vehicles available in renter-occupied houses - no vehicle available (%)
Vehicles available in renter-occupied houses - 1 vehicle available (%)
Vehicles available in renter-occupied houses - 2 Vehicles available (%)
Vehicles available in renter-occupied houses - 3 Vehicles available (%)
Vehicles available in renter-occupied houses - 4 Vehicles available (%)
Vehicles available in renter-occupied houses - 5+ Vehicles available (%)
Housing units in structures - 1, detached (%)
Housing units in structures - 1, attached (%)
Housing units in structures - 2 (%)
Housing units in structures - 3 or 4 (%)
Housing units in structures - 5 to 9 (%)
Housing units in structures - 10 to 19 (%)
Housing units in structures - 20 to 49 (%)
Housing units in structures - 50 or more (%)
Housing units in structures - Mobile home (%)
Housing units in structures - Boat, RV, van, etc. (%)
Housing units in structures - Owners - 1, detached (%)
Housing units in structures - Owners - 1, attached (%)
Housing units in structures - Owners - 2 (%)
Housing units in structures - Owners - 3 or 4 (%)
Housing units in structures - Owners - 5 to 9 (%)
Housing units in structures - Owners - 10 to 19 (%)
Housing units in structures - Owners - 20 to 49 (%)
Housing units in structures - Owners - 50 or more (%)
Housing units in structures - Owners - Mobile home (%)
Housing units in structures - Owners - Boat, RV, van, etc. (%)
Housing units in structures - Renters - 1, detached (%)
Housing units in structures - Renters - 1, attached (%)
Housing units in structures - Renters - 2 (%)
Housing units in structures - Renters - 3 or 4 (%)
Housing units in structures - Renters - 5 to 9 (%)
Housing units in structures - Renters - 10 to 19 (%)
Housing units in structures - Renters - 20 to 49 (%)
Housing units in structures - Renters - 50 or more (%)
Housing units in structures - Renters - Mobile home (%)
Housing units in structures - Renters - Boat, RV, van, etc. (%)
House/condo owner moved in on average (years ago)
Renter moved in on average (years ago)
Year householder moved into unit - Moved in 1999 to March 2000 (%)
Year householder moved into unit - Moved in 1999 to March 2000 (%) - White
Year householder moved into unit - Moved in 1999 to March 2000 (%) - Black or African American
Year householder moved into unit - Moved in 1999 to March 2000 (%) - Asian
Year householder moved into unit - Moved in 1999 to March 2000 (%) - Hispanic or Latino
Year householder moved into unit - Moved in 1999 to March 2000 (%) - American Indian and Alaska Native
Year householder moved into unit - Moved in 1999 to March 2000 (%) - Multirace
Year householder moved into unit - Moved in 1999 to March 2000 (%) - Other Race
Year householder moved into unit - Moved in 1995 to 1998 (%)
Year householder moved into unit - Moved in 1995 to 1998 (%) - White
Year householder moved into unit - Moved in 1995 to 1998 (%) - Black or African American
Year householder moved into unit - Moved in 1995 to 1998 (%) - Asian
Year householder moved into unit - Moved in 1995 to 1998 (%) - Hispanic or Latino
Year householder moved into unit - Moved in 1995 to 1998 (%) - American Indian and Alaska Native
Year householder moved into unit - Moved in 1995 to 1998 (%) - Multirace
Year householder moved into unit - Moved in 1995 to 1998 (%) - Other Race
Year householder moved into unit - Moved in 1990 to 1994 (%)
Year householder moved into unit - Moved in 1990 to 1994 (%) - White
Year householder moved into unit - Moved in 1990 to 1994 (%) - Black or African American
Year householder moved into unit - Moved in 1990 to 1994 (%) - Asian
Year householder moved into unit - Moved in 1990 to 1994 (%) - Hispanic or Latino
Year householder moved into unit - Moved in 1990 to 1994 (%) - American Indian and Alaska Native
Year householder moved into unit - Moved in 1990 to 1994 (%) - Multirace
Year householder moved into unit - Moved in 1990 to 1994 (%) - Other Race
Year householder moved into unit - Moved in 1980 to 1989 (%)
Year householder moved into unit - Moved in 1980 to 1989 (%) - White
Year householder moved into unit - Moved in 1980 to 1989 (%) - Black or African American
Year householder moved into unit - Moved in 1980 to 1989 (%) - Asian
Year householder moved into unit - Moved in 1980 to 1989 (%) - Hispanic or Latino
Year householder moved into unit - Moved in 1980 to 1989 (%) - American Indian and Alaska Native
Year householder moved into unit - Moved in 1980 to 1989 (%) - Multirace
Year householder moved into unit - Moved in 1980 to 1989 (%) - Other Race
Year householder moved into unit - Moved in 1970 to 1979 (%)
Year householder moved into unit - Moved in 1970 to 1979 (%) - White
Year householder moved into unit - Moved in 1970 to 1979 (%) - Black or African American
Year householder moved into unit - Moved in 1970 to 1979 (%) - Asian
Year householder moved into unit - Moved in 1970 to 1979 (%) - Hispanic or Latino
Year householder moved into unit - Moved in 1970 to 1979 (%) - American Indian and Alaska Native
Year householder moved into unit - Moved in 1970 to 1979 (%) - Multirace
Year householder moved into unit - Moved in 1970 to 1979 (%) - Other Race
Year householder moved into unit - Moved in 1969 or earlier (%)
Year householder moved into unit - Moved in 1969 or earlier (%) - White
Year householder moved into unit - Moved in 1969 or earlier (%) - Black or African American
Year householder moved into unit - Moved in 1969 or earlier (%) - Asian
Year householder moved into unit - Moved in 1969 or earlier (%) - Hispanic or Latino
Year householder moved into unit - Moved in 1969 or earlier (%) - American Indian and Alaska Native
Year householder moved into unit - Moved in 1969 or earlier (%) - Multirace
Year householder moved into unit - Moved in 1969 or earlier (%) - Other Race
Housing units lacking complete plumbing facilities (%)
Housing units lacking complete kitchen facilities (%)
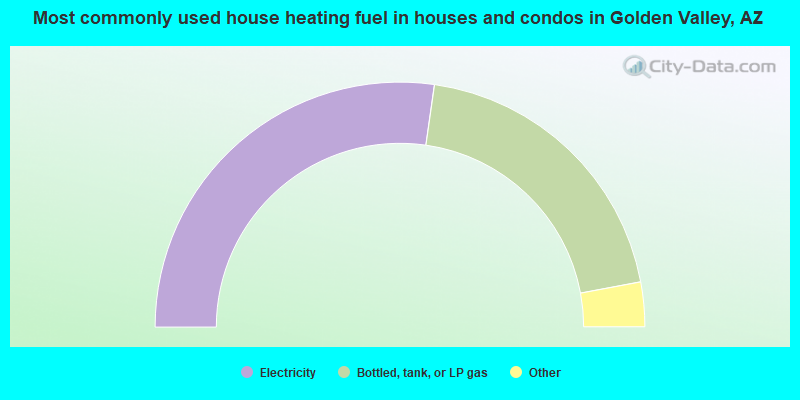
House heating fuel used in houses and condos - Utility gas (%)
House heating fuel used in houses and condos - Bottled, tank, or LP gas (%)
House heating fuel used in houses and condos - Electricity (%)
House heating fuel used in houses and condos - Fuel oil, kerosene, etc. (%)
House heating fuel used in houses and condos - Coal or coke (%)
House heating fuel used in houses and condos - Wood (%)
House heating fuel used in houses and condos - Solar energy (%)
House heating fuel used in houses and condos - Other fuel (%)
House heating fuel used in houses and condos - No fuel used (%)
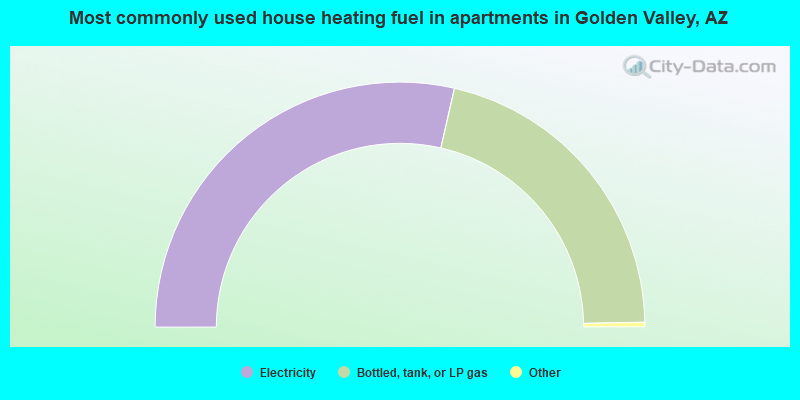
House heating fuel used in apartments - Utility gas (%)
House heating fuel used in apartments - Bottled, tank, or LP gas (%)
House heating fuel used in apartments - Electricity (%)
House heating fuel used in apartments - Fuel oil, kerosene, etc. (%)
House heating fuel used in apartments - Coal or coke (%)
House heating fuel used in apartments - Wood (%)
House heating fuel used in apartments - Solar energy (%)
House heating fuel used in apartments - Other fuel (%)
House heating fuel used in apartments - No fuel used (%)
Median year house/condo built: 1998Median year apartment built: 2000Household type by relationship:
Households: 8,142
Male householders: 1,978 (957 living alone ), Female householders: 2,001 (311 living alone )1,916 spouses (1,895 opposite-sex spouses ), 148 unmarried partners , (148 opposite-sex unmarried partners ), 982 children (893 natural , 88 adopted , 0 stepchildren ), 239 grandchildren , 124 brothers or sisters , 186 parents , 0 foster children , 213 other relatives , 352 non-relatives
Size of family households: 1,546 2-persons , 634 3-persons , 61 4-persons , 25 5-persons , 92 6-persons , 28 7-or-more-persons .
Size of nonfamily households: 1,295 1-person , 207 2-persons , 26 3-persons , 36 4-persons , 12 5-persons .
138 married couples with children. single-parent households (0 men , 222 women ).
96.0% of residents of Golden Valley speak English at home. of residents speak Spanish at home (94% speak English very well , 6% speak English not well ).of residents speak other Indo-European language at home (100% speak English very well ).of residents speak other language at home (100% speak English well ).
Foreign born population: 81 (1.0%)of them are naturalized citizens )
Median number of rooms in houses and condos:
Median number of rooms in apartments
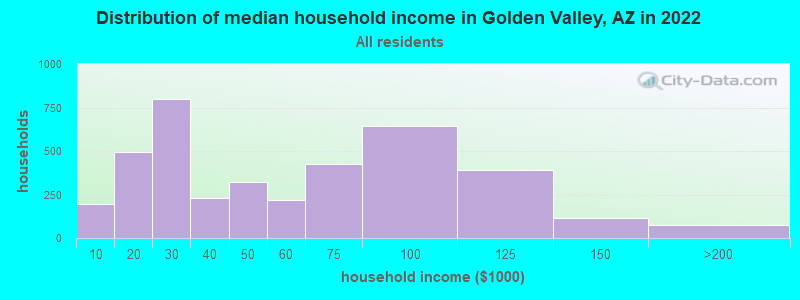
Golden Valley, AZ household income distribution 198 Less than $10,000494 $10,000 to $19,999801 $20,000 to $29,999231 $30,000 to $39,999324 $40,000 to $49,999220 $50,000 to $59,999426 $60,000 to $74,999641 $75,000 to $99,999393 $100,000 to $124,999114 $125,000 to $149,99964 $150,000 to $199,99913 $200,000 or more
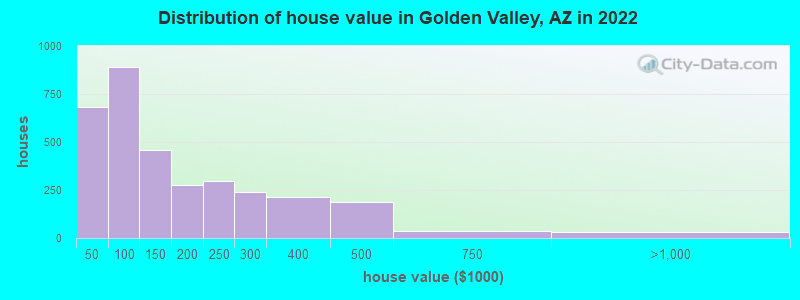
Home value of owner - occupied houses in 2022 in Golden Valley, AZ 228 Less than $10,00072 $10,000 to $14,99970 $15,000 to $19,99931 $20,000 to $24,99932 $25,000 to $29,99951 $30,000 to $34,999142 $35,000 to $39,99952 $40,000 to $49,99969 $50,000 to $59,999356 $60,000 to $69,999195 $70,000 to $79,999134 $80,000 to $89,99981 $90,000 to $99,999372 $100,000 to $124,99985 $125,000 to $149,99977 $150,000 to $174,999196 $175,000 to $199,999294 $200,000 to $249,999238 $250,000 to $299,999213 $300,000 to $399,999187 $400,000 to $499,99933 $500,000 to $749,99933 $750,000 to $999,999Rent paid by renters in 2022 in Golden Valley, AZ 31 $300 to $34914 $400 to $44938 $700 to $74964 $800 to $89960 No cash rent
Percentage of workers working in this county: 91.0%Number of people working at home: 266 (12.1% of all workers )
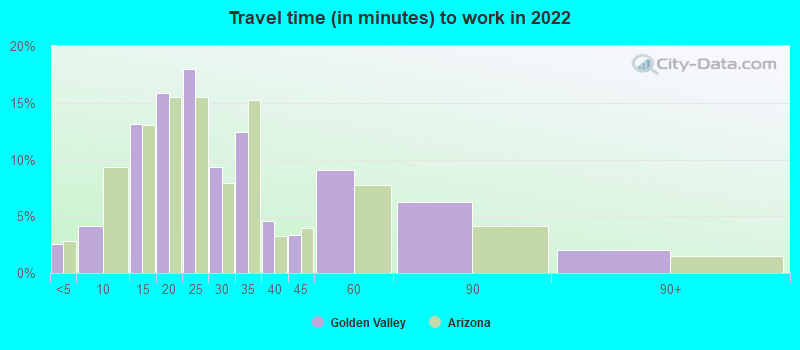
Travel time to work (commute)
Less than 5 minutes: 1135 to 9 minutes: 11310 to 14 minutes: 30915 to 19 minutes: 17320 to 24 minutes: 42025 to 29 minutes: 22230 to 34 minutes: 12635 to 39 minutes: 5640 to 44 minutes: 3345 to 59 minutes: 7960 to 89 minutes: 16190 or more minutes: 8
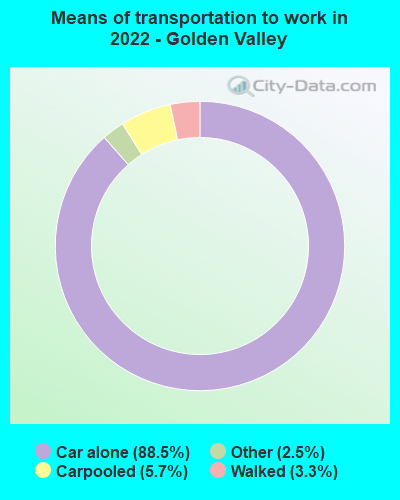
Means of transportation to work:
Drove a car alone: 1,035 (79.6%)Carpooled: 66 (5.1%)Taxi: 33 (2.5%)Walked: 36 (2.8%)Worked at home: 60 (4.6%)
Unemployment by race in 2022
Unemployment rate for White non-Hispanic residents 15.6% Males3.7% Females
Year of entry for the foreign-born population in Golden Valley, Arizona
0 2010 or later 0 2000 to 2009 0 1990 to 1999 26 1980 to 1989 77 1970 to 1979 49 Before 1970
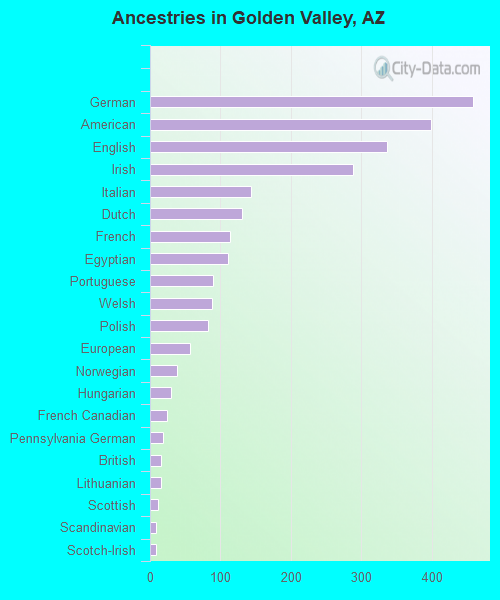
First ancestries reported:
German: 458 (13.3%)
American: 398 (11.6%)
English: 336 (9.8%)
Irish: 288 (8.4%)
Italian: 143 (4.2%)
Dutch: 130 (3.8%)
French: 114 (3.3%)
Egyptian: 111 (3.2%)
Portuguese: 89 (2.6%)
Welsh: 88 (2.6%)
Polish: 82 (2.4%)
European: 57 (1.7%)
Norwegian: 38 (1.1%)
Hungarian: 30 (0.9%)
French Canadian: 24 (0.7%)
Pennsylvania German: 19 (0.6%)
British: 15 (0.4%)
Lithuanian: 15 (0.4%)
Scottish: 12 (0.3%)
Scandinavian: 9 (0.3%)
Scotch-Irish: 8 (0.2%) Most common places of birth for foreign-born residents (%): Mexico Golden Valley:
54.6% (53)Arizona:
53.4% (500,086)
Korea Golden Valley:
21.6% (21)Arizona:
1.2% (11,275)
Canada Golden Valley:
20.6% (20)Arizona:
4.3% (40,102)
Place of birth for U.S.-born residents:
This state: 795Other state: 7,313Northeast: 892Midwest: 1,595South: 466West: 4,362 94.5% of Golden Valley residents lived in the same house 1 years ago.
Out of people who lived in different houses, 31.2% lived in this county.
Out of people who lived in different counties, 4.4% lived in Arizona.
Golden Valley:
94.5%State average:
86.0%
Education attainment for males 25 years and older:
No schooling: 64Nursery to 4th grade: 135th and 6th grade: 07th and 8th grade: 839th grade: 14110th grade: 23311th grade: 4312th grade, no diploma: 165High school graduate (or equivalency): 1,318Less than 1 year of college: 308Some college more than 1 year, no degree: 840Associate degree: 332Bachelor's degree: 53Master's degree: 196Professional school degree: 0Doctorate degree: 0
Education attainment for females 25 years and older:
No schooling: 166Nursery to 4th grade: 175th and 6th grade: 07th and 8th grade: 729th grade: 8910th grade: 14611th grade: 8512th grade, no diploma: 87High school graduate (or equivalency): 1,271Less than 1 year of college: 551Some college more than 1 year, no degree: 564Associate degree: 300Bachelor's degree: 131Master's degree: 22Professional school degree: 45Doctorate degree: 0
Housing units in structures:
One, detached: 1,685One, attached: 16Two: 59Mobile homes: 2,785Boats, RVs, vans, etc.: 53Median worth of mobile homes: $95,234
Housing units lacking complete plumbing facilities in 2022: 9.0%Housing units lacking complete kitchen facilities in 2022: 2.1%House/condo owner moved in on average 9 years ago
Renter moved in on average 0 years ago
Private vs. public school enrollment:
Students in private schools in grades 1 to 8 (elementary and middle school): 33 Students in private schools in grades 9 to 12 (high school): 30 Students in private undergraduate colleges: 23