Fruitville, FL (Florida) Houses and Residents
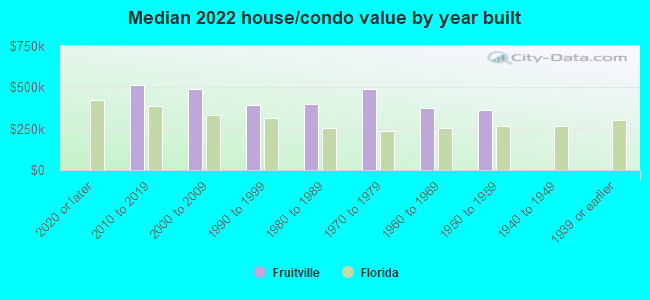
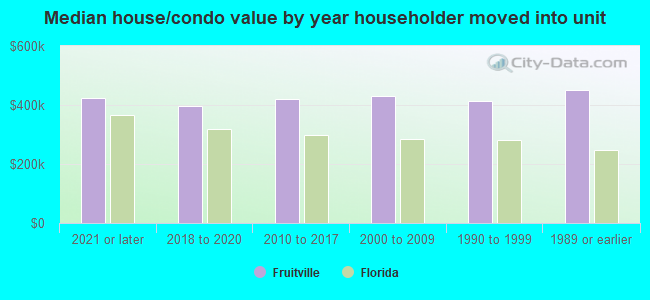
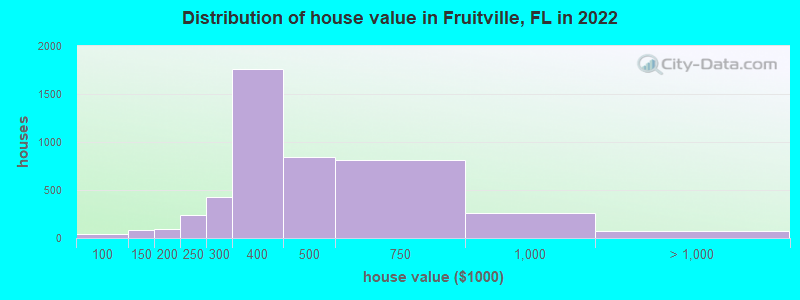
Estimated median house or condo value in 2022: $422,559 (it was $127,200 in 2000 )
Fruitville:
$422,559Florida:
$354,100
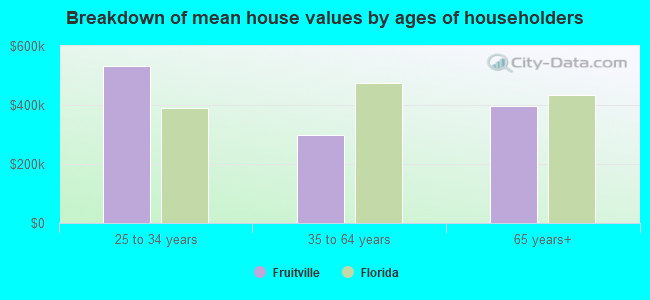
Lower value quartile - upper value quartile: $347,174 - $584,845Mean price in 2022: Detached houses: $410,340 Here:
$410,340State:
$500,941
Townhouses or other attached units: $269,573 Here:
$269,573State:
$370,869
In 2-unit structures: $446,431 Here:
$446,431State:
$423,188
In 3-to-4-unit structures: $267,774 Here:
$267,774State:
$309,944
In 5-or-more-unit structures: $320,079 Here:
$320,079State:
$447,145
Total population: 13,224 (Urban population: 12,892, Rural population: 0)
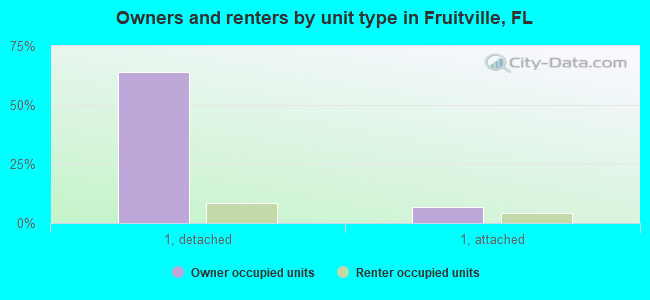
Houses: 7,874 (7,063 occupied: 4,600 owner occupied, 2,691 renter occupied )
% of renters here:
37%State:
33%
Housing density: 1,119 houses/condos per square mile
Median price asked for vacant for-sale houses and condos in 2022: $932,535.
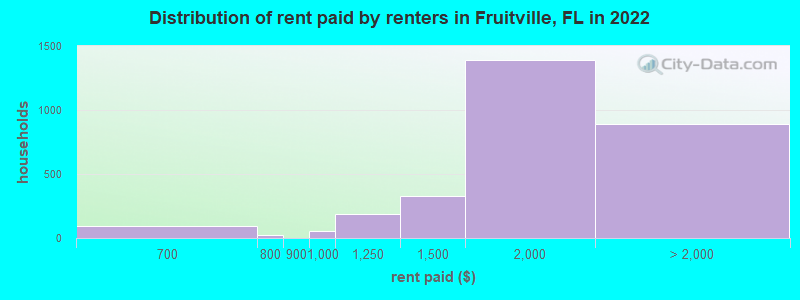
Median contract rent in 2022: $1,899 (lower quartile is $1,526, upper quartile is over $2,000)
Median rent asked for vacant for-rent units in 2022: $1,755
Median gross rent in Fruitville, FL in 2022: $1,871
Housing units in Fruitville with a mortgage: 2,596 (220 second mortgage, 0 home equity loan, 196 both second mortgage and home equity loan )Houses without a mortgage: 105
Median household income for houses/condos with a mortgage: $112,666
Median household income for apartments without a mortgage: $74,553
Median monthly housing costs: $1,575
Data:
Median house or condo value ($)
Median house or condo value ($ change since 2000)
Median house or condo value ($) - White
Median house or condo value ($) - Black or African American
Median house or condo value ($) - Asian
Median house or condo value ($) - Hispanic or Latino
Median house or condo value ($) - American Indian and Alaska Native
Median house or condo value ($) - Multirace
Median house or condo value ($) - Other Race
Median price asked for mobile homes ($)
Household density (households per square mile)
Mean house or condo value by units in structure - 1, detached ($)
Mean house or condo value by units in structure - 1, attached ($)
Mean house or condo value by units in structure - 2 ($)
Mean house or condo value by units in structure by units in structure - 3 or 4 ($)
Mean house or condo value by units in structure - 5 or more ($)
Mean house or condo value by units in structure - Boat, RV, van, etc. ($)
Mean house or condo value by units in structure - Mobile home ($)
Median contract rent ($)
Median contract rent - Lower quartile ($)
Median contract rent - Upper quartile ($)
Median gross rent ($)
Urban houses (%)
Rural houses (%)
Houses occupied (%)
Houses occupied (% change since 2000)
Houses owner occupied (%)
Houses owner occupied (% change since 2000)
Houses renter occupied (%)
Houses renter occupied (% change since 2000)
Vacant housing units - For rent (%)
Vacant housing units - For rent (% change since 2000)
Vacant housing units - For sale only (%)
Vacant housing units - For sale only (% change since 2000)
Vacant housing units - Rented or sold, not occupied (%)
Vacant housing units - Rented or sold, not occupied (% change since 2000)
Vacant housing units - For seasonal, recreational, or occasional use (%)
Vacant housing units - For seasonal, recreational, or occasional use (% change since 2000)
Vacant housing units - For migrant workers (%)
Vacant housing units - For migrant workers (% change since 2000)
Vacant housing units - Other vacant (%)
Vacant housing units - Other vacant (% change since 2000)
Median monthly housing costs ($)
Median household income for houses/condos with a mortgage ($)
Median household income for houses/condos without a mortgage ($)
Median household income ($)
Median household income ($) - White
Median household income ($) - Black or African American
Median household income ($) - Asian
Median household income ($) - Hispanic or Latino
Median household income ($) - American Indian and Alaska Native
Median household income ($) - Multirace
Median household income ($) - Other Race
Mortgage status - with mortgage (%)
Mortgage status - with second mortgage (%)
Mortgage status - with home equity loan (%)
Mortgage status - with both second mortgage and home equity loan (%)
Mortgage status - without a mortgage (%)
Median year house/condo built
Median year apartment built
Household type by relationship - Male householder living alone (%)
Household type by relationship - Male householder not living alone (%)
Household type by relationship - Female householder living alone (%)
Household type by relationship - Female householder not living alone (%)
Household type by relationship - Opposite-Sex spouse (%)
Household type by relationship - Same-Sex spouse (%)
Household type by relationship - Opposite-Sex unmarried partner (%)
Household type by relationship - Same-Sex unmarried partner (%)
Household type by relationship - In group quarters (%)
Size of family households - 2-person household (%)
Size of family households - 3-person household (%)
Size of family households - 4-person household (%)
Size of family households - 5-person household (%)
Size of family households - 6-person household (%)
Size of family households - 7-or-more-person household (%)
Size of nonfamily households - 1-person household (%)
Size of nonfamily households - 2-person household (%)
Size of nonfamily households - 3-person household (%)
Size of nonfamily households - 4-person household (%)
Size of nonfamily households - 5-person household (%)
Size of nonfamily households - 6-person household (%)
Size of nonfamily households - 7-or-moreperson household (%)
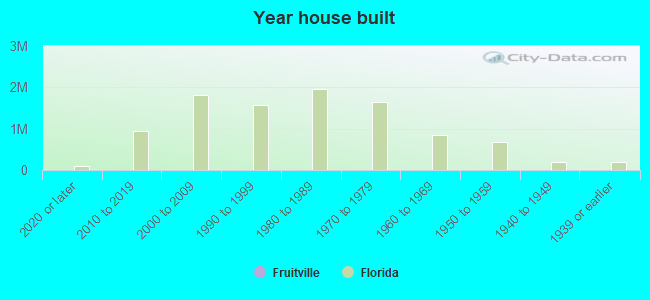
Year house built - Built 2010 or later (%)
Year house built - Built 2000 to 2009 (%)
Year house built - Built 1990 to 1999 (%)
Year house built - Built 1980 to 1989 (%)
Year house built - Built 1970 to 1979 (%)
Year house built - Built 1960 to 1969 (%)
Year house built - Built 1950 to 1959 (%)
Year house built - Built 1940 to 1949 (%)
Year house built - Built 1939 or earlier (%)
Median number of rooms in houses and condos
Median number of rooms in apartments
Median number of bedrooms in owner occupied houses
Mean number of bedrooms in owner occupied houses
Median number of bedrooms in renter occupied houses
Mean number of bedrooms in renter occupied houses
Median number of vehichles in owner occupied houses
Mean number of vehichles in owner occupied houses
Median number of vehichles in renter occupied houses
Mean number of vehichles in renter occupied houses
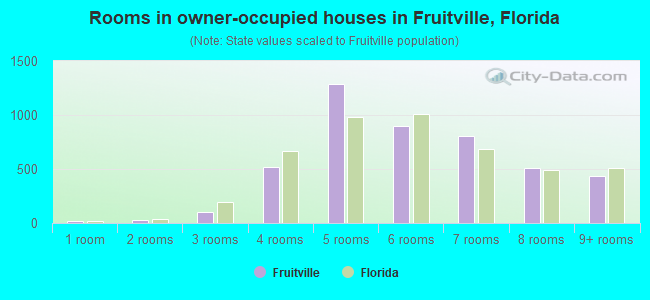
Rooms in owner-occupied houses - 1 room (%)
Rooms in owner-occupied houses - 2 rooms (%)
Rooms in owner-occupied houses - 3 rooms (%)
Rooms in owner-occupied houses - 4 rooms (%)
Rooms in owner-occupied houses - 5 rooms (%)
Rooms in owner-occupied houses - 6 rooms (%)
Rooms in owner-occupied houses - 7 rooms (%)
Rooms in owner-occupied houses - 8 rooms (%)
Rooms in owner-occupied houses - 9+ rooms (%)
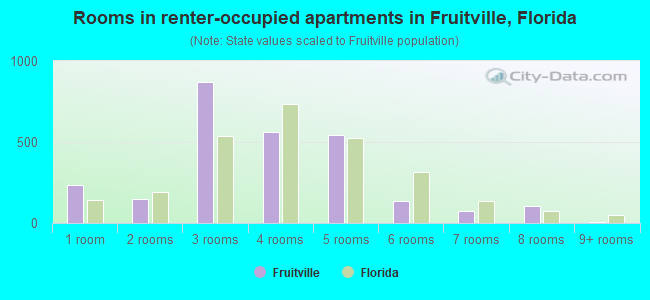
Rooms in renter-occupied houses - 1 room (%)
Rooms in renter-occupied houses - 2 rooms (%)
Rooms in renter-occupied houses - 3 rooms (%)
Rooms in renter-occupied houses - 4 rooms (%)
Rooms in renter-occupied houses - 5 rooms (%)
Rooms in renter-occupied houses - 6 rooms (%)
Rooms in renter-occupied houses - 7 rooms (%)
Rooms in renter-occupied houses - 8 rooms (%)
Rooms in renter-occupied houses - 9+ rooms (%)
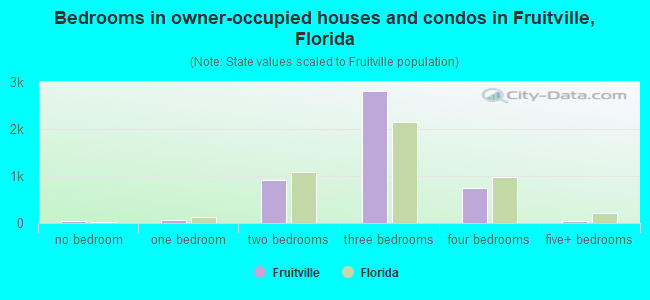
Bedrooms in owner-occupied houses - no bedrooms (%)
Bedrooms in owner-occupied houses - 1 bedroom (%)
Bedrooms in owner-occupied houses - 2 bedrooms (%)
Bedrooms in owner-occupied houses - 3 bedrooms (%)
Bedrooms in owner-occupied houses - 4 bedrooms (%)
Bedrooms in owner-occupied houses - 5+ bedrooms (%)
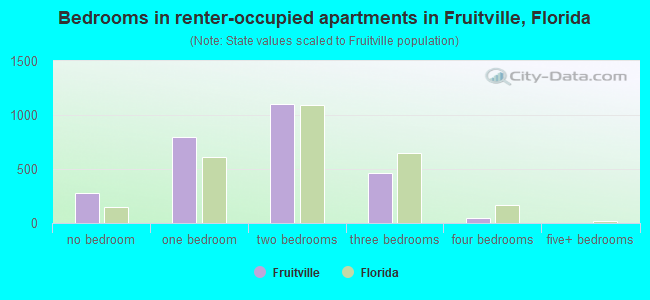
Bedrooms in renter-occupied houses - no bedrooms (%)
Bedrooms in renter-occupied houses - 1 bedroom (%)
Bedrooms in renter-occupied houses - 2 bedrooms (%)
Bedrooms in renter-occupied houses - 3 bedrooms (%)
Bedrooms in renter-occupied houses - 4 bedrooms (%)
Bedrooms in renter-occupied houses - 5+ bedrooms (%)
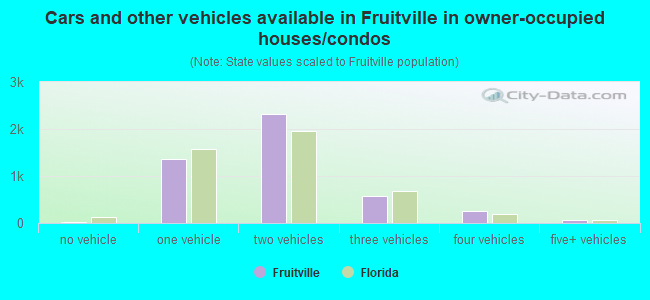
Vehicles available in owner-occupied houses - no vehicle available (%)
Vehicles available in owner-occupied houses - 1 vehicle available(%)
Vehicles available in owner-occupied houses - 2 Vehicles available (%)
Vehicles available in owner-occupied houses - 3 Vehicles available (%)
Vehicles available in owner-occupied houses - 4 Vehicles available (%)
Vehicles available in owner-occupied houses - 5+ Vehicles available (%)
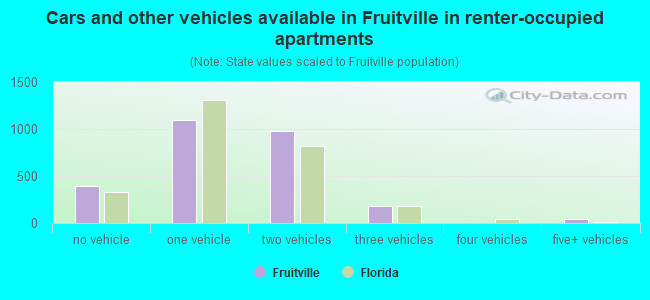
Vehicles available in renter-occupied houses - no vehicle available (%)
Vehicles available in renter-occupied houses - 1 vehicle available (%)
Vehicles available in renter-occupied houses - 2 Vehicles available (%)
Vehicles available in renter-occupied houses - 3 Vehicles available (%)
Vehicles available in renter-occupied houses - 4 Vehicles available (%)
Vehicles available in renter-occupied houses - 5+ Vehicles available (%)
Housing units in structures - 1, detached (%)
Housing units in structures - 1, attached (%)
Housing units in structures - 2 (%)
Housing units in structures - 3 or 4 (%)
Housing units in structures - 5 to 9 (%)
Housing units in structures - 10 to 19 (%)
Housing units in structures - 20 to 49 (%)
Housing units in structures - 50 or more (%)
Housing units in structures - Mobile home (%)
Housing units in structures - Boat, RV, van, etc. (%)
Housing units in structures - Owners - 1, detached (%)
Housing units in structures - Owners - 1, attached (%)
Housing units in structures - Owners - 2 (%)
Housing units in structures - Owners - 3 or 4 (%)
Housing units in structures - Owners - 5 to 9 (%)
Housing units in structures - Owners - 10 to 19 (%)
Housing units in structures - Owners - 20 to 49 (%)
Housing units in structures - Owners - 50 or more (%)
Housing units in structures - Owners - Mobile home (%)
Housing units in structures - Owners - Boat, RV, van, etc. (%)
Housing units in structures - Renters - 1, detached (%)
Housing units in structures - Renters - 1, attached (%)
Housing units in structures - Renters - 2 (%)
Housing units in structures - Renters - 3 or 4 (%)
Housing units in structures - Renters - 5 to 9 (%)
Housing units in structures - Renters - 10 to 19 (%)
Housing units in structures - Renters - 20 to 49 (%)
Housing units in structures - Renters - 50 or more (%)
Housing units in structures - Renters - Mobile home (%)
Housing units in structures - Renters - Boat, RV, van, etc. (%)
House/condo owner moved in on average (years ago)
Renter moved in on average (years ago)
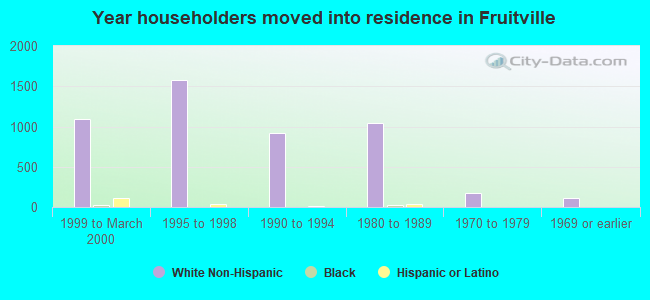
Year householder moved into unit - Moved in 1999 to March 2000 (%)
Year householder moved into unit - Moved in 1999 to March 2000 (%) - White
Year householder moved into unit - Moved in 1999 to March 2000 (%) - Black or African American
Year householder moved into unit - Moved in 1999 to March 2000 (%) - Asian
Year householder moved into unit - Moved in 1999 to March 2000 (%) - Hispanic or Latino
Year householder moved into unit - Moved in 1999 to March 2000 (%) - American Indian and Alaska Native
Year householder moved into unit - Moved in 1999 to March 2000 (%) - Multirace
Year householder moved into unit - Moved in 1999 to March 2000 (%) - Other Race
Year householder moved into unit - Moved in 1995 to 1998 (%)
Year householder moved into unit - Moved in 1995 to 1998 (%) - White
Year householder moved into unit - Moved in 1995 to 1998 (%) - Black or African American
Year householder moved into unit - Moved in 1995 to 1998 (%) - Asian
Year householder moved into unit - Moved in 1995 to 1998 (%) - Hispanic or Latino
Year householder moved into unit - Moved in 1995 to 1998 (%) - American Indian and Alaska Native
Year householder moved into unit - Moved in 1995 to 1998 (%) - Multirace
Year householder moved into unit - Moved in 1995 to 1998 (%) - Other Race
Year householder moved into unit - Moved in 1990 to 1994 (%)
Year householder moved into unit - Moved in 1990 to 1994 (%) - White
Year householder moved into unit - Moved in 1990 to 1994 (%) - Black or African American
Year householder moved into unit - Moved in 1990 to 1994 (%) - Asian
Year householder moved into unit - Moved in 1990 to 1994 (%) - Hispanic or Latino
Year householder moved into unit - Moved in 1990 to 1994 (%) - American Indian and Alaska Native
Year householder moved into unit - Moved in 1990 to 1994 (%) - Multirace
Year householder moved into unit - Moved in 1990 to 1994 (%) - Other Race
Year householder moved into unit - Moved in 1980 to 1989 (%)
Year householder moved into unit - Moved in 1980 to 1989 (%) - White
Year householder moved into unit - Moved in 1980 to 1989 (%) - Black or African American
Year householder moved into unit - Moved in 1980 to 1989 (%) - Asian
Year householder moved into unit - Moved in 1980 to 1989 (%) - Hispanic or Latino
Year householder moved into unit - Moved in 1980 to 1989 (%) - American Indian and Alaska Native
Year householder moved into unit - Moved in 1980 to 1989 (%) - Multirace
Year householder moved into unit - Moved in 1980 to 1989 (%) - Other Race
Year householder moved into unit - Moved in 1970 to 1979 (%)
Year householder moved into unit - Moved in 1970 to 1979 (%) - White
Year householder moved into unit - Moved in 1970 to 1979 (%) - Black or African American
Year householder moved into unit - Moved in 1970 to 1979 (%) - Asian
Year householder moved into unit - Moved in 1970 to 1979 (%) - Hispanic or Latino
Year householder moved into unit - Moved in 1970 to 1979 (%) - American Indian and Alaska Native
Year householder moved into unit - Moved in 1970 to 1979 (%) - Multirace
Year householder moved into unit - Moved in 1970 to 1979 (%) - Other Race
Year householder moved into unit - Moved in 1969 or earlier (%)
Year householder moved into unit - Moved in 1969 or earlier (%) - White
Year householder moved into unit - Moved in 1969 or earlier (%) - Black or African American
Year householder moved into unit - Moved in 1969 or earlier (%) - Asian
Year householder moved into unit - Moved in 1969 or earlier (%) - Hispanic or Latino
Year householder moved into unit - Moved in 1969 or earlier (%) - American Indian and Alaska Native
Year householder moved into unit - Moved in 1969 or earlier (%) - Multirace
Year householder moved into unit - Moved in 1969 or earlier (%) - Other Race
Housing units lacking complete plumbing facilities (%)
Housing units lacking complete kitchen facilities (%)
House heating fuel used in houses and condos - Utility gas (%)
House heating fuel used in houses and condos - Bottled, tank, or LP gas (%)
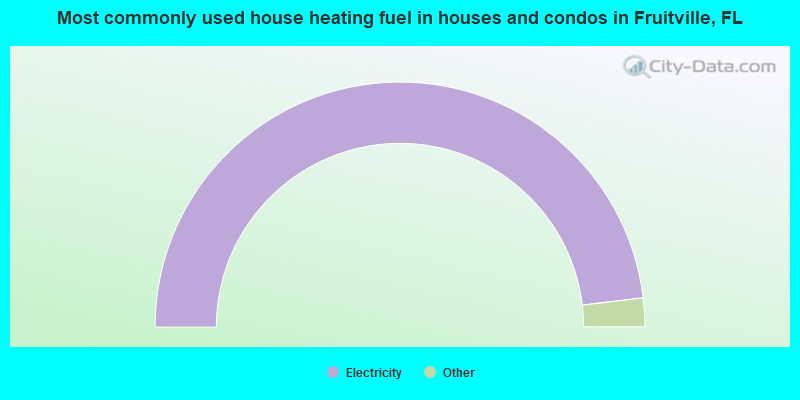
House heating fuel used in houses and condos - Electricity (%)
House heating fuel used in houses and condos - Fuel oil, kerosene, etc. (%)
House heating fuel used in houses and condos - Coal or coke (%)
House heating fuel used in houses and condos - Wood (%)
House heating fuel used in houses and condos - Solar energy (%)
House heating fuel used in houses and condos - Other fuel (%)
House heating fuel used in houses and condos - No fuel used (%)
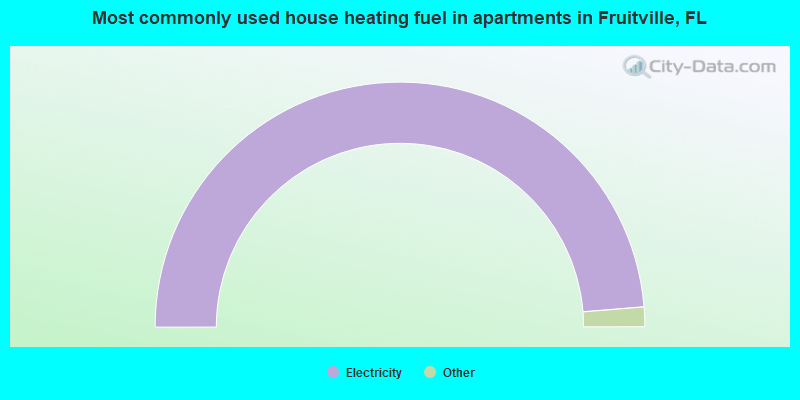
House heating fuel used in apartments - Utility gas (%)
House heating fuel used in apartments - Bottled, tank, or LP gas (%)
House heating fuel used in apartments - Electricity (%)
House heating fuel used in apartments - Fuel oil, kerosene, etc. (%)
House heating fuel used in apartments - Coal or coke (%)
House heating fuel used in apartments - Wood (%)
House heating fuel used in apartments - Solar energy (%)
House heating fuel used in apartments - Other fuel (%)
House heating fuel used in apartments - No fuel used (%)
Latest news about housing in Fruitville, FL collected exclusively by city-data.com from local newspapers, TV, and radio stations
Median year house/condo built: 1989Median year apartment built: 1997Household type by relationship:
Households: 16,131
Male householders: 3,333 (728 living alone ), Female householders: 3,776 (1,608 living alone )3,239 spouses (3,213 opposite-sex spouses ), 598 unmarried partners , (506 opposite-sex unmarried partners ), 3,588 children (3,219 natural , 122 adopted , 247 stepchildren ), 54 grandchildren , 99 brothers or sisters , 368 parents , 34 foster children , 164 other relatives , 609 non-relatives In group quarters: 265
Size of family households: 2,209 2-persons , 1,037 3-persons , 631 4-persons , 202 5-persons , 162 6-persons , 41 7-or-more-persons .
Size of nonfamily households: 2,359 1-person , 546 2-persons , 65 3-persons , 24 4-persons .
1,827 married couples with children. single-parent households (387 men , 327 women ).
84.4% of residents of Fruitville speak English at home. of residents speak Spanish at home (58% speak English very well , 36% speak English well , 4% speak English not well , 1% don't speak English at all ).of residents speak other Indo-European language at home (79% speak English very well , 11% speak English well , 10% speak English not well ).of residents speak Asian or Pacific Island language at home (43% speak English very well , 33% speak English well , 24% speak English not well ).of residents speak other language at home (54% speak English very well , 46% speak English well ).
Foreign born population: 2,034 (12.6%)of them are naturalized citizens )
Median number of rooms in houses and condos:
Median number of rooms in apartments
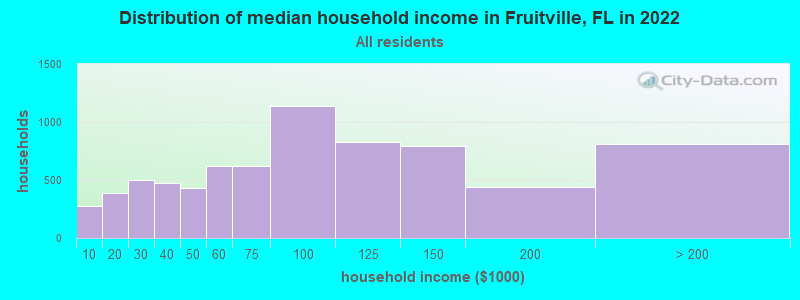
Fruitville, FL household income distribution 272 Less than $10,000384 $10,000 to $19,999499 $20,000 to $29,999471 $30,000 to $39,999431 $40,000 to $49,999620 $50,000 to $59,999620 $60,000 to $74,9991,141 $75,000 to $99,999830 $100,000 to $124,999790 $125,000 to $149,999440 $150,000 to $199,999808 $200,000 or more
Home value of owner - occupied houses in 2022 in Fruitville, FL 11 $15,000 to $19,99924 $60,000 to $69,99911 $90,000 to $99,99963 $100,000 to $124,99920 $125,000 to $149,99939 $150,000 to $174,99956 $175,000 to $199,999237 $200,000 to $249,999426 $250,000 to $299,9991,756 $300,000 to $399,999839 $400,000 to $499,999812 $500,000 to $749,999256 $750,000 to $999,99951 $1,000,000 to $1,499,99916 $2,000,000 or moreRent paid by renters in 2022 in Fruitville, FL 8 $300 to $34996 $650 to $69920 $750 to $79952 $900 to $999188 $1,000 to $1,249325 $1,250 to $1,4991,388 $1,500 to $1,999446 $2,000 to $2,499429 $2,500 to $2,99917 No cash rent
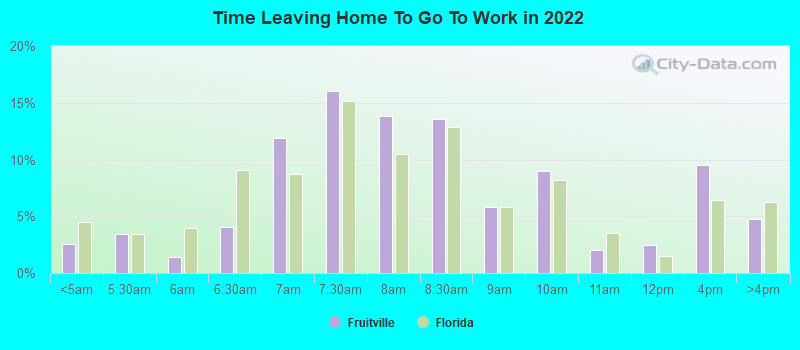
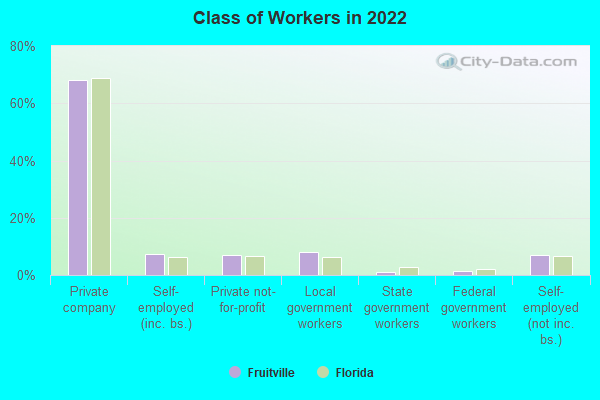
Percentage of workers working in this county: 84.2%Number of people working at home: 1,161 (14.0% of all workers )
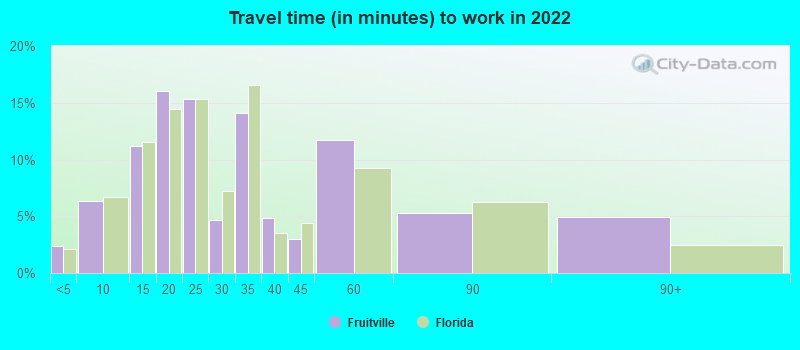
Travel time to work (commute)
Less than 5 minutes: 1225 to 9 minutes: 34610 to 14 minutes: 1,04015 to 19 minutes: 1,53620 to 24 minutes: 1,42825 to 29 minutes: 49130 to 34 minutes: 94935 to 39 minutes: 11240 to 44 minutes: 7645 to 59 minutes: 37060 to 89 minutes: 34090 or more minutes: 94
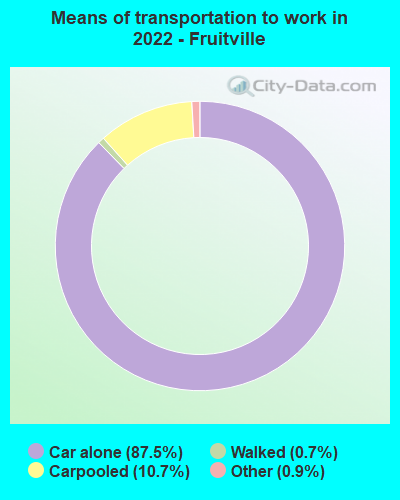
Means of transportation to work:
Drove a car alone: 8,414 (75.3%)Carpooled: 1,195 (10.7%)Bus : 3 (0.0%)Taxi: 138 (1.2%)Bicycle: 6 (0.1%)Walked: 129 (1.2%)Worked at home: 1,161 (10.4%)
Unemployment by race in 2022
Unemployment rate for White non-Hispanic residents 1.8% Males2.1% FemalesUnemployment rate for Black residents 52.2% FemalesUnemployment rate for Asian residents 9.2% FemalesUnemployment rate for other race residents 4.7% FemalesUnemployment rate for two or more race residents 8.1% MalesUnemployment rate for Hispanic or Latino residents 3.4% Males0.7% Females
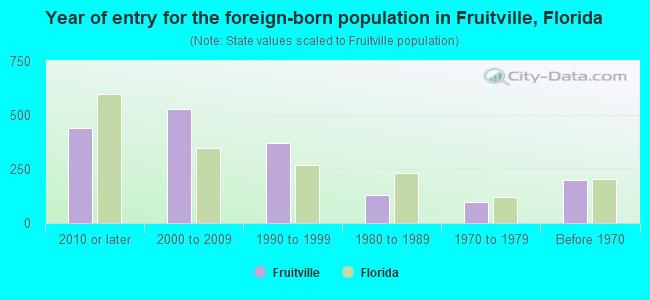
Year of entry for the foreign-born population in Fruitville, Florida
441 2010 or later 530 2000 to 2009 370 1990 to 1999 130 1980 to 1989 95 1970 to 1979 198 Before 1970
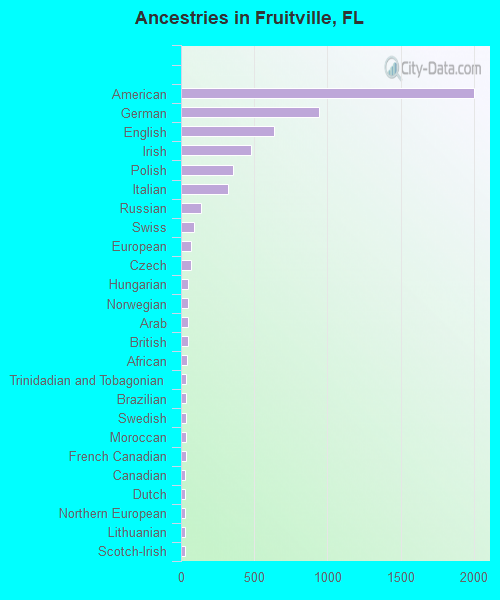
First ancestries reported:
American: 2,004 (26.0%)
German: 946 (12.3%)
English: 638 (8.3%)
Irish: 476 (6.2%)
Polish: 355 (4.6%)
Italian: 322 (4.2%)
Russian: 134 (1.7%)
Swiss: 86 (1.1%)
European: 66 (0.9%)
Czech: 65 (0.8%)
Hungarian: 48 (0.6%)
Norwegian: 46 (0.6%)
Arab: 45 (0.6%)
British: 45 (0.6%)
African: 43 (0.6%)
Trinidadian and Tobagonian: 37 (0.5%)
Brazilian: 34 (0.4%)
Swedish: 34 (0.4%)
Moroccan: 33 (0.4%)
French Canadian: 33 (0.4%)
Canadian: 29 (0.4%)
Dutch: 29 (0.4%)
Northern European: 28 (0.4%)
Lithuanian: 25 (0.3%)
Scotch-Irish: 25 (0.3%)
French: 24 (0.3%)
Scottish: 24 (0.3%)
Slovak: 24 (0.3%)
Australian: 23 (0.3%)
Danish: 20 (0.3%)
Jamaican: 20 (0.3%)
Guyanese: 15 (0.2%)
Austrian: 11 (0.1%)
Welsh: 9 (0.1%)
Scandinavian: 8 (0.1%)
Armenian: 7 (0.09%)
Icelander: 3 (0.04%) Most common places of birth for foreign-born residents (%): Mexico Fruitville:
9.3% (166)Florida:
5.6% (257,152)
Colombia Fruitville:
7.9% (142)Florida:
6.5% (298,669)
Dominican Republic Fruitville:
5.9% (106)Florida:
3.0% (137,727)
Thailand Fruitville:
5.7% (102)Florida:
0.3% (12,303)
Cuba Fruitville:
5.3% (95)Florida:
22.0% (1,006,576)
Poland Fruitville:
4.7% (84)Florida:
0.6% (25,219)
Morocco Fruitville:
4.0% (71)Florida:
0.2% (9,164)
Germany Fruitville:
3.9% (70)Florida:
1.2% (54,272)
England Fruitville:
3.7% (67)Florida:
0.8% (37,723)
Canada Fruitville:
3.7% (66)Florida:
2.4% (109,132)
Brazil Fruitville:
3.6% (64)Florida:
2.7% (122,906)
Trinidad and Tobago Fruitville:
3.3% (60)Florida:
1.0% (43,642)
United Kingdom, excluding England and Scotland Fruitville:
3.3% (59)Florida:
0.7% (34,227)
Guatemala Fruitville:
3.3% (59)Florida:
2.1% (97,632)
Vietnam Fruitville:
3.1% (56)Florida:
1.3% (60,604)
Nicaragua Fruitville:
3.1% (55)Florida:
2.3% (105,066)
Venezuela Fruitville:
3.0% (54)Florida:
5.7% (262,042)
Belarus Fruitville:
2.4% (43)Florida:
0.1% (3,802)
Jamaica Fruitville:
2.3% (41)Florida:
5.0% (227,319)
Peru Fruitville:
2.3% (41)Florida:
2.1% (96,693)
Russia Fruitville:
1.8% (33)Florida:
0.7% (31,076)
Guyana Fruitville:
1.8% (32)Florida:
0.7% (33,556)
Philippines Fruitville:
1.7% (30)Florida:
1.8% (84,403)
Place of birth for U.S.-born residents:
This state: 4,886Other state: 8,923Northeast: 3,466Midwest: 3,236South: 1,977West: 271 79.6% of Fruitville residents lived in the same house 1 years ago.
Out of people who lived in different houses, 29.0% lived in this county.
Out of people who lived in different counties, 63.9% lived in Florida.
Fruitville:
79.6%State average:
86.3%
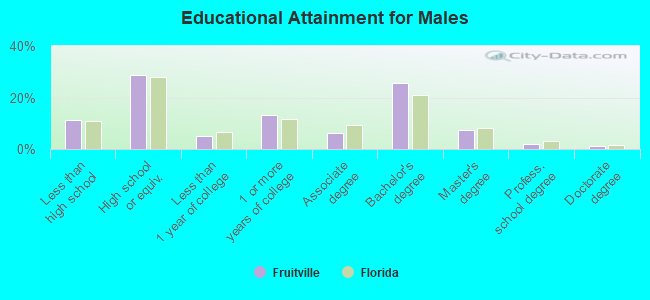
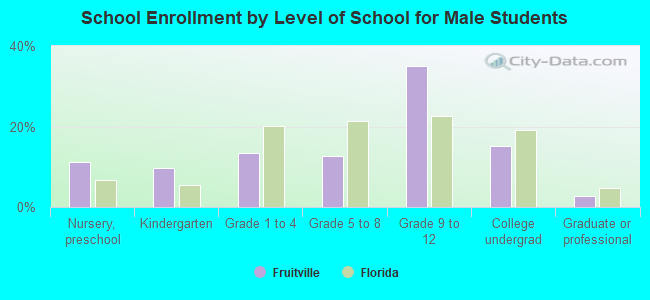
Education attainment for males 25 years and older:
No schooling: 68Nursery to 4th grade: 175th and 6th grade: 1727th and 8th grade: 609th grade: 2110th grade: 4611th grade: 16012th grade, no diploma: 86High school graduate (or equivalency): 1,623Less than 1 year of college: 279Some college more than 1 year, no degree: 754Associate degree: 341Bachelor's degree: 1,443Master's degree: 405Professional school degree: 101Doctorate degree: 60
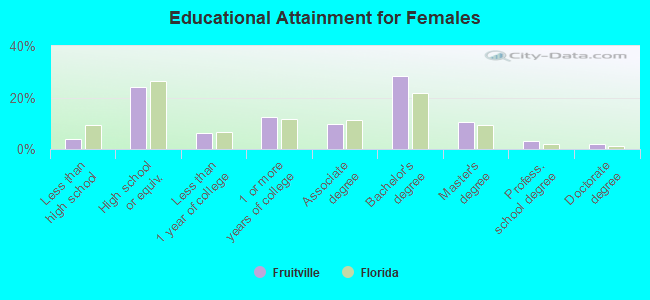
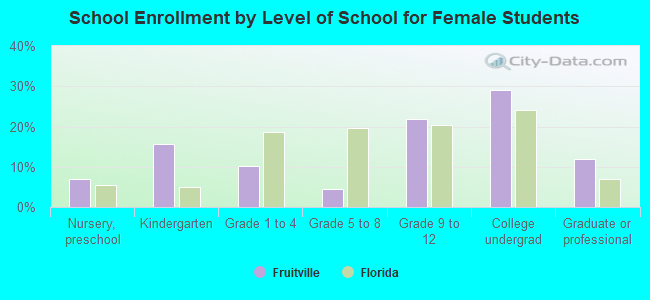
Education attainment for females 25 years and older:
No schooling: 34Nursery to 4th grade: 05th and 6th grade: 67th and 8th grade: 69th grade: 1310th grade: 5711th grade: 012th grade, no diploma: 129High school graduate (or equivalency): 1,582Less than 1 year of college: 408Some college more than 1 year, no degree: 816Associate degree: 639Bachelor's degree: 1,880Master's degree: 704Professional school degree: 201Doctorate degree: 122
Housing units in structures:
One, detached: 5,082One, attached: 581Two: 333 or 4: 2005 to 9: 23610 to 19: 33320 to 49: 88150 or more: 503Boats, RVs, vans, etc.: 21Housing units lacking complete kitchen facilities in 2022: 3.4%House/condo owner moved in on average 12 years ago
Renter moved in on average 3 years ago
Private vs. public school enrollment:
Students in private schools in grades 1 to 8 (elementary and middle school): 195 Students in private schools in grades 9 to 12 (high school): 152 Students in private undergraduate colleges: 185