Fresno, TX (Texas) Houses and Residents
| Fresno: | $241,085 |
| Texas: | $275,400 |
Mean price in 2022:
Detached houses: $280,542
Here: $280,542 State: $369,058 Townhouses or other attached units: $246,061
Here: $246,061 State: $327,631 Mobile homes: $106,535
Here: $106,535 State: $124,413
Total population: 19,069 (Urban population: 6,260, Rural population: 379 (38 farm, 341 nonfarm))
Houses: 8,996 (8,497 occupied: 7,158 owner occupied, 1,412 renter occupied)
| % of renters here: | 16% |
| State: | 38% |
Housing density: 1,001 houses/condos per square mile
Median price asked for vacant for-sale houses and condos in 2022: $84,007.
Median contract rent in 2022: $1,675 (lower quartile is $1,165, upper quartile is $1,917)
Median rent asked for vacant for-rent units in 2022: $4,199
Median gross rent in Fresno, TX in 2022: over $2,000
Housing units in Fresno with a mortgage: 5,448 (134 second mortgage, 0 home equity loan, 40 both second mortgage and home equity loan)
Houses without a mortgage: 0
Median household income for houses/condos with a mortgage: $90,762
Median household income for apartments without a mortgage: $75,559
Median monthly housing costs: $1,752
Compare current foreclosures in Fresno, TX:
| Photo | Address | Area | Beds / Baths | Price | Details |
|---|---|---|---|---|---|

|
#1
S Post Oak Blvd
Fresno, TX 77545
|
1,568 sq. feet
|
2 baths 4 beds |
show details | |

|
#2
Elm Stream Ct
Fresno, TX 77545
|
3,273 sq. feet
|
3 baths 4 beds |
show details | |

|
#3
Kim St
Fresno, TX 77545
|
948 sq. feet
|
1 baths 3 beds |
show details | |

|
#4
Quiet Hollow Dr
Fresno, TX 77545
|
3,204 sq. feet
|
2 baths 4 beds |
show details | |

|
#5
Texas Elm Ct
Fresno, TX 77545
|
2,620 sq. feet
|
2 baths 4 beds |
show details | |

|
#6
Seville Mnr
Fresno, TX 77545
|
1,980 sq. feet
|
2 baths 4 beds |
show details | |

|
#7
Yorkshire Holw
Fresno, TX 77545
|
1,238 sq. feet
|
2 baths 3 beds |
show details | |

|
#8
Evergreen Square Trl
Fresno, TX 77545
|
1,968 sq. feet
|
2 baths 3 beds |
show details | |

|
#9
Becker Glen St
Fresno, TX 77545
|
1,948 sq. feet
|
2 baths 3 beds |
show details | |

|
#10
Emerald Lodge Ln
Fresno, TX 77545
|
2,206 sq. feet
|
2 baths 3 beds |
show details |
| Photo | Address | Area | Beds / Baths | Price | Details |
|---|---|---|---|---|---|

|
#11
S Teal Estates Cir
Fresno, TX 77545
|
2,121 sq. feet
|
2 baths 4 beds |
show details | |

|
#12
Buckwood Ct
Fresno, TX 77545
|
2,267 sq. feet
|
2 baths 3 beds |
show details | |

|
#13
Coretta Ct
Fresno, TX 77545
|
3,052 sq. feet
|
2 baths 4 beds |
show details | |

|
#14
Glenmont Ridge Ct
Fresno, TX 77545
|
3,275 sq. feet
|
2 baths 4 beds |
show details | |

|
#15
Travis Creek Way
Fresno, TX 77545
|
3,196 sq. feet
|
3 baths 4 beds |
show details | |

|
#16
Farrel Hill St
Fresno, TX 77545
|
2,420 sq. feet
|
2 baths 4 beds |
show details | |

|
#17
Liberty Square Trl
Fresno, TX 77545
|
2,572 sq. feet
|
2 baths 4 beds |
show details | |

|
#18
Acacia Fair Ln
Fresno, TX 77545
|
3,287 sq. feet
|
2 baths 4 beds |
show details | |

|
#19
Drake Oak St
Fresno, TX 77545
|
2,912 sq. feet
|
2 baths 4 beds |
show details | |

|
#20
Everhart Terrace Dr
Fresno, TX 77545
|
1,759 sq. feet
|
- baths 4 beds |
show details |
| Photo | Address | Area | Beds / Baths | Price | Details |
|---|---|---|---|---|---|

|
#21
Montclair Hill Ln
Fresno, TX 77545
|
2,370 sq. feet
|
- baths 4 beds |
show details | |

|
#22
Hawthorne Brk
Fresno, TX 77545
|
2,678 sq. feet
|
- baths 4 beds |
show details | |

|
#23
Feather Green Trl
Fresno, TX 77545
|
2,294 sq. feet
|
- baths 3 beds |
show details | |

|
#24
Tulip Pond Ct
Fresno, TX 77545
|
2,426 sq. feet
|
- baths 3 beds |
show details | |

|
#25
Balsam Ridge Way
Fresno, TX 77545
|
2,667 sq. feet
|
- baths 4 beds |
show details | |

|
#26
Caldbeck Ln
Fresno, TX 77545
|
1,885 sq. feet
|
- baths 3 beds |
show details | |

|
#27
Hannah Falls Ln
Fresno, TX 77545
|
2,540 sq. feet
|
- baths 4 beds |
show details | |

|
#28
Camden Landing Trl
Fresno, TX 77545
|
2,055 sq. feet
|
- baths 3 beds |
show details | |

|
#29
Long Creek Dr
Fresno, TX 77545
|
2,841 sq. feet
|
- baths 4 beds |
show details | |

|
#30
Monarch Blue Ln
Fresno, TX 77545
|
1,933 sq. feet
|
- baths 3 beds |
show details |
| Photo | Address | Area | Beds / Baths | Price | Details |
|---|---|---|---|---|---|

|
#31
Hawthorne Brook Ln
Fresno, TX 77545
|
2,330 sq. feet
|
- baths 4 beds |
show details | |

|
#32
Hawthorne Brook Ln
Fresno, TX 77545
|
1,550 sq. feet
|
- baths 3 beds |
show details | |

|
#33
Youpon Glen Way
Fresno, TX 77545
|
2,562 sq. feet
|
- baths 4 beds |
show details | |

|
#34
Liberty Square Trl
Fresno, TX 77545
|
- sq. feet
|
- baths - beds |
show details | |

|
#35
S Teal Estates Cir
Fresno, TX 77545
|
1,605 sq. feet
|
- baths - beds |
show details | |

|
#36
Iris Ridge Way
Fresno, TX 77545
|
- sq. feet
|
- baths - beds |
show details | |

|
#37
Alcove Foster Ct
Fresno, TX 77545
|
- sq. feet
|
- baths - beds |
show details | |

|
#38
Vermillion Oak St
Fresno, TX 77545
|
- sq. feet
|
- baths - beds |
show details | |

|
#39
Tavendale Ct
Fresno, TX 77545
|
2,264 sq. feet
|
- baths - beds |
show details | |

|
#40
Elm St
Fresno, TX 77545
|
- sq. feet
|
- baths - beds |
show details |
| Photo | Address | Area | Beds / Baths | Price | Details |
|---|---|---|---|---|---|

|
#41
Emily Vista Ln
Fresno, TX 77545
|
- sq. feet
|
- baths - beds |
show details | |

|
#42
Flowing Azalea Ct
Fresno, TX 77545
|
- sq. feet
|
- baths - beds |
show details | |

|
#43
Rosegale Ct
Fresno, TX 77545
|
- sq. feet
|
- baths - beds |
show details | |

|
#44
Marilyn St
Fresno, TX 77545
|
1,640 sq. feet
|
- baths - beds |
show details | |

|
#45
Liberty Square Trl
Fresno, TX 77545
|
- sq. feet
|
- baths - beds |
show details | |

|
#46
Hurst Green Ln
Fresno, TX 77545
|
- sq. feet
|
- baths - beds |
show details | |

|
#47
Fresh Dawn Dr
Fresno, TX 77545
|
- sq. feet
|
- baths - beds |
show details | |

|
#48
Teal Run Place Dr
Fresno, TX 77545
|
2,692 sq. feet
|
- baths - beds |
show details | |

|
#49
Liberty Sq Trl
Fresno, TX 77545
|
- sq. feet
|
- baths - beds |
show details | |

|
Check over 1 million property listings on Foreclosure.com!
|
browse all offers | |||

Latest news about housing in Fresno, TX collected exclusively by city-data.com from local newspapers, TV, and radio stations

 | Austin housing bubble (171 replies) |
| New Point estates in Fresno (0 replies) |
| Perry Homes in Creekmont (22 replies) |
| Homes close to Med Center (24 replies) |
| BioPort District in TMC (larger than TMC3) (25 replies) |
| Houston Equivalent (57 replies) |

Median year apartment built: 2006
Household type by relationship:
Households: 25,211- Male householders: 3,813 (711 living alone), Female householders: 4,565 (640 living alone)
4,024 spouses (4,024 opposite-sex spouses), 813 unmarried partners, (793 opposite-sex unmarried partners), 8,982 children (8,672 natural, 19 adopted, 290 stepchildren), 185 grandchildren, 627 brothers or sisters, 677 parents, 384 foster children, 792 other relatives, 310 non-relatives
- In group quarters: 33
Size of family households: 2,655 2-persons, 1,729 3-persons, 941 4-persons, 1,251 5-persons, 216 6-persons, 152 7-or-more-persons.
Size of nonfamily households: 1,465 1-person, 140 2-persons, 152 4-persons.
3,004 married couples with children.
1,754 single-parent households (474 men, 1,280 women).
66.7% of residents of Fresno speak English at home.
29.8% of residents speak Spanish at home (57% speak English very well, 21% speak English well, 19% speak English not well, 2% don't speak English at all).
0.4% of residents speak other Indo-European language at home (70% speak English very well, 22% speak English well, 8% speak English not well).
1.1% of residents speak Asian or Pacific Island language at home (19% speak English very well, 70% speak English well, 7% speak English not well, 4% don't speak English at all).
1.5% of residents speak other language at home (86% speak English very well, 10% speak English well, 4% speak English not well).
Foreign born population: 4,185 (16.6%)
(44.1% of them are naturalized citizens)
| Here: | 6.6 |
| State: | 6.3 |
| Here: | 5.4 |
| State: | 4.0 |

- Bedrooms in owner-occupied houses and condos in Fresno, Texas
- 157no bedroom
- 151 bedroom
- 2102 bedrooms
- 3,1583 bedrooms
- 2,7864 bedrooms
- 8325+ bedrooms

- Bedrooms in renter-occupied apartments in Fresno, Texas
- 0no bedroom
- 291 bedroom
- 1262 bedrooms
- 6323 bedrooms
- 5724 bedrooms
- 525+ bedrooms

- Cars and other vehicles available in Fresno in owner-occupied houses/condos
- 12no vehicle
- 1,2661 vehicle
- 3,4532 vehicles
- 1,6273 vehicles
- 5324 vehicles
- 2695+ vehicles

- Cars and other vehicles available in Fresno in renter-occupied apartments
- 80no vehicle
- 4211 vehicle
- 4542 vehicles
- 4443 vehicles
- 144 vehicles
- 05+ vehicles

- Rooms in owner-occupied houses in Fresno, Texas
- 1571 room
- 02 rooms
- 163 rooms
- 5934 rooms
- 9815 rooms
- 1,4436 rooms
- 1,4127 rooms
- 1,2868 rooms
- 1,2699+ rooms

- Rooms in renter-occupied apartments in Fresno, Texas
- 01 room
- 02 rooms
- 293 rooms
- 1404 rooms
- 5565 rooms
- 3406 rooms
- 1617 rooms
- 768 rooms
- 1109+ rooms


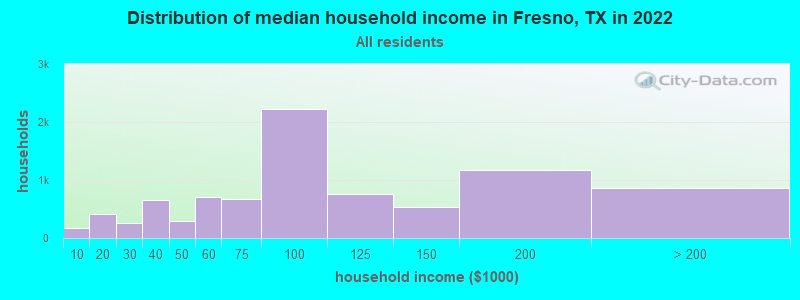
Fresno, TX household income distribution

- 166Less than $10,000
- 418$10,000 to $19,999
- 251$20,000 to $29,999
- 654$30,000 to $39,999
- 285$40,000 to $49,999
- 705$50,000 to $59,999
- 675$60,000 to $74,999
- 2,219$75,000 to $99,999
- 751$100,000 to $124,999
- 542$125,000 to $149,999
- 1,171$150,000 to $199,999
- 866$200,000 or more
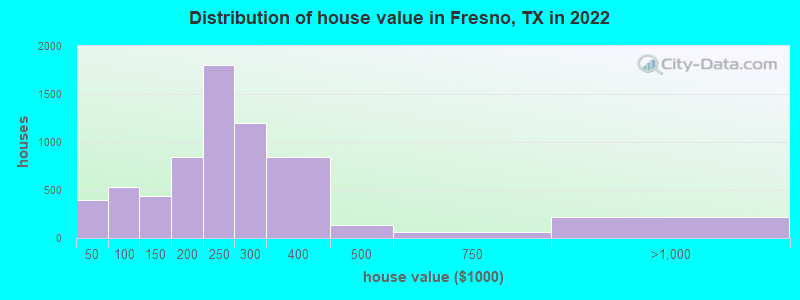
Home value of owner - occupied houses in 2022 in Fresno, TX
-
- 73Less than $10,000
- 116$10,000 to $14,999
- 6$15,000 to $19,999
- 34$20,000 to $24,999
- 73$25,000 to $29,999
- 96$40,000 to $49,999
- 173$50,000 to $59,999
- 8$60,000 to $69,999
- 83$70,000 to $79,999
- 169$80,000 to $89,999
- 371$100,000 to $124,999
- 68$125,000 to $149,999
- 369$150,000 to $174,999
- 476$175,000 to $199,999
- 1,797$200,000 to $249,999
- 1,195$250,000 to $299,999
- 846$300,000 to $399,999
- 132$400,000 to $499,999
- 58$500,000 to $749,999
- 203$750,000 to $999,999
- 15$2,000,000 or more
Rent paid by renters in 2022 in Fresno, TX
-
- 24$350 to $399
- 11$600 to $649
- 10$800 to $899
- 162$900 to $999
- 83$1,000 to $1,249
- 50$1,250 to $1,499
- 699$1,500 to $1,999
- 113$2,000 to $2,499
- 167No cash rent


Percentage of workers working in this county: 45.9%
Number of people working at home: 1,618 (10.8% of all workers)
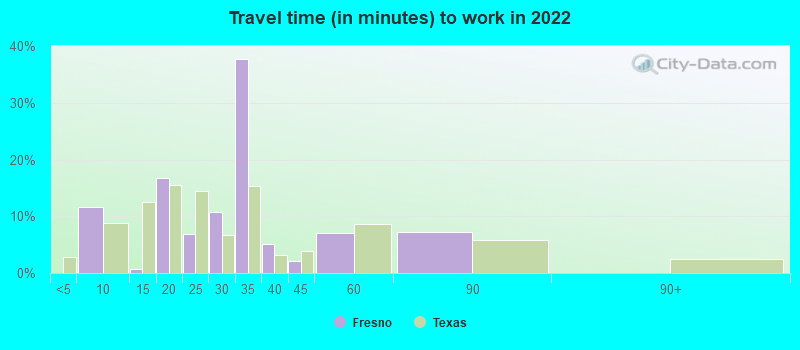
Travel time to work (commute)
- Less than 5 minutes: 0
- 5 to 9 minutes: 646
- 10 to 14 minutes: 479
- 15 to 19 minutes: 1,006
- 20 to 24 minutes: 1,694
- 25 to 29 minutes: 719
- 30 to 34 minutes: 3,284
- 35 to 39 minutes: 739
- 40 to 44 minutes: 946
- 45 to 59 minutes: 2,007
- 60 to 89 minutes: 1,620
- 90 or more minutes: 209
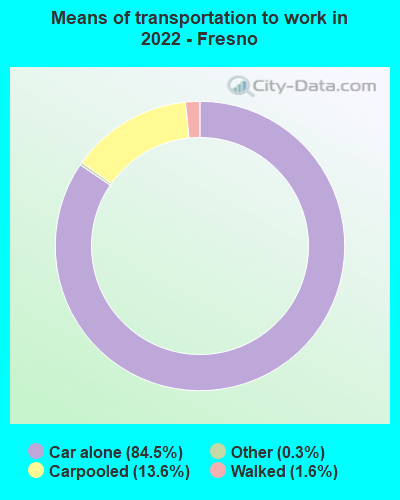
Means of transportation to work:
- Drove a car alone: 1,215 (40.8%)
- Carpooled: 230 (7.7%)
- Taxi: 5 (0.2%)
- Walked: 31 (1.0%)
- Worked at home: 1,618 (54.3%)

- Unemployment by race in 2022
- Unemployment rate for Black residents
- 6.2%Males
- 2.5%Females
- Unemployment rate for Asian residents
- 24.8%Males
- Unemployment rate for other race residents
- 1.0%Males
- Unemployment rate for Hispanic or Latino residents
- 1.2%Males

- Year of entry for the foreign-born population in Fresno, Texas
- 5992010 or later
- 9652000 to 2009
- 1,3241990 to 1999
- 4121980 to 1989
- 3171970 to 1979
- 70Before 1970
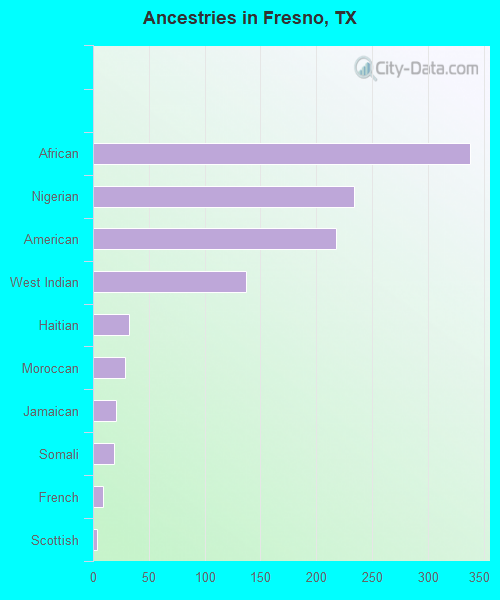
First ancestries reported:
- African: 338 (2.0%)
- Nigerian: 234 (1.4%)
- American: 218 (1.3%)
- West Indian: 137 (0.8%)
- Haitian: 32 (0.2%)
- Moroccan: 29 (0.2%)
- Jamaican: 21 (0.1%)
- Somali: 19 (0.1%)
- French: 9 (0.05%)
- Scottish: 4 (0.02%)
Most common places of birth for foreign-born residents (%):
| Fresno: | 50.4% (2,033) |
| Texas: | 48.4% (2,411,723) |
| Fresno: | 17.0% (686) |
| Texas: | 4.5% (224,455) |
| Fresno: | 10.8% (436) |
| Texas: | 0.0% (2,295) |
| Fresno: | 6.9% (278) |
| Texas: | 1.9% (96,110) |
| Fresno: | 2.7% (108) |
| Texas: | 0.3% (15,368) |
| Fresno: | 2.6% (103) |
| Texas: | 3.0% (147,182) |
| Fresno: | 2.5% (99) |
| Texas: | 0.2% (9,997) |
| Fresno: | 2.1% (84) |
| Texas: | 6.1% (306,347) |
| Fresno: | 1.9% (75) |
| Texas: | 0.2% (9,664) |
Place of birth for U.S.-born residents:
- This state: 15,266
- Other state: 5,579
- Northeast: 323
- Midwest: 725
- South: 3,731
- West: 708
94.1% of Fresno residents lived in the same house 1 years ago.
Out of people who lived in different houses, 17.0% lived in this county.
Out of people who lived in different counties, 95.6% lived in Texas.
| Fresno: | 94.1% |
| State average: | 85.7% |
Education attainment for males 25 years and older:
- No schooling: 352
- Nursery to 4th grade: 48
- 5th and 6th grade: 216
- 7th and 8th grade: 153
- 9th grade: 54
- 10th grade: 107
- 11th grade: 42
- 12th grade, no diploma: 217
- High school graduate (or equivalency): 2,986
- Less than 1 year of college: 479
- Some college more than 1 year, no degree: 848
- Associate degree: 649
- Bachelor's degree: 1,679
- Master's degree: 141
- Professional school degree: 34
- Doctorate degree: 18

Education attainment for females 25 years and older:
- No schooling: 155
- Nursery to 4th grade: 32
- 5th and 6th grade: 133
- 7th and 8th grade: 265
- 9th grade: 150
- 10th grade: 91
- 11th grade: 112
- 12th grade, no diploma: 0
- High school graduate (or equivalency): 2,202
- Less than 1 year of college: 562
- Some college more than 1 year, no degree: 1,189
- Associate degree: 604
- Bachelor's degree: 1,509
- Master's degree: 736
- Professional school degree: 257
- Doctorate degree: 93


Housing units in structures:
- One, detached: 7,816
- One, attached: 61
- 50 or more: 12
- Mobile homes: 1,104
Housing units lacking complete kitchen facilities in 2022: 2.0%
House/condo owner moved in on average 10 years ago
Renter moved in on average 4 years ago

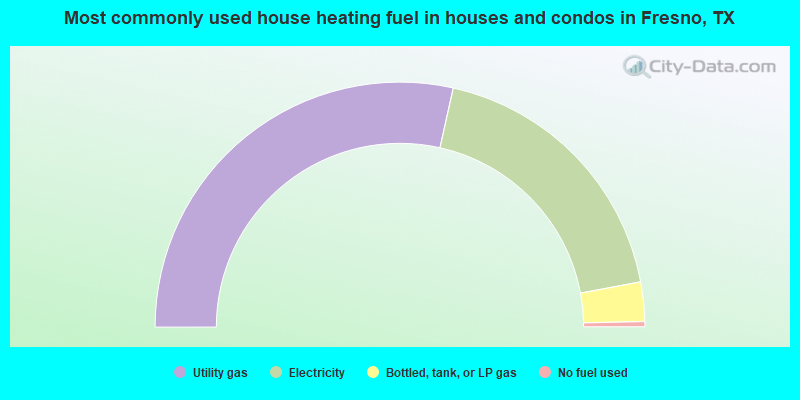
- 57.0%Utility gas
- 37.1%Electricity
- 5.2%Bottled, tank, or LP gas
- 0.7%No fuel used
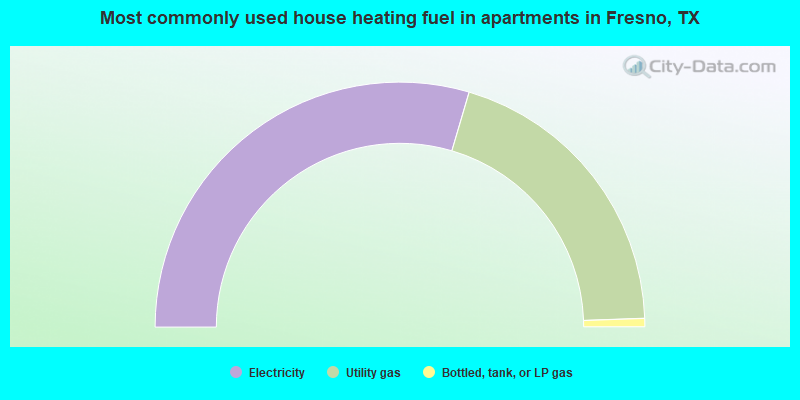
- 59.2%Electricity
- 39.8%Utility gas
- 1.1%Bottled, tank, or LP gas
Private vs. public school enrollment:
| Here: | 0.9% |
| Texas: | 8.8% |
| Here: | 0.0% |
| Texas: | 8.0% |
| Here: | 4.5% |
| Texas: | 16.2% |


