Farmington Hills, MI (Michigan) Houses and Residents
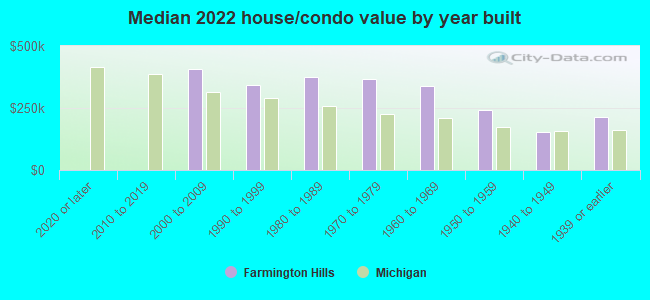
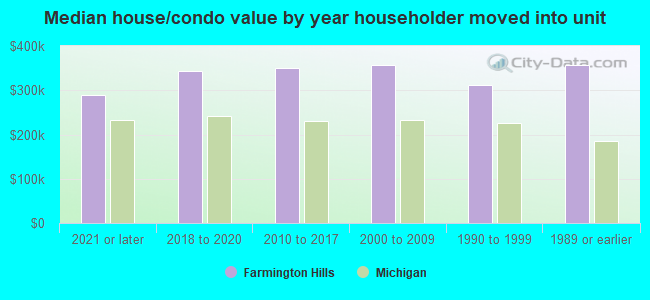
| Farmington Hills: | $340,300 |
| Michigan: | $224,400 |
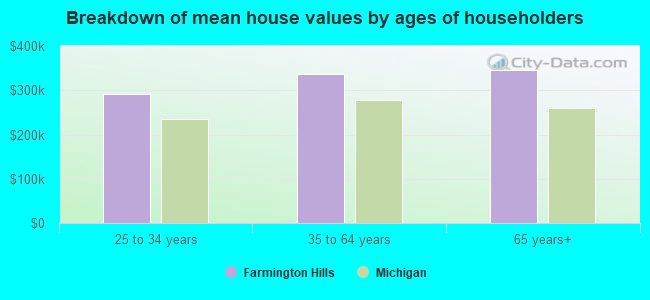
Mean price in 2022:
Detached houses: $343,726
Here: $343,726 State: $280,038 Townhouses or other attached units: $416,607
Here: $416,607 State: $239,520 In 3-to-4-unit structures: $220,997
Here: $220,997 State: $207,067 In 5-or-more-unit structures: $103,637
Here: $103,637 State: $192,733 Mobile homes: $16,899
Here: $16,899 State: $72,868
Total population: 81,435 (All urban)
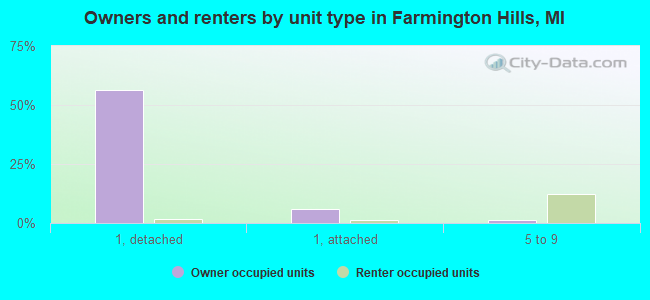
Houses: 37,241 (34,498 occupied: 22,871 owner occupied, 11,627 renter occupied)
| % of renters here: | 34% |
| State: | 27% |
Housing density: 1,119 houses/condos per square mile
Median price asked for vacant for-sale houses and condos in 2022: $344,969.
Median contract rent in 2022: $1,324 (lower quartile is $1,012, upper quartile is $1,646)
Median rent asked for vacant for-rent units in 2022: $2,453
Median gross rent in Farmington Hills, MI in 2022: $1,461
Housing units in Farmington Hills with a mortgage: 14,771 (1,241 second mortgage, 0 home equity loan, 1,241 both second mortgage and home equity loan)
Houses without a mortgage: 673
Median household income for houses/condos with a mortgage: $137,005
Median household income for apartments without a mortgage: $85,163
Median monthly housing costs: $1,461
Compare current foreclosures near Farmington Hills, MI:
| Photo | Address | Area | Beds / Baths | Price | Details |
|---|---|---|---|---|---|

|
#1
Hartwell St
Detroit, MI 48227
|
1,135 sq. feet
|
1 baths 3 beds |
$10,000
|
show details |

|
#2
Littlefield St
Detroit, MI 48227
|
1,110 sq. feet
|
1 baths 3 beds |
$50,000
|
show details |

|
#3
Hubbell St
Detroit, MI 48235
|
2,305 sq. feet
|
2 baths 4 beds |
$72,800
|
show details |

|
#4
Conley St
Detroit, MI 48234
|
2,035 sq. feet
|
1 baths 3 beds |
$49,900
|
show details |

|
#5
Cicotte Ave
Allen Park, MI 48101
|
1,784 sq. feet
|
2 baths 4 beds |
$238,500
|
show details |

|
#6
Wildemere St
Detroit, MI 48221
|
2,751 sq. feet
|
3 baths 5 beds |
$466,500
|
show details |

|
#7
Kentfield St
Detroit, MI 48219
|
1,913 sq. feet
|
2 baths 5 beds |
$74,900
|
show details |

|
#8
Glastonbury Rd
Detroit, MI 48219
|
1,717 sq. feet
|
1 baths 3 beds |
$130,000
|
show details |

|
#9
Montrose St
Detroit, MI 48227
|
840 sq. feet
|
1 baths 3 beds |
$18,700
|
show details |

|
#10
Manhattan St
Oak Park, MI 48237
|
1,336 sq. feet
|
1 baths 3 beds |
$295,000
|
show details |
| Photo | Address | Area | Beds / Baths | Price | Details |
|---|---|---|---|---|---|

|
#11
Helen St
Garden City, MI 48135
|
960 sq. feet
|
1 baths 3 beds |
$199,900
|
show details |

|
#12
Ardmore St
Detroit, MI 48235
|
1,080 sq. feet
|
1 baths 3 beds |
$159,000
|
show details |

|
#13
Venoy Rd
Wayne, MI 48184
|
986 sq. feet
|
1 baths 3 beds |
$120,900
|
show details |

|
#14
Hartwell St
Detroit, MI 48228
|
1,482 sq. feet
|
1 baths 3 beds |
$169,500
|
show details |

|
#15
Ashton Rd
Detroit, MI 48223
|
1,621 sq. feet
|
1 baths 3 beds |
$233,500
|
show details |

|
#16
Oak Hill Dr # 59
Waterford, MI 48329
|
1,024 sq. feet
|
1 baths 1 beds |
$152,500
|
show details |

|
#17
Montrose St
Detroit, MI 48227
|
1,310 sq. feet
|
1 baths 3 beds |
$95,500
|
show details |

|
#18
Roselawn St
Detroit, MI 48204
|
1,368 sq. feet
|
2 baths 4 beds |
$47,900
|
show details |

|
#19
Blackstone St
Detroit, MI 48219
|
996 sq. feet
|
1 baths 3 beds |
$111,500
|
show details |

|
#20
Desoto St
Detroit, MI 48238
|
1,500 sq. feet
|
1 baths 3 beds |
$61,250
|
show details |
| Photo | Address | Area | Beds / Baths | Price | Details |
|---|---|---|---|---|---|

|
#21
Sussex St
Detroit, MI 48235
|
901 sq. feet
|
1 baths 3 beds |
$151,500
|
show details |

|
#22
Collingwood St
Detroit, MI 48206
|
1,424 sq. feet
|
1 baths - beds |
$19,900
|
show details |

|
#23
Harbor Oak Dr
Waterford, MI 48329
|
1,331 sq. feet
|
3 baths 2 beds |
show details | |

|
#24
Danbury St
Highland Park, MI 48203
|
728 sq. feet
|
1 baths - beds |
$14,900
|
show details |

|
#25
Parkcrest Dr
Waterford, MI 48327
|
1,319 sq. feet
|
2 baths 2 beds |
show details | |

|
#26
Fenton St
Dearborn Heights, MI 48127
|
2,475 sq. feet
|
4 baths 4 beds |
show details | |

|
#27
Coyle St
Detroit, MI 48235
|
1,383 sq. feet
|
1 baths 3 beds |
show details | |

|
#28
Muirland St
Detroit, MI 48221
|
- sq. feet
|
3 baths 6 beds |
show details | |

|
#29
Mount Vernon St
Southfield, MI 48075
|
1,742 sq. feet
|
2 baths 3 beds |
show details | |

|
#30
Vinewood St
Romulus, MI 48174
|
1,848 sq. feet
|
2 baths 3 beds |
show details |
| Photo | Address | Area | Beds / Baths | Price | Details |
|---|---|---|---|---|---|

|
#31
Berg Rd
Detroit, MI 48219
|
1,095 sq. feet
|
1 baths 3 beds |
show details | |

|
#32
Edinburgh St
Southfield, MI 48033
|
2,132 sq. feet
|
1 baths 3 beds |
show details | |

|
#33
Harned St
Detroit, MI 48234
|
928 sq. feet
|
1 baths 3 beds |
show details | |

|
#34
Woodland
White Lake, MI 48383
|
1,120 sq. feet
|
2 baths 2 beds |
show details | |

|
#35
Edison St
Detroit, MI 48202
|
6,027 sq. feet
|
4 baths 6 beds |
show details | |

|
#36
W Hazelhurst St
Ferndale, MI 48220
|
2,112 sq. feet
|
2 baths 3 beds |
show details | |

|
#37
Wakenden
Redford, MI 48240
|
- sq. feet
|
2 baths 3 beds |
show details | |

|
#38
Glastonbury Ave
Detroit, MI 48223
|
1,884 sq. feet
|
1 baths 3 beds |
show details | |

|
#39
Brompton Ct
West Bloomfield, MI 48322
|
2,100 sq. feet
|
3 baths 4 beds |
show details | |

|
#40
Piedmont St
Detroit, MI 48228
|
1,885 sq. feet
|
1 baths 3 beds |
show details |
| Photo | Address | Area | Beds / Baths | Price | Details |
|---|---|---|---|---|---|

|
#41
Brompton Ct
West Bloomfield, MI 48322
|
2,048 sq. feet
|
2 baths 4 beds |
show details | |

|
#42
Huntington Park Dr
Waterford, MI 48329
|
1,291 sq. feet
|
1 baths 3 beds |
show details | |

|
#43
Academy St
Dearborn, MI 48124
|
1,118 sq. feet
|
2 baths 3 beds |
show details | |

|
#44
Hemingway
Redford, MI 48239
|
1,095 sq. feet
|
1 baths 3 beds |
show details | |

|
#45
Maplebrooke Dr
Southfield, MI 48033
|
1,856 sq. feet
|
2 baths 3 beds |
show details | |

|
#46
Pinehurst St
Detroit, MI 48221
|
1,587 sq. feet
|
1 baths 3 beds |
show details | |

|
#47
Kinloch
Redford, MI 48239
|
1,311 sq. feet
|
1 baths 3 beds |
show details | |

|
#48
Rodeo Ct
Southfield, MI 48075
|
1,078 sq. feet
|
2 baths 2 beds |
show details | |

|
#49
Gilchrist St
Detroit, MI 48227
|
3,018 sq. feet
|
2 baths 3 beds |
show details | |

|
Check over 1 million property listings on Foreclosure.com!
|
browse all offers | |||


Median year apartment built: 1981
Household type by relationship:
Households: 82,738- Male householders: 19,295 (5,126 living alone), Female householders: 15,203 (4,429 living alone)
17,273 spouses (17,189 opposite-sex spouses), 1,989 unmarried partners, (1,956 opposite-sex unmarried partners), 22,036 children (20,745 natural, 536 adopted, 755 stepchildren), 1,118 grandchildren, 346 brothers or sisters, 1,292 parents, 96 foster children, 1,201 other relatives, 1,979 non-relatives
- In group quarters: 910
Size of family households: 11,002 2-persons, 6,176 3-persons, 3,095 4-persons, 1,362 5-persons, 727 6-persons, 73 7-or-more-persons.
Size of nonfamily households: 9,555 1-person, 2,286 2-persons, 140 3-persons, 82 7-or-more-persons.
10,695 married couples with children.
2,927 single-parent households (561 men, 2,366 women).
76.4% of residents of Farmington Hills speak English at home.
1.4% of residents speak Spanish at home (65% speak English very well, 8% speak English well, 2% speak English not well, 25% don't speak English at all).
10.0% of residents speak other Indo-European language at home (81% speak English very well, 12% speak English well, 5% speak English not well, 2% don't speak English at all).
6.3% of residents speak Asian or Pacific Island language at home (68% speak English very well, 27% speak English well, 5% speak English not well).
6.0% of residents speak other language at home (71% speak English very well, 17% speak English well, 10% speak English not well, 2% don't speak English at all).
Foreign born population: 17,540 (21.2%)
(46.6% of them are naturalized citizens)
| Here: | 7.1 |
| State: | 6.5 |
| Here: | 4.1 |
| State: | 4.3 |
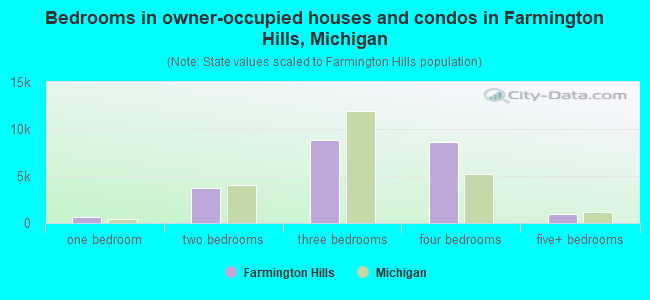
- Bedrooms in owner-occupied houses and condos in Farmington Hills, Michigan
- 0no bedroom
- 6891 bedroom
- 3,7342 bedrooms
- 8,8343 bedrooms
- 8,6214 bedrooms
- 9935+ bedrooms
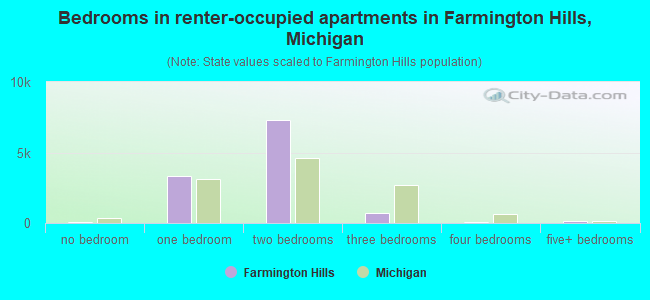
- Bedrooms in renter-occupied apartments in Farmington Hills, Michigan
- 90no bedroom
- 3,3321 bedroom
- 7,2962 bedrooms
- 7083 bedrooms
- 464 bedrooms
- 1555+ bedrooms
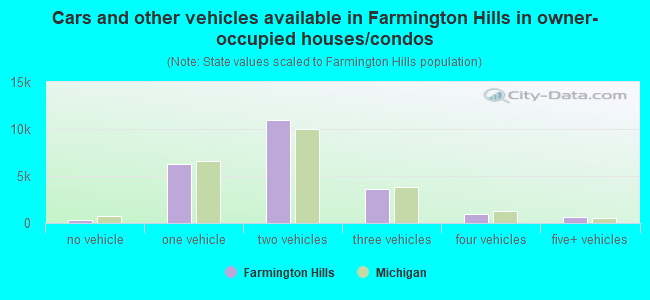
- Cars and other vehicles available in Farmington Hills in owner-occupied houses/condos
- 327no vehicle
- 6,3111 vehicle
- 10,9742 vehicles
- 3,6443 vehicles
- 9934 vehicles
- 6225+ vehicles
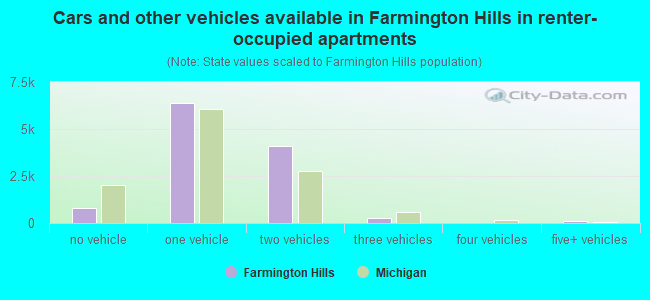
- Cars and other vehicles available in Farmington Hills in renter-occupied apartments
- 776no vehicle
- 6,3871 vehicle
- 4,0972 vehicles
- 2853 vehicles
- 04 vehicles
- 825+ vehicles
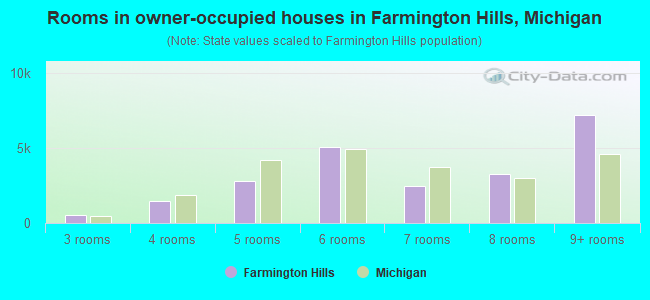
- Rooms in owner-occupied houses in Farmington Hills, Michigan
- 01 room
- 02 rooms
- 5623 rooms
- 1,4454 rooms
- 2,7955 rooms
- 5,0806 rooms
- 2,4667 rooms
- 3,3038 rooms
- 7,2209+ rooms
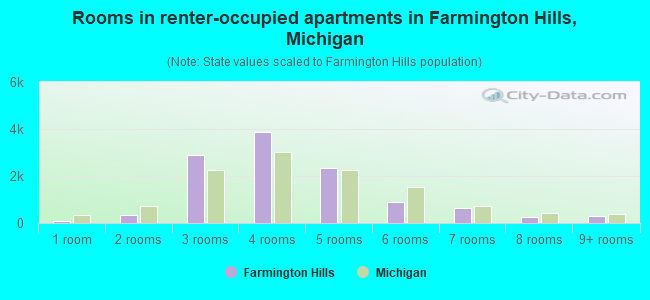
- Rooms in renter-occupied apartments in Farmington Hills, Michigan
- 901 room
- 3452 rooms
- 2,8733 rooms
- 3,8854 rooms
- 2,3505 rooms
- 9116 rooms
- 6327 rooms
- 2488 rooms
- 2939+ rooms
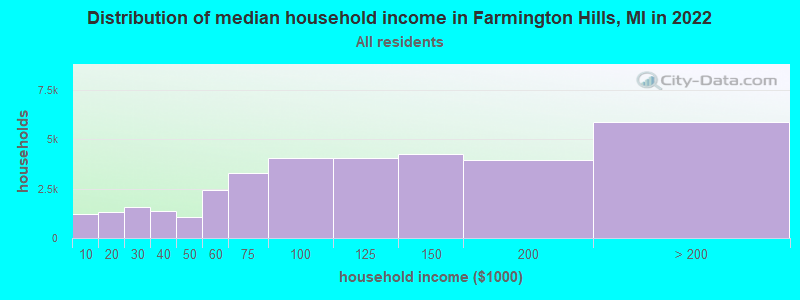
Farmington Hills, MI household income distribution

- 1,236Less than $10,000
- 1,321$10,000 to $19,999
- 1,562$20,000 to $29,999
- 1,356$30,000 to $39,999
- 1,075$40,000 to $49,999
- 2,434$50,000 to $59,999
- 3,283$60,000 to $74,999
- 4,045$75,000 to $99,999
- 4,060$100,000 to $124,999
- 4,282$125,000 to $149,999
- 3,964$150,000 to $199,999
- 5,880$200,000 or more
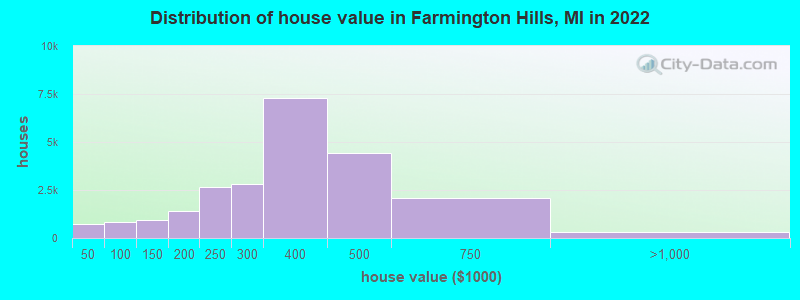
Home value of owner - occupied houses in 2022 in Farmington Hills, MI
-
- 199Less than $10,000
- 152$10,000 to $14,999
- 29$15,000 to $19,999
- 52$20,000 to $24,999
- 11$25,000 to $29,999
- 92$30,000 to $34,999
- 24$35,000 to $39,999
- 143$40,000 to $49,999
- 150$50,000 to $59,999
- 230$60,000 to $69,999
- 102$70,000 to $79,999
- 188$80,000 to $89,999
- 16$90,000 to $99,999
- 439$100,000 to $124,999
- 503$125,000 to $149,999
- 734$150,000 to $174,999
- 659$175,000 to $199,999
- 2,656$200,000 to $249,999
- 2,788$250,000 to $299,999
- 7,309$300,000 to $399,999
- 4,426$400,000 to $499,999
- 2,098$500,000 to $749,999
- 176$750,000 to $999,999
- 61$1,000,000 to $1,499,999
- 16$1,500,000 to $1,999,999
- 49$2,000,000 or more
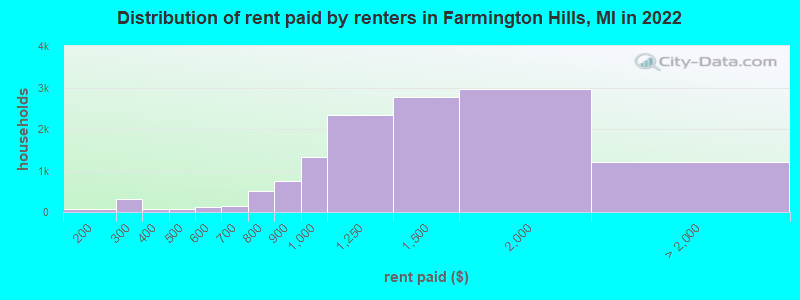
Rent paid by renters in 2022 in Farmington Hills, MI
-
- 54$100 to $149
- 25$150 to $199
- 236$200 to $249
- 72$250 to $299
- 57$300 to $349
- 12$350 to $399
- 43$400 to $449
- 29$450 to $499
- 62$500 to $549
- 65$550 to $599
- 90$600 to $649
- 47$650 to $699
- 139$700 to $749
- 360$750 to $799
- 740$800 to $899
- 1,330$900 to $999
- 2,345$1,000 to $1,249
- 2,773$1,250 to $1,499
- 2,964$1,500 to $1,999
- 278$2,000 to $2,499
- 385$2,500 to $2,999
- 64$3,000 to $3,499
- 58$3,500 or more
- 414No cash rent
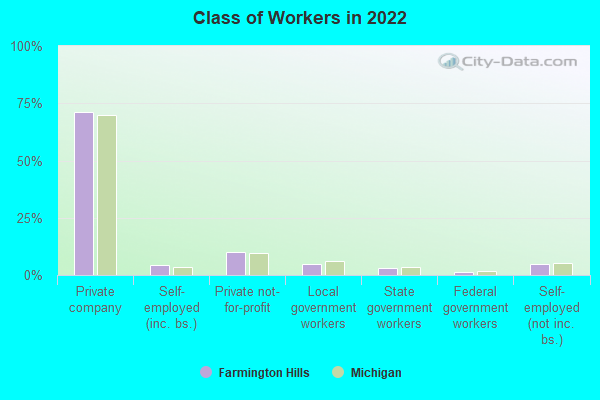
Percentage of workers working in this county: 69.3%
Number of people working at home: 10,803 (23.7% of all workers)
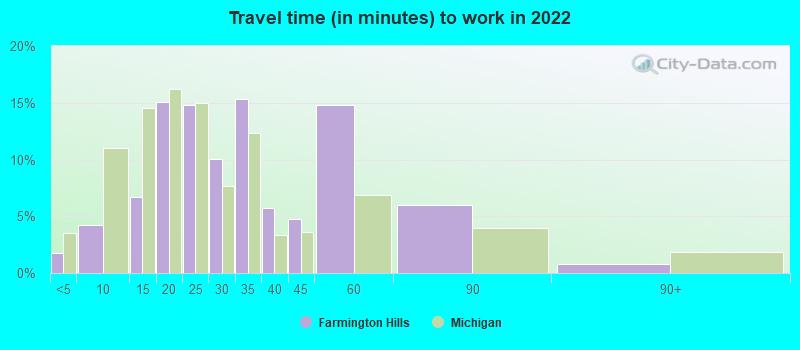
Travel time to work (commute)
- Less than 5 minutes: 558
- 5 to 9 minutes: 2,455
- 10 to 14 minutes: 3,112
- 15 to 19 minutes: 5,199
- 20 to 24 minutes: 4,680
- 25 to 29 minutes: 2,780
- 30 to 34 minutes: 5,892
- 35 to 39 minutes: 1,071
- 40 to 44 minutes: 1,690
- 45 to 59 minutes: 1,422
- 60 to 89 minutes: 989
- 90 or more minutes: 833
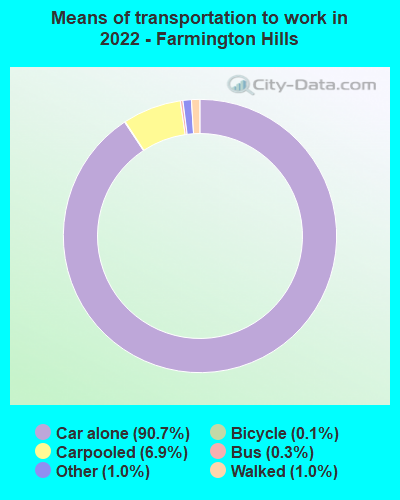
Means of transportation to work:
- Drove a car alone: 37,807 (72.3%)
- Carpooled: 2,773 (5.3%)
- Bus: 64 (0.1%)
- Subway or elevated rail: 7 (0.0%)
- Taxi: 534 (1.0%)
- Bicycle: 81 (0.2%)
- Walked: 501 (1.0%)
- Worked at home: 10,803 (20.7%)
- Unemployment by race in 2022
- Unemployment rate for White non-Hispanic residents
- 4.4%Males
- 2.1%Females
- Unemployment rate for Black residents
- 7.6%Males
- 6.2%Females
- Unemployment rate for American Indian and Alaska Native residents
- 2.9%Males
- Unemployment rate for Asian residents
- 0.6%Males
- 7.4%Females
- Unemployment rate for other race residents
- 17.4%Males
- 16.3%Females
- Unemployment rate for two or more race residents
- 7.9%Males
- 0.6%Females
- Unemployment rate for Hispanic or Latino residents
- 4.8%Males
- 7.1%Females
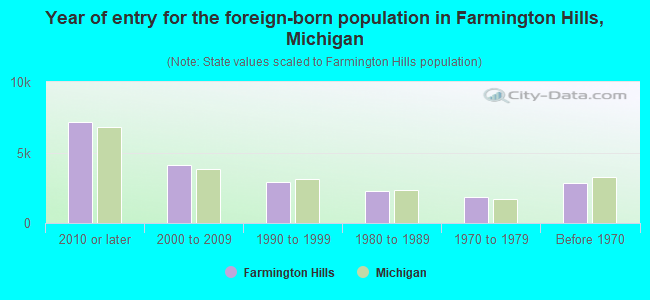
- Year of entry for the foreign-born population in Farmington Hills, Michigan
- 7,1772010 or later
- 4,1202000 to 2009
- 2,8771990 to 1999
- 2,2751980 to 1989
- 1,8741970 to 1979
- 2,824Before 1970
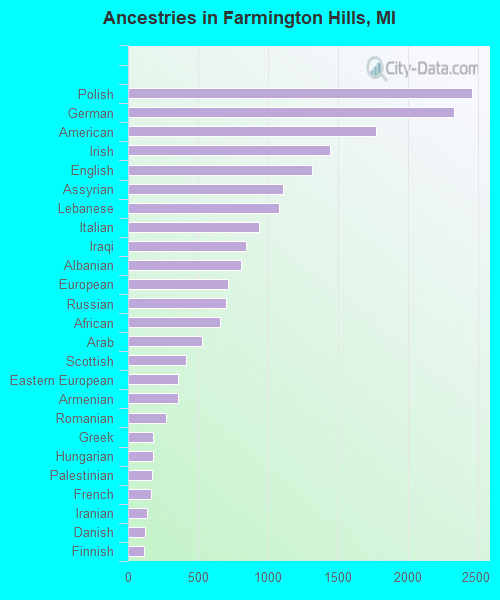
First ancestries reported:
- Polish: 2,457 (5.5%)
- German: 2,328 (5.2%)
- American: 1,773 (3.9%)
- Irish: 1,441 (3.2%)
- English: 1,318 (2.9%)
- Assyrian: 1,108 (2.5%)
- Lebanese: 1,082 (2.4%)
- Italian: 937 (2.1%)
- Iraqi: 841 (1.9%)
- Albanian: 810 (1.8%)
- European: 717 (1.6%)
- Russian: 698 (1.5%)
- African: 656 (1.5%)
- Arab: 526 (1.2%)
- Scottish: 413 (0.9%)
- Eastern European: 357 (0.8%)
- Armenian: 354 (0.8%)
- Romanian: 273 (0.6%)
- Greek: 179 (0.4%)
- Hungarian: 178 (0.4%)
- Palestinian: 170 (0.4%)
- French: 161 (0.4%)
- Iranian: 137 (0.3%)
- Danish: 118 (0.3%)
- Finnish: 117 (0.3%)
- Dutch: 114 (0.3%)
- Yugoslavian: 109 (0.2%)
- Canadian: 105 (0.2%)
- Czech: 91 (0.2%)
- Slovak: 87 (0.2%)
- Nigerian: 86 (0.2%)
- Ukrainian: 84 (0.2%)
- French Canadian: 78 (0.2%)
- Macedonian: 72 (0.2%)
- Scotch-Irish: 58 (0.1%)
- Haitian: 58 (0.1%)
- British: 56 (0.1%)
- Egyptian: 56 (0.1%)
- Syrian: 55 (0.1%)
- Austrian: 53 (0.1%)
- Moroccan: 50 (0.1%)
- Jamaican: 47 (0.1%)
- Israeli: 46 (0.1%)
- Swedish: 45 (0.10%)
- Welsh: 41 (0.09%)
- Ugandan: 37 (0.08%)
- Northern European: 36 (0.08%)
- Brazilian: 33 (0.07%)
- Serbian: 33 (0.07%)
- Jordanian: 30 (0.07%)
- Croatian: 29 (0.06%)
- Norwegian: 28 (0.06%)
- Lithuanian: 28 (0.06%)
- South African: 27 (0.06%)
- Trinidadian and Tobagonian: 25 (0.06%)
- Maltese: 24 (0.05%)
- Scandinavian: 23 (0.05%)
- Belgian: 22 (0.05%)
- Ethiopian: 20 (0.04%)
- Bulgarian: 19 (0.04%)
- West Indian: 19 (0.04%)
- Slavic: 18 (0.04%)
- Turkish: 16 (0.04%)
- Sudanese: 11 (0.02%)
- Swiss: 10 (0.02%)
- Portuguese: 6 (0.01%)
- Belizean: 4 (0.01%)
Most common places of birth for foreign-born residents (%):
| Farmington Hills: | 38.4% (6,574) |
| Michigan: | 11.1% (77,240) |
| Farmington Hills: | 12.0% (2,057) |
| Michigan: | 8.1% (55,954) |
| Farmington Hills: | 4.8% (827) |
| Michigan: | 3.7% (25,634) |
| Farmington Hills: | 3.2% (546) |
| Michigan: | 5.0% (35,052) |
| Farmington Hills: | 2.9% (493) |
| Michigan: | 1.5% (10,225) |
| Farmington Hills: | 2.6% (448) |
| Michigan: | 2.8% (19,112) |
| Farmington Hills: | 2.4% (419) |
| Michigan: | 10.9% (75,965) |
| Farmington Hills: | 1.9% (332) |
| Michigan: | 3.0% (20,884) |
| Farmington Hills: | 1.7% (299) |
| Michigan: | 0.9% (6,326) |
| Farmington Hills: | 1.7% (289) |
| Michigan: | 4.9% (34,295) |
Place of birth for U.S.-born residents:
- This state: 52,847
- Other state: 11,255
- Northeast: 2,113
- Midwest: 3,653
- South: 3,626
- West: 1,863
87.8% of Farmington Hills residents lived in the same house 1 years ago.
Out of people who lived in different houses, 36.5% lived in this county.
Out of people who lived in different counties, 63.4% lived in Michigan.
| Farmington Hills: | 87.8% |
| State average: | 88.4% |
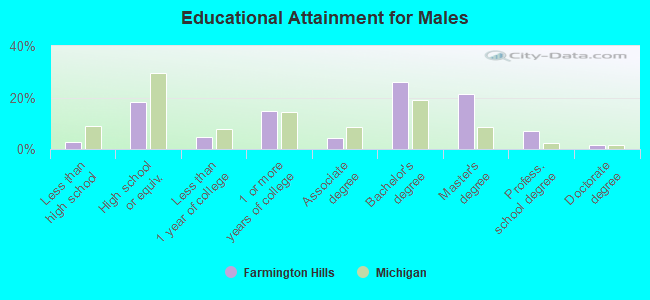
Education attainment for males 25 years and older:
- No schooling: 89
- Nursery to 4th grade: 0
- 5th and 6th grade: 292
- 7th and 8th grade: 0
- 9th grade: 169
- 10th grade: 104
- 11th grade: 196
- 12th grade, no diploma: 0
- High school graduate (or equivalency): 5,471
- Less than 1 year of college: 1,344
- Some college more than 1 year, no degree: 4,418
- Associate degree: 1,257
- Bachelor's degree: 7,831
- Master's degree: 6,407
- Professional school degree: 2,076
- Doctorate degree: 437
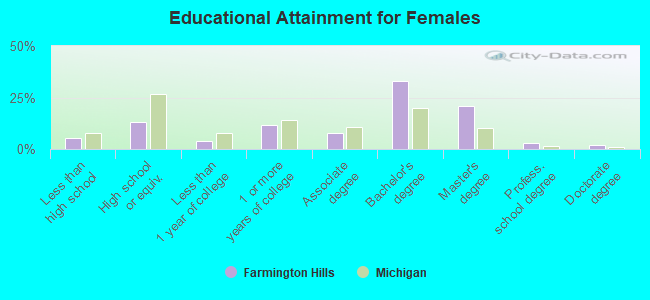
Education attainment for females 25 years and older:
- No schooling: 150
- Nursery to 4th grade: 0
- 5th and 6th grade: 0
- 7th and 8th grade: 360
- 9th grade: 114
- 10th grade: 254
- 11th grade: 372
- 12th grade, no diploma: 430
- High school graduate (or equivalency): 4,061
- Less than 1 year of college: 1,197
- Some college more than 1 year, no degree: 3,603
- Associate degree: 2,337
- Bachelor's degree: 10,229
- Master's degree: 6,425
- Professional school degree: 918
- Doctorate degree: 597


Housing units in structures:
- One, detached: 20,862
- One, attached: 2,752
- Two: 1,270
- 3 or 4: 1,256
- 5 to 9: 5,072
- 10 to 19: 3,514
- 20 to 49: 587
- 50 or more: 1,504
- Mobile homes: 424
Median worth of mobile homes: $18,500
Housing units lacking complete kitchen facilities in 2022: 1.0%
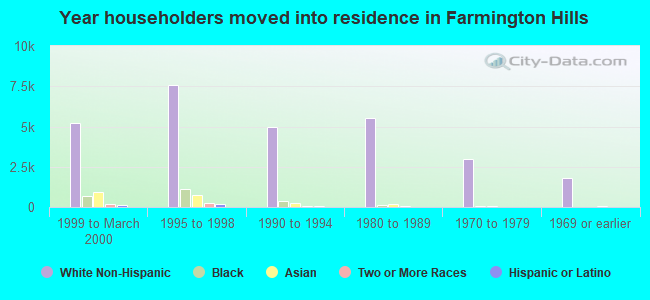
House/condo owner moved in on average 14 years ago
Renter moved in on average 2 years ago
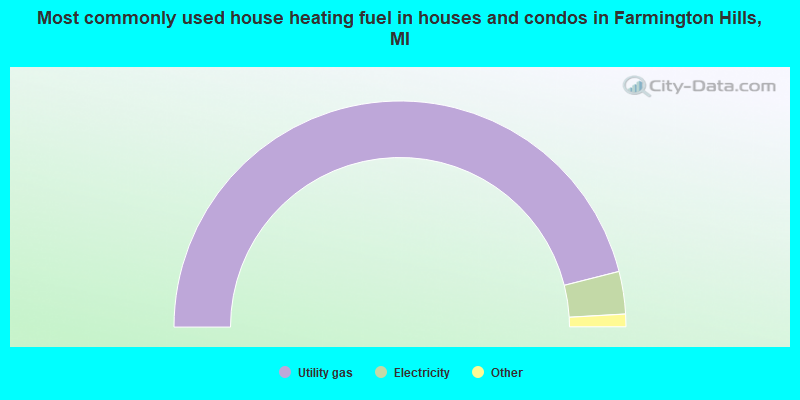
- 92.1%Utility gas
- 6.1%Electricity
- 0.8%Bottled, tank, or LP gas
- 0.4%Wood
- 0.2%No fuel used
- 0.2%Other fuel
- 0.1%Fuel oil, kerosene, etc.
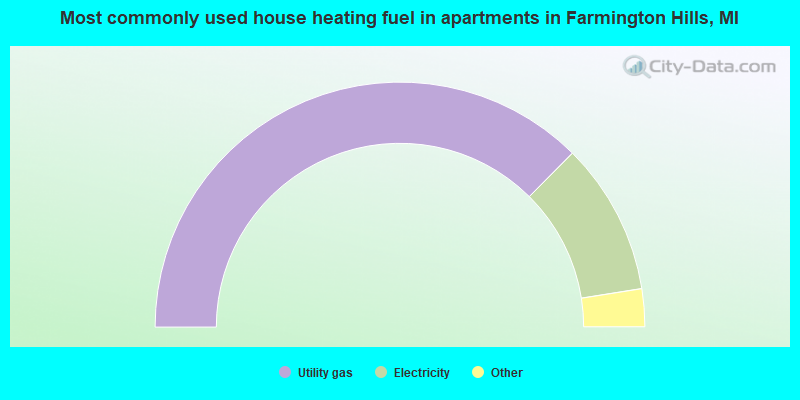
- 74.9%Utility gas
- 20.1%Electricity
- 2.1%Other fuel
- 1.7%Bottled, tank, or LP gas
- 0.7%No fuel used
- 0.2%Fuel oil, kerosene, etc.
- 0.2%Wood
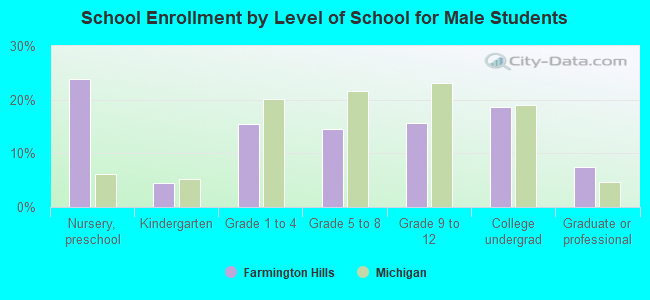
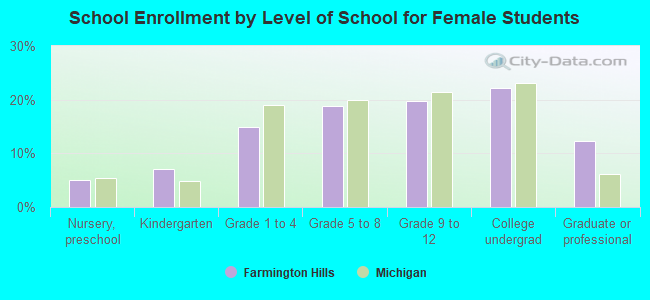
Private vs. public school enrollment:
| Here: | 20.9% |
| Michigan: | 12.4% |
| Here: | 15.4% |
| Michigan: | 9.8% |
| Here: | 20.3% |
| Michigan: | 14.9% |