Housing density: 877 houses/condos per square mile
Median price asked for vacant for-sale houses and condos in 2022 in this county: $1,279,555.
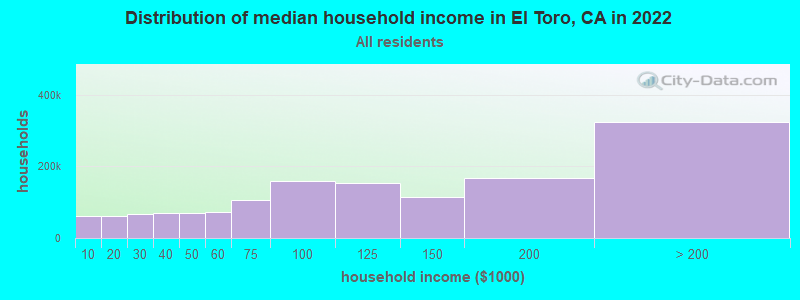
Median contract rent in 2022: over $2,000 (lower quartile is over $2,000, upper quartile is over $2,000)
Median rent asked for vacant for-rent units in 2022: $3,378
Median gross rent in El Toro, CA in 2022: over $2,000
Housing units in El Toro with a mortgage: 33,957 (4,895 second mortgage, 3,730 home equity loan, 154 both second mortgage and home equity loan) Houses without a mortgage: 2,867
In family households: 2,574,637 (510,612 male householders, 197,879 female householders)
538,268 spouses, 917,395 children (868,578 natural, 16,498 adopted, 32,319 stepchildren), 67,543 grandchildren, 54,495 brothers or sisters, 47,670 parents, foster children, 85,984 other relatives, 117,563 non-relatives
In nonfamily households: 396,359 (130,596 male householders (87,348 living alone)), 153,694 female householders (120,501 living alone)), 112,069 nonrelatives
In group quarters: 39,236 (14,531 institutionalized population)
546,370 married couples with children.
125,951 single-parent households (34,925 men, 91,026 women).
66.3% of residents of El Toro speak English at home.
7.4% of residents speak Spanish at home (65% speak English very well, 18% speak English well, 13% speak English not well, 4% don't speak English at all).
8.1% of residents speak other Indo-European language at home (71% speak English very well, 20% speak English well, 7% speak English not well, 2% don't speak English at all).
17.1% of residents speak Asian or Pacific Island language at home (52% speak English very well, 30% speak English well, 16% speak English not well, 2% don't speak English at all).
1.0% of residents speak other language at home (69% speak English very well, 21% speak English well, 9% speak English not well, 1% don't speak English at all).
Foreign born population: 51,878 (27.1%)
(78.1% of them are naturalized citizens)
Percentage of workers working in this county: 92.1% Number of people working at home: 19,515 (17.8% of all workers)
Travel time to work (commute)
Less than 5 minutes: 1,141
5 to 9 minutes: 6,198
10 to 14 minutes: 13,625
15 to 19 minutes: 16,345
20 to 24 minutes: 14,993
25 to 29 minutes: 5,563
30 to 34 minutes: 12,144
35 to 39 minutes: 2,153
40 to 44 minutes: 2,858
45 to 59 minutes: 5,171
60 to 89 minutes: 4,453
90 or more minutes: 1,944
Means of transportation to work:
Drove a car alone: 75,760 (83.4%)
Carpooled: 8,785 (9.7%)
Bus or trolley bus: 481 (0.5%)
Streetcar or trolley car: 26 (0.0%)
Subway or elevated: 13 (0.0%)
Railroad: 192 (0.2%)
Taxi: 8 (0.0%)
Motorcycle: 210 (0.2%)
Bicycle: 282 (0.3%)
Walked: 513 (0.6%)
Other means: 318 (0.3%)
Worked at home: 4,277 (4.7%)
Year of entry for the foreign-born population in El Toro, California
9,2221995 to March 2000
7,0861990 to 1994
7,4651985 to 1989
7,5671980 to 1984
7,3201975 to 1979
3,1231970 to 1974
1,8991965 to 1969
2,579Before 1965
Most common places of birth for foreign-born residents (%):
Korea
El Toro:
11.2% (5,163)
California:
3.0% (268,452)
Iran
El Toro:
9.3% (4,305)
California:
1.8% (158,613)
Vietnam
El Toro:
8.8% (4,066)
California:
4.7% (418,249)
Taiwan
El Toro:
8.8% (4,065)
California:
1.7% (151,775)
Mexico
El Toro:
7.8% (3,629)
California:
44.3% (3,928,701)
Japan
El Toro:
6.2% (2,855)
California:
1.3% (112,212)
India
El Toro:
5.6% (2,605)
California:
2.2% (198,201)
Philippines
El Toro:
5.1% (2,377)
California:
7.5% (664,935)
China, excluding Hong Kong and Taiwan
El Toro:
4.7% (2,181)
California:
3.7% (327,611)
Canada
El Toro:
3.1% (1,414)
California:
1.6% (141,181)
United Kingdom
El Toro:
2.3% (1,060)
California:
1.5% (133,090)
Afghanistan
El Toro:
2.1% (969)
California:
0.2% (20,530)
South Africa
El Toro:
1.7% (769)
California:
0.2% (14,359)
Place of birth for U.S.-born residents:
This state: 76,885
Other state: 48,073
Northeast: 12,568
Midwest: 18,152
South: 9,335
West: 8,018
46% of El Toro residents lived in the same house 5 years ago. Out of people who lived in different houses, 64% lived in this county. Out of people who lived in different counties, 62% lived in California.
Education attainment for males 25 years and older:
No schooling: 304
Nursery to 4th grade: 100
5th and 6th grade: 337
7th and 8th grade: 273
9th grade: 271
10th grade: 387
11th grade: 397
12th grade, no diploma: 912
High school graduate (or equivalency): 5,190
Less than 1 year of college: 2,373
Some college more than 1 year, no degree: 8,541
Associate degree: 4,354
Bachelor's degree: 18,512
Master's degree: 7,590
Professional school degree: 2,556
Doctorate degree: 1,679
Education attainment for females 25 years and older:
No schooling: 394
Nursery to 4th grade: 156
5th and 6th grade: 555
7th and 8th grade: 428
9th grade: 410
10th grade: 305
11th grade: 337
12th grade, no diploma: 1,404
High school graduate (or equivalency): 8,718
Less than 1 year of college: 4,086
Some college more than 1 year, no degree: 10,300
Associate degree: 6,203
Bachelor's degree: 17,967
Master's degree: 5,470
Professional school degree: 1,656
Doctorate degree: 632
Housing units in structures:
One, detached: 32,161
One, attached: 13,039
Two: 405
3 or 4: 3,438
5 to 9: 5,898
10 to 19: 2,383
20 to 49: 1,263
50 or more: 4,977
Mobile homes: 1,471
Boats, RVs, vans, etc.: 6
Median worth of mobile homes: $244,190
Housing units lacking complete plumbing facilities: 0.4%
Housing units lacking complete kitchen facilities: 0.3%