Ecorse, MI (Michigan) Houses and Residents
| Ecorse: | $56,885 |
| Michigan: | $224,400 |
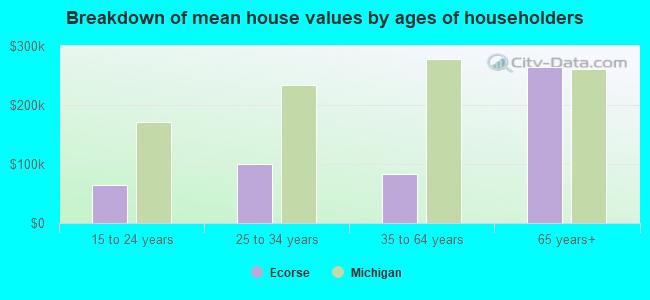
Mean price in 2022:
Detached houses: $165,540
Here: $165,540 State: $280,038 Townhouses or other attached units: $68,880
Here: $68,880 State: $239,520 In 2-unit structures: $117,697
Here: $117,697 State: $219,481 Mobile homes: $73,430
Here: $73,430 State: $72,868
Total population: 9,311 (All urban)
Houses: 4,121 (3,432 occupied: 2,223 owner occupied, 1,229 renter occupied)
| % of renters here: | 36% |
| State: | 27% |
Housing density: 1,532 houses/condos per square mile
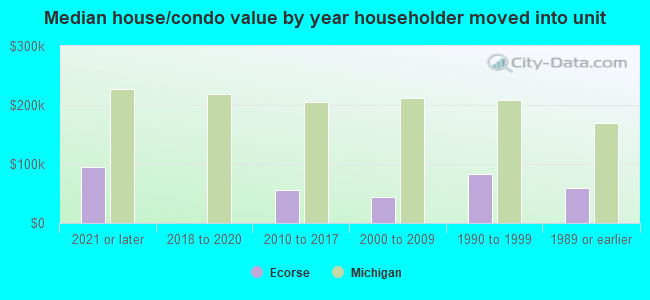
Median price asked for vacant for-sale houses and condos in 2022: $226,864.
Median contract rent in 2022: $597 (lower quartile is $503, upper quartile is $846)
Median rent asked for vacant for-rent units in 2022: $797
Median gross rent in Ecorse, MI in 2022: $832
Housing units in Ecorse with a mortgage: 617 (54 second mortgage, 0 home equity loan, 50 both second mortgage and home equity loan)
Houses without a mortgage: 0
Median household income for houses/condos with a mortgage: $66,722
Median household income for apartments without a mortgage: $39,328
Median monthly housing costs: $640
Compare current foreclosures near Ecorse, MI:
| Photo | Address | Area | Beds / Baths | Price | Details |
|---|---|---|---|---|---|

|
#1
Alexander Ct
Ecorse, MI 48229
|
- sq. feet
|
- baths - beds |
show details | |

|
#2
16th St
Ecorse, MI 48229
|
- sq. feet
|
- baths - beds |
show details | |

|
#3
9th St, Trlr 32
Ecorse, MI 48229
|
- sq. feet
|
- baths - beds |
show details | |

|
#4
11th St
Ecorse, MI 48229
|
- sq. feet
|
- baths - beds |
show details | |

|
#5
8th St
Ecorse, MI 48229
|
- sq. feet
|
- baths - beds |
show details | |

|
#6
Pitt St Apt 2
Ecorse, MI 48229
|
- sq. feet
|
- baths - beds |
show details | |

|
#7
Lenoir Ave
River Rouge, MI 48218
|
894 sq. feet
|
1 baths 3 beds |
$132,500
|
show details |

|
#8
Cicotte Ave
Allen Park, MI 48101
|
1,784 sq. feet
|
2 baths 4 beds |
$238,500
|
show details |

|
#9
Wildemere St
Detroit, MI 48221
|
2,751 sq. feet
|
3 baths 5 beds |
$466,500
|
show details |

|
#10
Ardmore St
Detroit, MI 48235
|
1,080 sq. feet
|
1 baths 3 beds |
$159,000
|
show details |
| Photo | Address | Area | Beds / Baths | Price | Details |
|---|---|---|---|---|---|

|
#11
Blackstone St
Detroit, MI 48219
|
996 sq. feet
|
1 baths 3 beds |
$111,500
|
show details |

|
#12
Conley St
Detroit, MI 48234
|
2,035 sq. feet
|
1 baths 3 beds |
$49,900
|
show details |

|
#13
Hubbell St
Detroit, MI 48235
|
2,305 sq. feet
|
2 baths 4 beds |
$72,800
|
show details |

|
#14
Venoy Rd
Wayne, MI 48184
|
986 sq. feet
|
1 baths 3 beds |
$120,900
|
show details |

|
#15
Matilda Ave
Flat Rock, MI 48134
|
1,298 sq. feet
|
2 baths 3 beds |
$259,000
|
show details |

|
#16
White Ave
Lincoln Park, MI 48146
|
936 sq. feet
|
1 baths 2 beds |
$164,500
|
show details |

|
#17
Glastonbury Rd
Detroit, MI 48219
|
1,717 sq. feet
|
1 baths 3 beds |
$130,000
|
show details |

|
#18
Sussex St
Detroit, MI 48235
|
901 sq. feet
|
1 baths 3 beds |
$151,500
|
show details |

|
#19
Macomb St
Grosse Ile, MI 48138
|
2,380 sq. feet
|
2 baths 4 beds |
$279,900
|
show details |

|
#20
Fordline St
Southgate, MI 48195
|
640 sq. feet
|
1 baths 2 beds |
$124,900
|
show details |
| Photo | Address | Area | Beds / Baths | Price | Details |
|---|---|---|---|---|---|

|
#21
Hartwell St
Detroit, MI 48227
|
1,135 sq. feet
|
1 baths 3 beds |
$10,000
|
show details |

|
#22
Littlefield St
Detroit, MI 48227
|
1,110 sq. feet
|
1 baths 3 beds |
$50,000
|
show details |

|
#23
Rivard Ave
Warren, MI 48089
|
584 sq. feet
|
1 baths 2 beds |
$46,800
|
show details |

|
#24
Montrose St
Detroit, MI 48227
|
1,310 sq. feet
|
1 baths 3 beds |
$95,500
|
show details |

|
#25
Winder St Apt 206
Detroit, MI 48201
|
770 sq. feet
|
1 baths 1 beds |
$309,900
|
show details |

|
#26
Greensboro St
Detroit, MI 48224
|
1,038 sq. feet
|
1 baths 2 beds |
$84,900
|
show details |

|
#27
Beech Daly Rd
Taylor, MI 48180
|
836 sq. feet
|
1 baths 3 beds |
$169,500
|
show details |

|
#28
Montrose St
Detroit, MI 48227
|
840 sq. feet
|
1 baths 3 beds |
$18,700
|
show details |

|
#29
Alcoy St
Detroit, MI 48205
|
921 sq. feet
|
1 baths 3 beds |
$74,500
|
show details |

|
#30
Helen St
Garden City, MI 48135
|
960 sq. feet
|
1 baths 3 beds |
$199,900
|
show details |
| Photo | Address | Area | Beds / Baths | Price | Details |
|---|---|---|---|---|---|

|
#31
Roselawn St
Detroit, MI 48204
|
1,368 sq. feet
|
2 baths 4 beds |
$47,900
|
show details |

|
#32
Desoto St
Detroit, MI 48238
|
1,500 sq. feet
|
1 baths 3 beds |
$61,250
|
show details |

|
#33
Hartwell St
Detroit, MI 48228
|
1,482 sq. feet
|
1 baths 3 beds |
$169,500
|
show details |

|
#34
Fisher Rd
Grosse Pointe, MI 48230
|
1,205 sq. feet
|
1 baths 3 beds |
$341,900
|
show details |

|
#35
Manhattan St
Oak Park, MI 48237
|
1,336 sq. feet
|
1 baths 3 beds |
$295,000
|
show details |

|
#36
Fort Park Blvd
Lincoln Park, MI 48146
|
1,175 sq. feet
|
1 baths 2 beds |
$148,500
|
show details |

|
#37
Ashton Rd
Detroit, MI 48223
|
1,621 sq. feet
|
1 baths 3 beds |
$233,500
|
show details |

|
#38
Kentfield St
Detroit, MI 48219
|
1,913 sq. feet
|
2 baths 5 beds |
$74,900
|
show details |

|
#39
Cherrygrove St
Ecorse, MI 48229
|
- sq. feet
|
- baths - beds |
show details | |

|
#40
2nd St
Ecorse, MI 48229
|
- sq. feet
|
- baths - beds |
show details |
| Photo | Address | Area | Beds / Baths | Price | Details |
|---|---|---|---|---|---|

|
#41
W Josephine St
Ecorse, MI 48229
|
- sq. feet
|
- baths - beds |
show details | |

|
#42
15th St
Ecorse, MI 48229
|
- sq. feet
|
- baths - beds |
show details | |

|
#43
12th St
Ecorse, MI 48229
|
- sq. feet
|
- baths - beds |
show details | |

|
#44
W Broadway St
Ecorse, MI 48229
|
- sq. feet
|
- baths - beds |
show details | |

|
#45
W Alexis St
Ecorse, MI 48229
|
- sq. feet
|
- baths - beds |
show details | |

|
#46
19th St
Ecorse, MI 48229
|
- sq. feet
|
- baths - beds |
show details | |

|
#47
19th St
Ecorse, MI 48229
|
- sq. feet
|
- baths - beds |
show details | |

|
#48
High St
Ecorse, MI 48229
|
- sq. feet
|
- baths - beds |
show details | |

|
#49
18th St
Ecorse, MI 48229
|
- sq. feet
|
- baths - beds |
show details | |

|
Check over 1 million property listings on Foreclosure.com!
|
browse all offers | |||

Latest news about housing in Ecorse, MI collected exclusively by city-data.com from local newspapers, TV, and radio stations

 | Renting a house vs. apartment in Downriver area (8 replies) |
| Senior homesick for Downriver Michigan (19 replies) |
| Flint, MI (11 replies) |
| Can Detroit ever make a comeback??? (88 replies) |
| Ecorse cops. (17 replies) |
| Best Neighborhood for Cheap House (2 replies) |

Median year apartment built: 1955
Household type by relationship:
Households: 9,163- Male householders: 1,529 (709 living alone), Female householders: 1,860 (582 living alone)
696 spouses (682 opposite-sex spouses), 249 unmarried partners, (237 opposite-sex unmarried partners), 3,303 children (3,188 natural, 0 adopted, 115 stepchildren), 593 grandchildren, 406 brothers or sisters, 109 parents, 0 foster children, 78 other relatives, 292 non-relatives
- In group quarters: 42
Size of family households: 712 2-persons, 490 3-persons, 416 4-persons, 177 5-persons, 92 6-persons, 58 7-or-more-persons.
Size of nonfamily households: 1,338 1-person, 91 2-persons, 59 3-persons.
1,011 married couples with children.
1,009 single-parent households (229 men, 780 women).
89.6% of residents of Ecorse speak English at home.
9.2% of residents speak Spanish at home (80% speak English very well, 13% speak English well, 3% speak English not well, 3% don't speak English at all).
0.5% of residents speak other Indo-European language at home (100% speak English very well).
0.3% of residents speak other language at home (95% speak English very well, 5% speak English well).
Foreign born population: 192 (2.1%)
(20.8% of them are naturalized citizens)
| Here: | 5.6 |
| State: | 6.5 |
| Here: | 4.4 |
| State: | 4.3 |
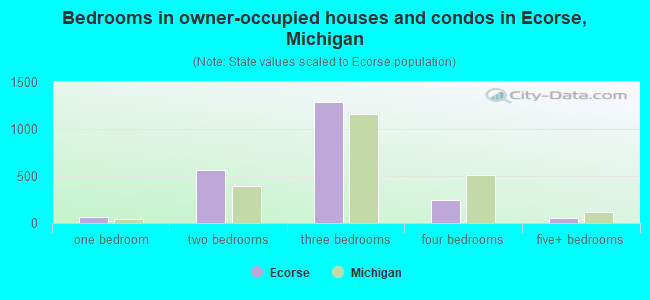
- Bedrooms in owner-occupied houses and condos in Ecorse, Michigan
- 0no bedroom
- 691 bedroom
- 5652 bedrooms
- 1,2923 bedrooms
- 2414 bedrooms
- 555+ bedrooms
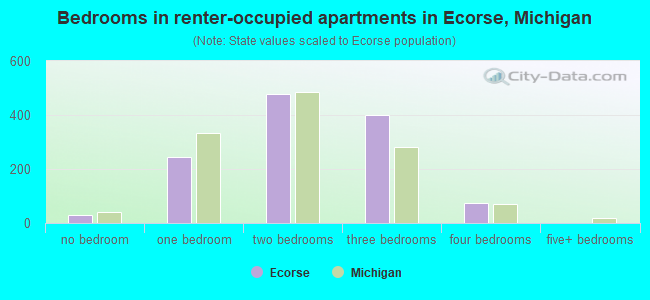
- Bedrooms in renter-occupied apartments in Ecorse, Michigan
- 30no bedroom
- 2441 bedroom
- 4792 bedrooms
- 4013 bedrooms
- 754 bedrooms
- 05+ bedrooms
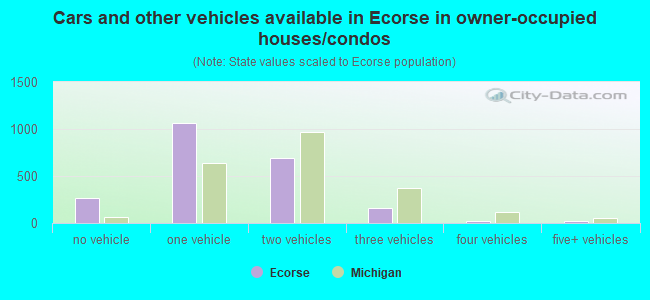
- Cars and other vehicles available in Ecorse in owner-occupied houses/condos
- 262no vehicle
- 1,0621 vehicle
- 6942 vehicles
- 1613 vehicles
- 204 vehicles
- 245+ vehicles
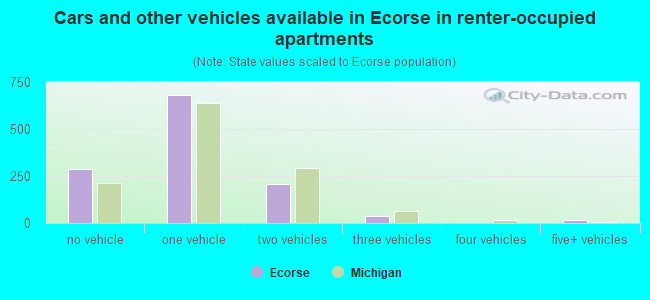
- Cars and other vehicles available in Ecorse in renter-occupied apartments
- 287no vehicle
- 6791 vehicle
- 2092 vehicles
- 373 vehicles
- 04 vehicles
- 175+ vehicles
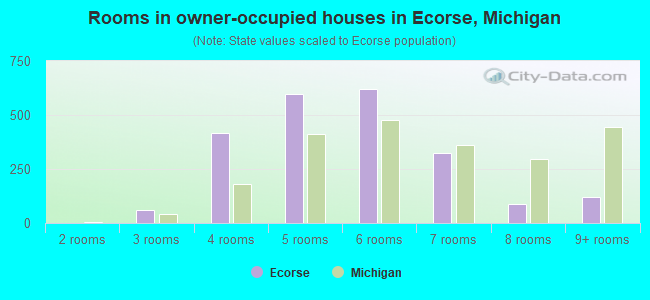
- Rooms in owner-occupied houses in Ecorse, Michigan
- 01 room
- 02 rooms
- 603 rooms
- 4174 rooms
- 5975 rooms
- 6196 rooms
- 3227 rooms
- 878 rooms
- 1229+ rooms
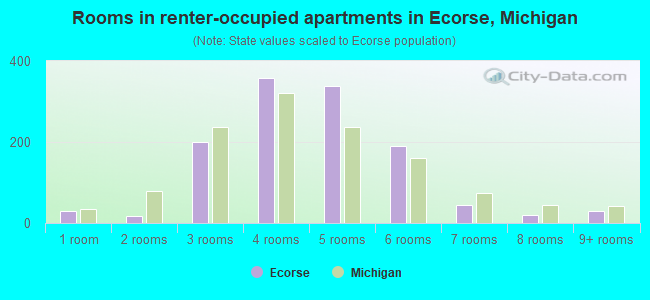
- Rooms in renter-occupied apartments in Ecorse, Michigan
- 301 room
- 182 rooms
- 2013 rooms
- 3574 rooms
- 3395 rooms
- 1916 rooms
- 447 rooms
- 208 rooms
- 299+ rooms
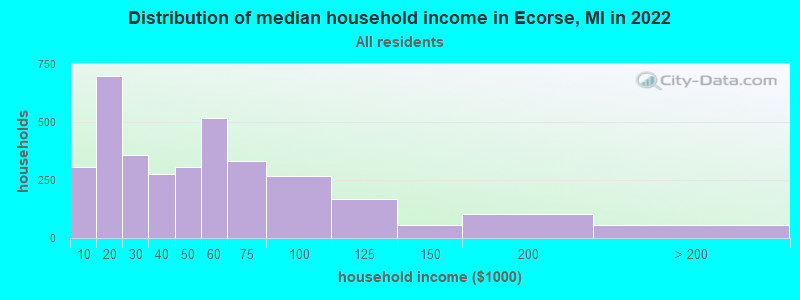
Ecorse, MI household income distribution

- 307Less than $10,000
- 700$10,000 to $19,999
- 359$20,000 to $29,999
- 278$30,000 to $39,999
- 305$40,000 to $49,999
- 519$50,000 to $59,999
- 334$60,000 to $74,999
- 266$75,000 to $99,999
- 170$100,000 to $124,999
- 58$125,000 to $149,999
- 103$150,000 to $199,999
- 58$200,000 or more
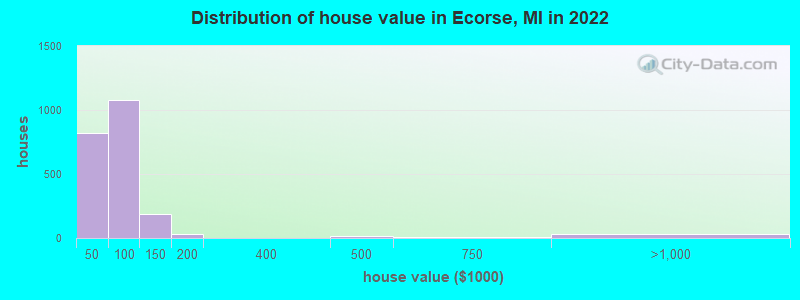
Home value of owner - occupied houses in 2022 in Ecorse, MI
-
- 158Less than $10,000
- 56$10,000 to $14,999
- 40$15,000 to $19,999
- 77$20,000 to $24,999
- 12$25,000 to $29,999
- 145$30,000 to $34,999
- 49$35,000 to $39,999
- 280$40,000 to $49,999
- 280$50,000 to $59,999
- 97$60,000 to $69,999
- 172$70,000 to $79,999
- 160$80,000 to $89,999
- 89$90,000 to $99,999
- 144$100,000 to $124,999
- 45$125,000 to $149,999
- 9$150,000 to $174,999
- 20$175,000 to $199,999
- 11$400,000 to $499,999
- 4$500,000 to $749,999
- 28$750,000 to $999,999
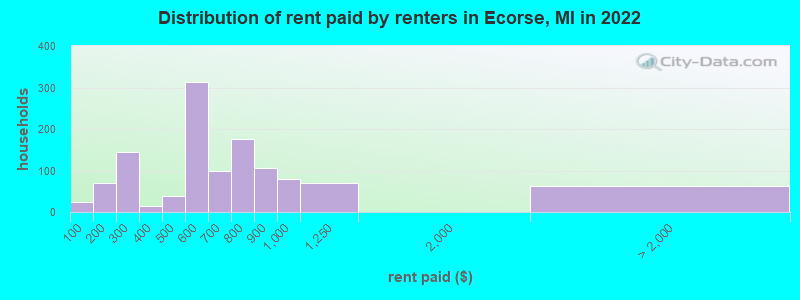
Rent paid by renters in 2022 in Ecorse, MI
-
- 24Less than $100
- 46$100 to $149
- 24$150 to $199
- 101$200 to $249
- 44$250 to $299
- 15$350 to $399
- 28$400 to $449
- 9$450 to $499
- 215$500 to $549
- 98$550 to $599
- 36$600 to $649
- 63$650 to $699
- 126$700 to $749
- 50$750 to $799
- 105$800 to $899
- 78$900 to $999
- 69$1,000 to $1,249
- 62No cash rent
Percentage of workers working in this county: 87.2%
Number of people working at home: 451 (13.9% of all workers)
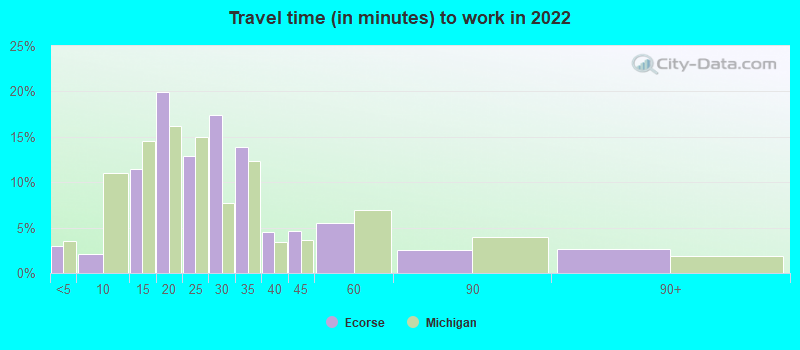
Travel time to work (commute)
- Less than 5 minutes: 66
- 5 to 9 minutes: 151
- 10 to 14 minutes: 388
- 15 to 19 minutes: 483
- 20 to 24 minutes: 623
- 25 to 29 minutes: 284
- 30 to 34 minutes: 364
- 35 to 39 minutes: 83
- 40 to 44 minutes: 41
- 45 to 59 minutes: 202
- 60 to 89 minutes: 83
- 90 or more minutes: 24
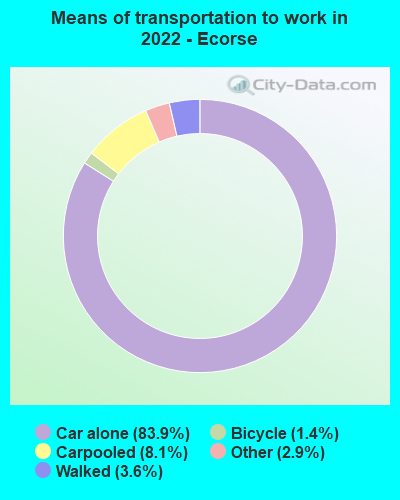
Means of transportation to work:
- Drove a car alone: 2,224 (72.0%)
- Carpooled: 212 (6.9%)
- Taxi: 83 (2.7%)
- Bicycle: 45 (1.5%)
- Walked: 102 (3.3%)
- Worked at home: 451 (14.6%)
- Unemployment by race in 2022
- Unemployment rate for White non-Hispanic residents
- 9.8%Males
- Unemployment rate for Black residents
- 8.3%Males
- 9.6%Females
- Unemployment rate for other race residents
- 5.6%Males
- Unemployment rate for two or more race residents
- 23.0%Males
- Unemployment rate for Hispanic or Latino residents
- 10.7%Males
- 3.5%Females
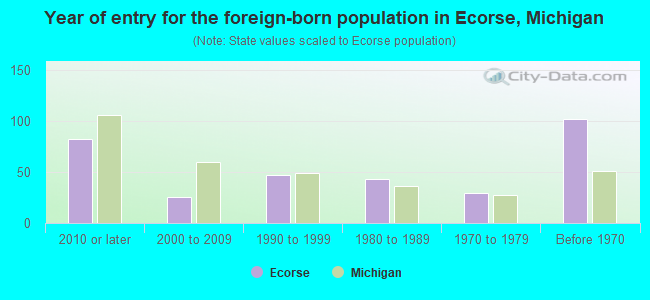
- Year of entry for the foreign-born population in Ecorse, Michigan
- 822010 or later
- 262000 to 2009
- 471990 to 1999
- 431980 to 1989
- 291970 to 1979
- 102Before 1970
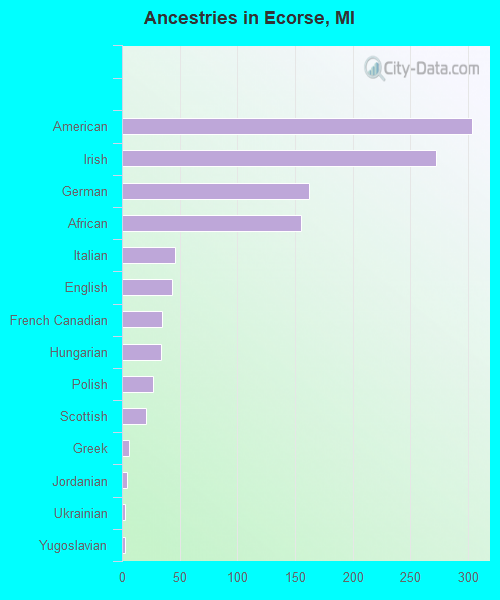
First ancestries reported:
- American: 303 (6.4%)
- Irish: 272 (5.7%)
- German: 162 (3.4%)
- African: 155 (3.3%)
- Italian: 46 (1.0%)
- English: 43 (0.9%)
- French Canadian: 35 (0.7%)
- Hungarian: 34 (0.7%)
- Polish: 27 (0.6%)
- Scottish: 21 (0.4%)
- Greek: 6 (0.1%)
- Jordanian: 4 (0.08%)
- Ukrainian: 3 (0.06%)
- Yugoslavian: 3 (0.06%)
- British: 2 (0.04%)
Most common places of birth for foreign-born residents (%):
| Ecorse: | 68.6% (129) |
| Michigan: | 10.9% (75,965) |
| Ecorse: | 16.0% (30) |
| Michigan: | 0.2% (1,062) |
| Ecorse: | 5.9% (11) |
| Michigan: | 0.4% (2,977) |
| Ecorse: | 1.6% (3) |
| Michigan: | 1.0% (6,829) |
Place of birth for U.S.-born residents:
- This state: 7,525
- Other state: 1,373
- Northeast: 104
- Midwest: 181
- South: 913
- West: 179
86.6% of Ecorse residents lived in the same house 1 years ago.
Out of people who lived in different houses, 40.0% lived in this county.
Out of people who lived in different counties, 66.9% lived in Michigan.
| Ecorse: | 86.6% |
| State average: | 88.4% |
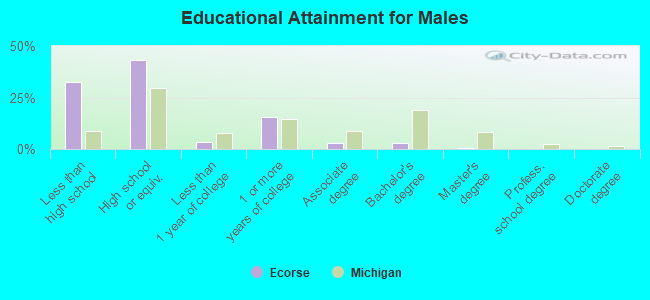
Education attainment for males 25 years and older:
- No schooling: 39
- Nursery to 4th grade: 6
- 5th and 6th grade: 3
- 7th and 8th grade: 56
- 9th grade: 175
- 10th grade: 338
- 11th grade: 97
- 12th grade, no diploma: 232
- High school graduate (or equivalency): 1,251
- Less than 1 year of college: 99
- Some college more than 1 year, no degree: 447
- Associate degree: 80
- Bachelor's degree: 78
- Master's degree: 9
- Professional school degree: 0
- Doctorate degree: 0
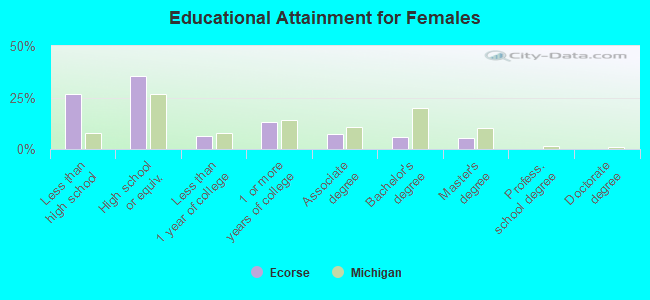
Education attainment for females 25 years and older:
- No schooling: 86
- Nursery to 4th grade: 19
- 5th and 6th grade: 3
- 7th and 8th grade: 80
- 9th grade: 120
- 10th grade: 220
- 11th grade: 56
- 12th grade, no diploma: 241
- High school graduate (or equivalency): 1,099
- Less than 1 year of college: 197
- Some college more than 1 year, no degree: 408
- Associate degree: 228
- Bachelor's degree: 185
- Master's degree: 168
- Professional school degree: 0
- Doctorate degree: 0


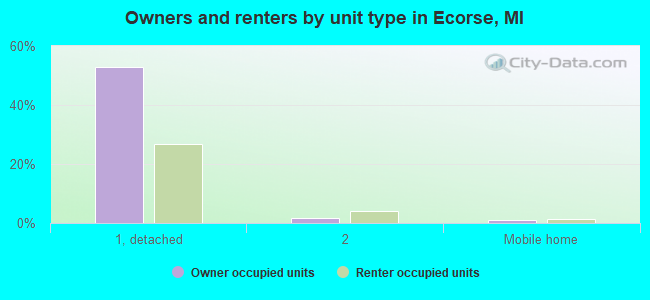
Housing units in structures:
- One, detached: 3,054
- One, attached: 107
- Two: 317
- 3 or 4: 133
- 5 to 9: 102
- 10 to 19: 57
- 20 to 49: 60
- 50 or more: 82
- Mobile homes: 203
Housing units lacking complete kitchen facilities in 2022: 7.3%
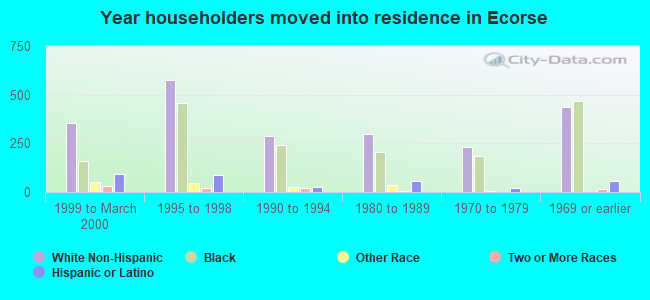
House/condo owner moved in on average 22 years ago
Renter moved in on average 2 years ago
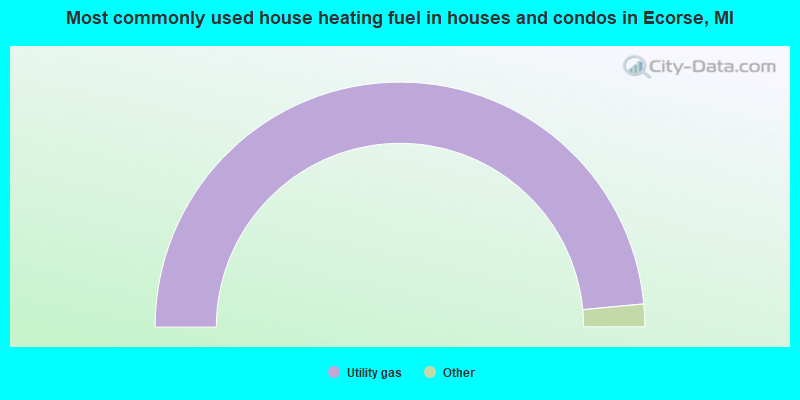
- 97.0%Utility gas
- 1.4%Electricity
- 1.4%No fuel used
- 0.2%Bottled, tank, or LP gas
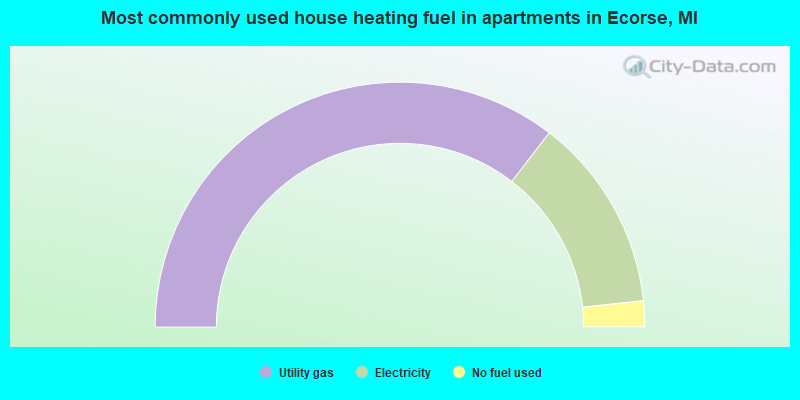
- 70.8%Utility gas
- 25.7%Electricity
- 3.4%No fuel used
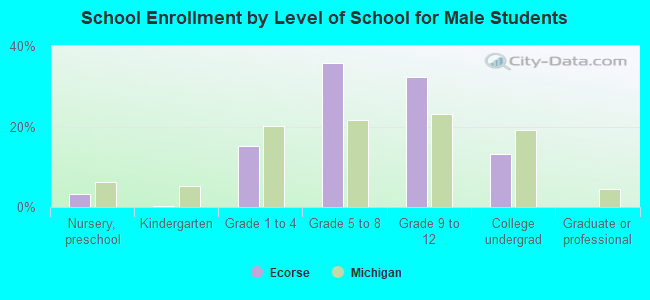
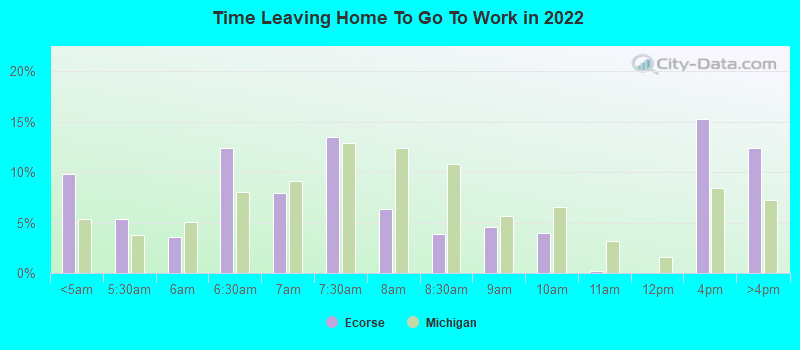
Private vs. public school enrollment:
| Here: | 2.2% |
| Michigan: | 12.4% |
| Here: | 13.4% |
| Michigan: | 9.8% |
| Here: | 4.2% |
| Michigan: | 14.9% |