Cary, IL (Illinois) Houses and Residents
| Cary: | $302,881 |
| Illinois: | $251,600 |
Total population: 17,991 (Urban population: 15,381, Rural population: 0)
Houses: 6,533 (6,461 occupied: 5,605 owner occupied, 934 renter occupied)
| % of renters here: | 14% |
| State: | 33% |
Housing density: 1,244 houses/condos per square mile
Median price asked for vacant for-sale houses and condos in 2022: $889,541.
Median contract rent in 2022: $1,059 (lower quartile is $932, upper quartile is $1,377)
Median rent asked for vacant for-rent units in 2022: $1,862
Median gross rent in Cary, IL in 2022: $1,195
Housing units in Cary with a mortgage: 4,233 (379 second mortgage, 0 home equity loan, 301 both second mortgage and home equity loan)
Houses without a mortgage: 31
Median household income for houses/condos with a mortgage: $119,640
Median household income for apartments without a mortgage: $98,106
Median monthly housing costs: $1,742
Compare current foreclosures in Cary, IL:
| Photo | Address | Area | Beds / Baths | Price | Details |
|---|---|---|---|---|---|

|
#1
Pheasant Trl
Cary, IL 60013
|
832 sq. feet
|
2 baths 3 beds |
show details | |

|
#2
Country Commons Rd
Cary, IL 60013
|
1,661 sq. feet
|
1 baths 1 beds |
show details | |

|
#3
Wildwood Trl
Cary, IL 60013
|
1,140 sq. feet
|
2 baths 2 beds |
show details | |

|
#4
E Main Street Rd
Cary, IL 60013
|
1,250 sq. feet
|
2 baths 4 beds |
show details | |

|
#5
N School St
Cary, IL 60013
|
1,178 sq. feet
|
2 baths 3 beds |
show details | |

|
#6
Hampton St
Cary, IL 60013
|
2,195 sq. feet
|
3 baths 4 beds |
show details | |

|
#7
Georgetown Dr
Cary, IL 60013
|
1,381 sq. feet
|
2 baths 3 beds |
show details | |

|
#8
Blue Mesa Trl
Cary, IL 60013
|
2,195 sq. feet
|
3 baths 4 beds |
show details | |

|
#9
Cimarron Dr
Cary, IL 60013
|
2,583 sq. feet
|
3 baths 4 beds |
show details | |

|
#10
Wood Dr
Cary, IL 60013
|
1,368 sq. feet
|
2 baths 3 beds |
show details |
| Photo | Address | Area | Beds / Baths | Price | Details |
|---|---|---|---|---|---|

|
#11
Little Cahill St
Cary, IL 60013
|
2,736 sq. feet
|
3 baths 4 beds |
show details | |

|
#12
Greenview Rd
Cary, IL 60013
|
2,142 sq. feet
|
4 baths 3 beds |
show details | |

|
#13
Stonegate Rd
Cary, IL 60013
|
3,344 sq. feet
|
3 baths 5 beds |
show details | |

|
#14
Wildwood Trl
Cary, IL 60013
|
1,386 sq. feet
|
2 baths 3 beds |
show details | |

|
#15
Surrey Ridge Dr
Cary, IL 60013
|
2,392 sq. feet
|
3 baths 4 beds |
show details | |

|
#16
Oakwood Dr
Cary, IL 60013
|
892 sq. feet
|
4 baths 2 beds |
show details | |

|
#17
Wentworth Cir
Cary, IL 60013
|
3,220 sq. feet
|
3 baths 4 beds |
show details | |

|
#18
Park Ave
Cary, IL 60013
|
1,224 sq. feet
|
2 baths 3 beds |
show details | |

|
#19
Blazing Star Trl
Cary, IL 60013
|
1,937 sq. feet
|
3 baths 4 beds |
show details | |

|
#20
Hilltop Rd
Cary, IL 60013
|
674 sq. feet
|
3 baths - beds |
show details |
| Photo | Address | Area | Beds / Baths | Price | Details |
|---|---|---|---|---|---|

|
#21
Greenview Rd
Cary, IL 60013
|
1,900 sq. feet
|
2 baths 3 beds |
show details | |

|
#22
Greenview Rd
Cary, IL 60013
|
2,044 sq. feet
|
2 baths 4 beds |
show details | |

|
#23
Hickory Nut Grove Ln
Cary, IL 60013
|
2,763 sq. feet
|
3 baths 3 beds |
show details | |

|
#24
Park Ave
Cary, IL 60013
|
1,800 sq. feet
|
1 baths 3 beds |
show details | |

|
#25
Elk Trl
Cary, IL 60013
|
2,911 sq. feet
|
3 baths - beds |
show details | |

|
#26
Claire Ln
Cary, IL 60013
|
2,218 sq. feet
|
3 baths - beds |
show details | |

|
#27
Fox Trail Ter
Cary, IL 60013
|
3,075 sq. feet
|
2 baths 4 beds |
show details | |

|
#28
Palisades Ln
Cary, IL 60013
|
- sq. feet
|
2 baths 3 beds |
show details | |

|
#29
Hilltop Rd
Cary, IL 60013
|
- sq. feet
|
2 baths 3 beds |
show details | |

|
#30
Cougar Trl
Cary, IL 60013
|
- sq. feet
|
3 baths 4 beds |
show details |
| Photo | Address | Area | Beds / Baths | Price | Details |
|---|---|---|---|---|---|

|
#31
Elden Dr
Cary, IL 60013
|
- sq. feet
|
2 baths 3 beds |
show details | |

|
#32
Crabtree Ln
Cary, IL 60013
|
- sq. feet
|
2 baths 4 beds |
show details | |

|
#33
E Main St
Cary, IL 60013
|
1,240 sq. feet
|
2 baths - beds |
show details | |

|
#34
Duxbury Ln
Cary, IL 60013
|
- sq. feet
|
2 baths 3 beds |
show details | |

|
#35
Newcastle Dr
Cary, IL 60013
|
- sq. feet
|
3 baths 4 beds |
show details | |

|
#36
S Prairie St
Cary, IL 60013
|
- sq. feet
|
1 baths 3 beds |
show details | |

|
#37
Spruce Tree Dr
Cary, IL 60013
|
- sq. feet
|
2 baths 4 beds |
show details | |

|
#38
Wagner Dr
Cary, IL 60013
|
- sq. feet
|
- baths - beds |
show details | |

|
#39
Cary Algonquin Rd
Cary, IL 60013
|
- sq. feet
|
- baths - beds |
show details | |

|
#40
Valley Dr
Cary, IL 60013
|
- sq. feet
|
- baths - beds |
show details |
| Photo | Address | Area | Beds / Baths | Price | Details |
|---|---|---|---|---|---|

|
#41
New Haven Dr
Cary, IL 60013
|
- sq. feet
|
- baths - beds |
show details | |

|
#42
Main St Rd
Cary, IL 60013
|
- sq. feet
|
- baths - beds |
show details | |

|
#43
Alma Ter
Cary, IL 60013
|
- sq. feet
|
- baths 2 beds |
show details | |

|
#44
Sunset Dr
Cary, IL 60013
|
- sq. feet
|
- baths 5 beds |
show details | |

|
#45
Pine Cir
Cary, IL 60013
|
- sq. feet
|
- baths - beds |
show details | |

|
#46
Feinberg Ct # 313
Cary, IL 60013
|
- sq. feet
|
- baths - beds |
show details | |

|
#47
Meadow Ln
Cary, IL 60013
|
- sq. feet
|
- baths 3 beds |
show details | |

|
#48
Green Meadow Ln
Cary, IL 60013
|
- sq. feet
|
- baths - beds |
show details | |

|
#49
Wellington Ln
Cary, IL 60013
|
- sq. feet
|
- baths - beds |
show details | |

|
Check over 1 million property listings on Foreclosure.com!
|
browse all offers | |||

Latest news about housing in Cary, IL collected exclusively by city-data.com from local newspapers, TV, and radio stations

 | House/Townhouse/Apartment for Rent in Cary, Crystal Lake, or St. Charles? (2 replies) |
| Moving to IL - is there any future? (207 replies) |
| Suburbs that are obscure or little-known (240 replies) |
| Cary, Fox River Grove area feel? (21 replies) |
| House/Townhouse/Apartment for Rent? (2 replies) |
| LITH, Crystal Lake, Cary (West of Fox River) (11 replies) |

Median year apartment built: 1969
Household type by relationship:
Households: 17,915- Male householders: 3,206 (344 living alone), Female householders: 3,190 (659 living alone)
4,046 spouses (4,023 opposite-sex spouses), 651 unmarried partners, (651 opposite-sex unmarried partners), 5,911 children (5,649 natural, 70 adopted, 192 stepchildren), 230 grandchildren, 22 brothers or sisters, 141 parents, 0 foster children, 94 other relatives, 365 non-relatives
- In group quarters: 55
Size of family households: 1,916 2-persons, 1,049 3-persons, 1,295 4-persons, 304 5-persons, 88 6-persons, 93 7-or-more-persons.
Size of nonfamily households: 1,154 1-person, 539 2-persons, 70 3-persons, 63 4-persons.
2,931 married couples with children.
835 single-parent households (51 men, 784 women).
89.3% of residents of Cary speak English at home.
6.3% of residents speak Spanish at home (81% speak English very well, 6% speak English well, 9% speak English not well, 3% don't speak English at all).
2.8% of residents speak other Indo-European language at home (57% speak English very well, 25% speak English well, 16% speak English not well, 2% don't speak English at all).
0.9% of residents speak Asian or Pacific Island language at home (87% speak English very well, 13% speak English not well).
Foreign born population: 1,349 (7.5%)
(74.9% of them are naturalized citizens)
| Here: | 7.4 |
| State: | 6.4 |
| Here: | 4.1 |
| State: | 4.1 |

- Bedrooms in owner-occupied houses and condos in Cary, Illinois
- 0no bedroom
- 01 bedroom
- 6902 bedrooms
- 2,4443 bedrooms
- 2,0884 bedrooms
- 3835+ bedrooms

- Bedrooms in renter-occupied apartments in Cary, Illinois
- 23no bedroom
- 2011 bedroom
- 4572 bedrooms
- 2333 bedrooms
- 224 bedrooms
- 05+ bedrooms

- Cars and other vehicles available in Cary in owner-occupied houses/condos
- 42no vehicle
- 1,0791 vehicle
- 2,9782 vehicles
- 1,0483 vehicles
- 2884 vehicles
- 1715+ vehicles

- Cars and other vehicles available in Cary in renter-occupied apartments
- 205no vehicle
- 3561 vehicle
- 2452 vehicles
- 1193 vehicles
- 94 vehicles
- 05+ vehicles

- Rooms in owner-occupied houses in Cary, Illinois
- 01 room
- 02 rooms
- 463 rooms
- 1774 rooms
- 8745 rooms
- 9466 rooms
- 9707 rooms
- 9648 rooms
- 1,6299+ rooms

- Rooms in renter-occupied apartments in Cary, Illinois
- 231 room
- 262 rooms
- 1133 rooms
- 3584 rooms
- 1705 rooms
- 1296 rooms
- 07 rooms
- 508 rooms
- 679+ rooms


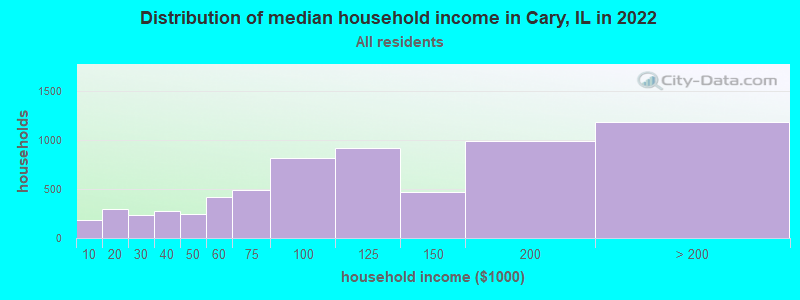
Cary, IL household income distribution

- 186Less than $10,000
- 298$10,000 to $19,999
- 233$20,000 to $29,999
- 279$30,000 to $39,999
- 244$40,000 to $49,999
- 422$50,000 to $59,999
- 489$60,000 to $74,999
- 819$75,000 to $99,999
- 914$100,000 to $124,999
- 464$125,000 to $149,999
- 992$150,000 to $199,999
- 1,182$200,000 or more
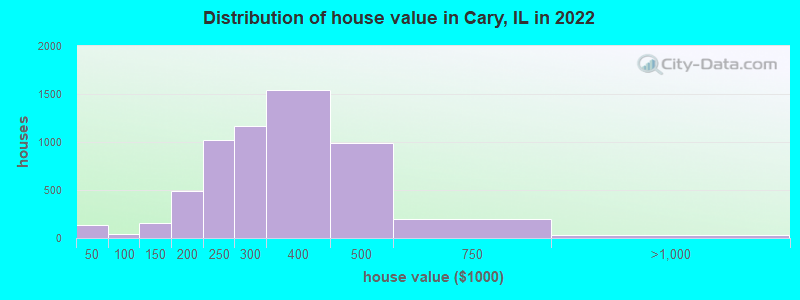
Home value of owner - occupied houses in 2022 in Cary, IL
-
- 22Less than $10,000
- 8$20,000 to $24,999
- 106$25,000 to $29,999
- 19$50,000 to $59,999
- 19$80,000 to $89,999
- 24$100,000 to $124,999
- 133$125,000 to $149,999
- 118$150,000 to $174,999
- 365$175,000 to $199,999
- 1,016$200,000 to $249,999
- 1,163$250,000 to $299,999
- 1,542$300,000 to $399,999
- 990$400,000 to $499,999
- 196$500,000 to $749,999
- 12$750,000 to $999,999
- 15$2,000,000 or more
Rent paid by renters in 2022 in Cary, IL
-
- 7Less than $100
- 17$350 to $399
- 10$450 to $499
- 52$550 to $599
- 62$750 to $799
- 33$900 to $999
- 270$1,000 to $1,249
- 157$1,250 to $1,499
- 222$1,500 to $1,999
- 18$2,000 to $2,499
- 12$3,500 or more
- 20No cash rent


Percentage of workers working in this county: 57.0%
Number of people working at home: 2,025 (20.0% of all workers)
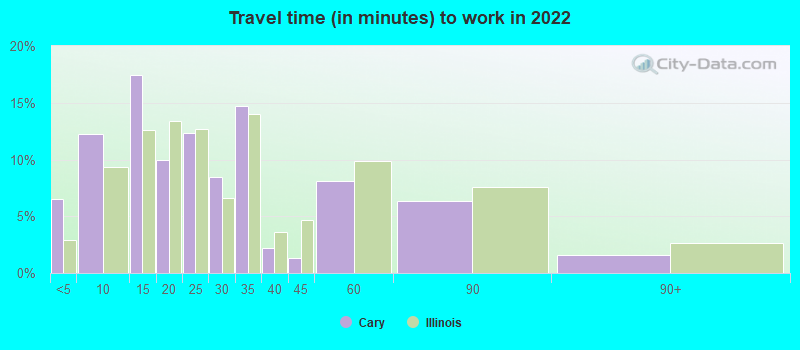
Travel time to work (commute)
- Less than 5 minutes: 348
- 5 to 9 minutes: 850
- 10 to 14 minutes: 776
- 15 to 19 minutes: 887
- 20 to 24 minutes: 1,065
- 25 to 29 minutes: 408
- 30 to 34 minutes: 956
- 35 to 39 minutes: 345
- 40 to 44 minutes: 268
- 45 to 59 minutes: 1,134
- 60 to 89 minutes: 881
- 90 or more minutes: 199
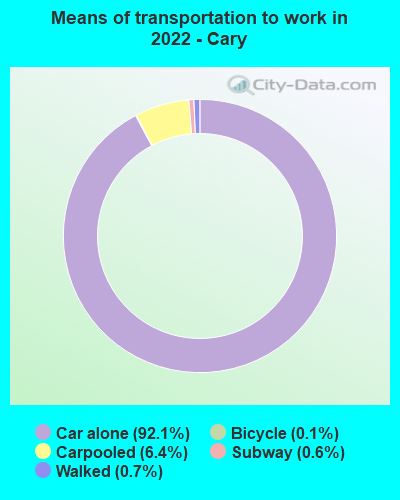
Means of transportation to work:
- Drove a car alone: 5,015 (67.1%)
- Carpooled: 388 (5.2%)
- Long-distance train or commuter rail: 19 (0.3%)
- Taxi: 7 (0.1%)
- Bicycle: 8 (0.1%)
- Walked: 42 (0.6%)
- Worked at home: 2,025 (27.1%)

- Unemployment by race in 2022
- Unemployment rate for White non-Hispanic residents
- 6.0%Males
- 2.4%Females
- Unemployment rate for other race residents
- 19.5%Males
- 1.9%Females
- Unemployment rate for two or more race residents
- 3.0%Males
- Unemployment rate for Hispanic or Latino residents
- 4.1%Males
- 4.5%Females

- Year of entry for the foreign-born population in Cary, Illinois
- 852010 or later
- 2032000 to 2009
- 4351990 to 1999
- 1711980 to 1989
- 541970 to 1979
- 106Before 1970
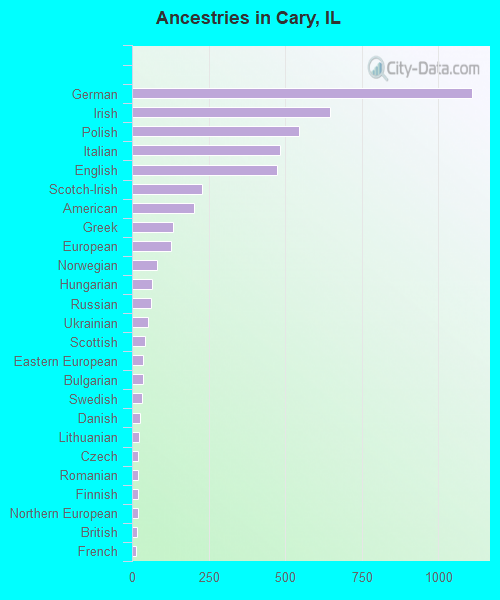
First ancestries reported:
- German: 1,110 (18.2%)
- Irish: 647 (10.6%)
- Polish: 546 (8.9%)
- Italian: 484 (7.9%)
- English: 473 (7.8%)
- Scotch-Irish: 228 (3.7%)
- American: 203 (3.3%)
- Greek: 134 (2.2%)
- European: 127 (2.1%)
- Norwegian: 80 (1.3%)
- Hungarian: 65 (1.1%)
- Russian: 61 (1.0%)
- Ukrainian: 51 (0.8%)
- Scottish: 42 (0.7%)
- Eastern European: 36 (0.6%)
- Bulgarian: 35 (0.6%)
- Swedish: 33 (0.5%)
- Danish: 26 (0.4%)
- Lithuanian: 23 (0.4%)
- Czech: 21 (0.3%)
- Romanian: 21 (0.3%)
- Finnish: 19 (0.3%)
- Northern European: 19 (0.3%)
- British: 15 (0.2%)
- French: 12 (0.2%)
- Croatian: 11 (0.2%)
- Haitian: 11 (0.2%)
- French Canadian: 9 (0.1%)
- Dutch: 8 (0.1%)
- Moroccan: 7 (0.1%)
- Slovak: 6 (0.10%)
Most common places of birth for foreign-born residents (%):
| Cary: | 30.0% (376) |
| Illinois: | 34.7% (626,958) |
| Cary: | 18.3% (229) |
| Illinois: | 6.9% (124,474) |
| Cary: | 6.5% (81) |
| Illinois: | 1.6% (29,316) |
| Cary: | 5.6% (70) |
| Illinois: | 0.5% (8,161) |
| Cary: | 4.1% (52) |
| Illinois: | 5.2% (93,003) |
| Cary: | 3.2% (40) |
| Illinois: | 0.3% (4,639) |
| Cary: | 2.8% (35) |
| Illinois: | 0.9% (15,679) |
| Cary: | 2.6% (33) |
| Illinois: | 0.8% (14,165) |
| Cary: | 2.5% (31) |
| Illinois: | 2.2% (40,393) |
| Cary: | 2.5% (31) |
| Illinois: | 0.5% (8,551) |
| Cary: | 2.2% (27) |
| Illinois: | 9.2% (166,409) |
| Cary: | 2.1% (26) |
| Illinois: | 1.1% (19,306) |
| Cary: | 2.0% (25) |
| Illinois: | 0.6% (10,720) |
| Cary: | 1.8% (23) |
| Illinois: | 0.5% (9,671) |
| Cary: | 1.8% (23) |
| Illinois: | 0.9% (16,553) |
| Cary: | 1.8% (22) |
| Illinois: | 0.9% (16,308) |
| Cary: | 1.6% (20) |
| Illinois: | 0.2% (3,065) |
| Cary: | 1.6% (20) |
| Illinois: | 1.0% (18,753) |
Place of birth for U.S.-born residents:
- This state: 13,400
- Other state: 3,017
- Northeast: 445
- Midwest: 1,590
- South: 515
- West: 458
91.8% of Cary residents lived in the same house 1 years ago.
Out of people who lived in different houses, 37.7% lived in this county.
Out of people who lived in different counties, 90.0% lived in Illinois.
| Cary: | 91.8% |
| State average: | 88.3% |
Education attainment for males 25 years and older:
- No schooling: 56
- Nursery to 4th grade: 0
- 5th and 6th grade: 0
- 7th and 8th grade: 23
- 9th grade: 31
- 10th grade: 36
- 11th grade: 39
- 12th grade, no diploma: 33
- High school graduate (or equivalency): 1,053
- Less than 1 year of college: 393
- Some college more than 1 year, no degree: 950
- Associate degree: 562
- Bachelor's degree: 1,642
- Master's degree: 866
- Professional school degree: 107
- Doctorate degree: 22

Education attainment for females 25 years and older:
- No schooling: 21
- Nursery to 4th grade: 20
- 5th and 6th grade: 10
- 7th and 8th grade: 4
- 9th grade: 0
- 10th grade: 9
- 11th grade: 11
- 12th grade, no diploma: 0
- High school graduate (or equivalency): 1,307
- Less than 1 year of college: 549
- Some college more than 1 year, no degree: 877
- Associate degree: 595
- Bachelor's degree: 1,962
- Master's degree: 987
- Professional school degree: 106
- Doctorate degree: 10


Housing units in structures:
- One, detached: 5,084
- One, attached: 1,006
- Two: 20
- 3 or 4: 45
- 5 to 9: 158
- 10 to 19: 63
- 20 to 49: 115
- 50 or more: 39
Housing units lacking complete kitchen facilities in 2022: 1.0%
House/condo owner moved in on average 13 years ago
Renter moved in on average 0 years ago

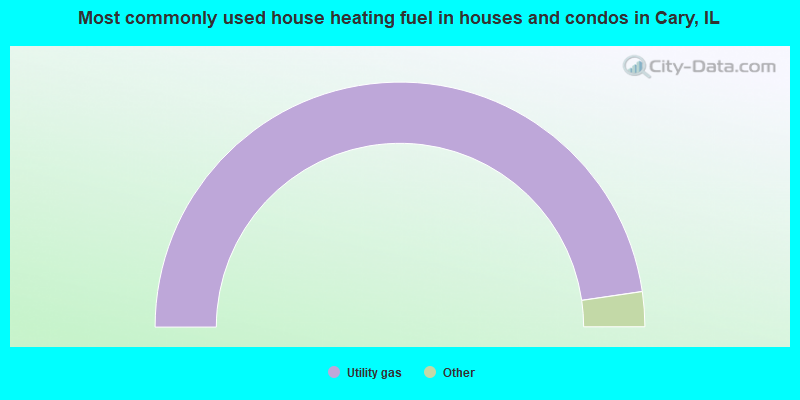
- 95.4%Utility gas
- 2.7%Electricity
- 1.0%Bottled, tank, or LP gas
- 0.7%Solar energy
- 0.2%No fuel used
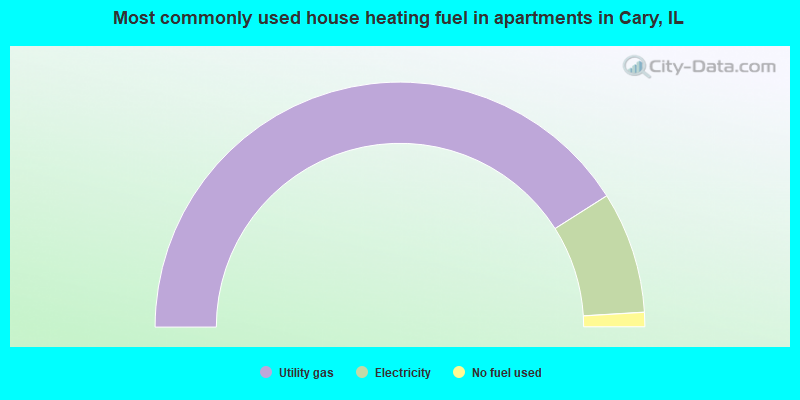
- 82.0%Utility gas
- 16.1%Electricity
- 1.9%No fuel used
Private vs. public school enrollment:
| Here: | 11.3% |
| Illinois: | 13.3% |
| Here: | 6.5% |
| Illinois: | 9.9% |
| Here: | 20.6% |
| Illinois: | 27.4% |


