Cape Canaveral, FL (Florida) Houses and Residents
| Cape Canaveral: | $390,712 |
| Florida: | $354,100 |
Mean price in 2022:
Detached houses: $646,216
Here: $646,216 State: $500,941 Townhouses or other attached units: $447,681
Here: $447,681 State: $370,869 In 2-unit structures: $162,899
Here: $162,899 State: $423,188 In 3-to-4-unit structures: $347,959
Here: $347,959 State: $309,944 In 5-or-more-unit structures: $339,119
Here: $339,119 State: $447,145 Mobile homes: $17,083
Here: $17,083 State: $113,202 Occupied boats, RVs, vans, etc.: $36,648
Here: $36,648 State: $73,933
Total population: 10,049 (Urban population: 8,954, Rural population: 0)
Houses: 9,111 (5,951 occupied: 3,677 owner occupied, 2,310 renter occupied)
| % of renters here: | 39% |
| State: | 33% |
Housing density: 3,909 houses/condos per square mile
Median price asked for vacant for-sale houses and condos in 2022: $435,983.
Median contract rent in 2022: $1,012 (lower quartile is $749, upper quartile is $1,453)
Median rent asked for vacant for-rent units in 2022: $1,527
Median gross rent in Cape Canaveral, FL in 2022: $1,114
Housing units in Cape Canaveral with a mortgage: 1,456 (138 second mortgage, 86 home equity loan, 55 both second mortgage and home equity loan)
Houses without a mortgage: 0
Median household income for houses/condos with a mortgage: $97,361
Median household income for apartments without a mortgage: $75,354
Median monthly housing costs: $1,054
Compare current foreclosures near Cape Canaveral, FL:
| Photo | Address | Area | Beds / Baths | Price | Details |
|---|---|---|---|---|---|

|
#1
Monroe Ave
Cape Canaveral, FL 32920
|
1,512 sq. feet
|
2 baths 2 beds |
show details | |

|
#2
Holman Rd
Cape Canaveral, FL 32920
|
1,365 sq. feet
|
2 baths 3 beds |
show details | |

|
#3
Oleander Ct
Cape Canaveral, FL 32920
|
1,178 sq. feet
|
1 baths 2 beds |
show details | |

|
#4
Ocean Garden Ln
Cape Canaveral, FL 32920
|
1,525 sq. feet
|
3 baths 3 beds |
show details | |

|
#5
Tyler Ave
Cape Canaveral, FL 32920
|
1,824 sq. feet
|
- baths 2 beds |
show details | |

|
#6
Adams Ave Apt 10
Cape Canaveral, FL 32920
|
518 sq. feet
|
- baths - beds |
show details | |

|
#7
Columbia Dr Apt 101
Cape Canaveral, FL 32920
|
1,200 sq. feet
|
- baths - beds |
show details | |

|
#8
Ocean Park Ln # V52
Cape Canaveral, FL 32920
|
703 sq. feet
|
- baths - beds |
show details | |

|
#9
N Banana River Blvd Apt 215
Cape Canaveral, FL 32920
|
1,116 sq. feet
|
- baths - beds |
show details | |

|
#10
International Dr Apt 411
Cape Canaveral, FL 32920
|
888 sq. feet
|
- baths - beds |
show details |
| Photo | Address | Area | Beds / Baths | Price | Details |
|---|---|---|---|---|---|

|
#11
Seaport Blvd # T46
Cape Canaveral, FL 32920
|
1,120 sq. feet
|
- baths - beds |
show details | |

|
#12
Polk Ave Apt 1
Cape Canaveral, FL 32920
|
550 sq. feet
|
- baths - beds |
show details | |

|
#13
Polk Ave Apt A16
Cape Canaveral, FL 32920
|
- sq. feet
|
- baths - beds |
show details | |

|
#14
Lincoln Ave
Cape Canaveral, FL 32920
|
- sq. feet
|
- baths - beds |
show details | |

|
#15
Seaport Blvd
Cape Canaveral, FL 32920
|
1,110 sq. feet
|
- baths - beds |
show details | |

|
#16
N Banana River Blvd Apt 1111
Cape Canaveral, FL 32920
|
- sq. feet
|
- baths - beds |
show details | |

|
#17
Cape Shores Cir # 4e
Cape Canaveral, FL 32920
|
1,091 sq. feet
|
- baths - beds |
show details | |

|
#18
Tyler Ave # 6
Cape Canaveral, FL 32920
|
320 sq. feet
|
- baths - beds |
show details | |

|
#19
Chandler St Apt 203
Cape Canaveral, FL 32920
|
- sq. feet
|
- baths - beds |
show details | |

|
#20
Jefferson Ave
Cape Canaveral, FL 32920
|
- sq. feet
|
2 baths - beds |
show details |
| Photo | Address | Area | Beds / Baths | Price | Details |
|---|---|---|---|---|---|

|
#21
Kensington Dr
Cocoa, FL 32922
|
1,388 sq. feet
|
3 baths 3 beds |
$280,000
|
show details |

|
#22
Spencer Ln
Melbourne, FL 32940
|
2,040 sq. feet
|
2 baths 3 beds |
show details | |

|
#23
Fleetwood Pl
Cocoa, FL 32926
|
1,012 sq. feet
|
1 baths 2 beds |
show details | |

|
#24
Duskywing Dr
Rockledge, FL 32955
|
2,535 sq. feet
|
3 baths 3 beds |
show details | |

|
#25
Poinsetta St
Cocoa, FL 32927
|
1,722 sq. feet
|
1 baths 3 beds |
show details | |

|
#26
Finch Dr
Satellite Beach, FL 32937
|
2,394 sq. feet
|
2 baths 3 beds |
show details | |

|
#27
Egret Dr
Satellite Beach, FL 32937
|
1,713 sq. feet
|
1 baths 2 beds |
show details | |

|
#28
Wien Ln
Cocoa, FL 32927
|
2,398 sq. feet
|
2 baths 3 beds |
show details | |

|
#29
Osprey Dr
Melbourne, FL 32940
|
3,003 sq. feet
|
2 baths 3 beds |
show details | |

|
#30
Preston Trl
Melbourne, FL 32940
|
3,416 sq. feet
|
2 baths 4 beds |
show details |
| Photo | Address | Area | Beds / Baths | Price | Details |
|---|---|---|---|---|---|

|
#31
Country Club Dr
Melbourne, FL 32940
|
2,396 sq. feet
|
2 baths 2 beds |
show details | |

|
#32
Egret Lake Way
Melbourne, FL 32940
|
2,506 sq. feet
|
2 baths 3 beds |
show details | |

|
#33
Maple Bluff Cir
Melbourne, FL 32940
|
2,190 sq. feet
|
2 baths 3 beds |
show details | |

|
#34
Willow Ct
Melbourne, FL 32940
|
2,532 sq. feet
|
2 baths 3 beds |
show details | |

|
#35
E Dover St
Satellite Beach, FL 32937
|
2,655 sq. feet
|
2 baths 3 beds |
show details | |

|
#36
Skyway Dr
Cocoa, FL 32927
|
2,485 sq. feet
|
2 baths 3 beds |
show details | |

|
#37
Peppertree St
Cocoa, FL 32926
|
2,255 sq. feet
|
2 baths 3 beds |
show details | |

|
#38
Bracken Ln
Melbourne, FL 32940
|
1,897 sq. feet
|
2 baths 3 beds |
show details | |

|
#39
Bracken Ln
Melbourne, FL 32940
|
1,732 sq. feet
|
2 baths 3 beds |
show details | |

|
#40
Bracken Ln
Melbourne, FL 32940
|
2,152 sq. feet
|
2 baths 3 beds |
show details |
| Photo | Address | Area | Beds / Baths | Price | Details |
|---|---|---|---|---|---|

|
#41
Spring Valley Dr
Melbourne, FL 32940
|
1,845 sq. feet
|
2 baths 3 beds |
show details | |

|
#42
Curtis Blvd
Cocoa, FL 32927
|
2,406 sq. feet
|
2 baths 3 beds |
show details | |

|
#43
Rossmoor Cir
Melbourne, FL 32940
|
3,395 sq. feet
|
2 baths 4 beds |
show details | |

|
#44
Ayrshire Cir
Melbourne, FL 32940
|
4,296 sq. feet
|
3 baths 4 beds |
show details | |

|
#45
Juper Rd
Cocoa, FL 32927
|
2,338 sq. feet
|
2 baths 3 beds |
show details | |

|
#46
Hibiscus St
Cocoa, FL 32927
|
2,296 sq. feet
|
2 baths 3 beds |
show details | |

|
#47
Arroyo Dr
Melbourne, FL 32940
|
4,374 sq. feet
|
4 baths 4 beds |
show details | |

|
#48
Glover St
Cocoa, FL 32927
|
1,782 sq. feet
|
2 baths 3 beds |
show details | |

|
#49
Seville Ave
Cocoa, FL 32926
|
1,316 sq. feet
|
1 baths 3 beds |
show details | |

|
Check over 1 million property listings on Foreclosure.com!
|
browse all offers | |||


 | What is currently going on with the real estate market in Brevard? (333 replies) |
| Last minute Pool Home rental (12 replies) |
| Real estate telling me beachside rental 1500 and up is that true? (4 replies) |
| Is there a real estate bubble in Brevard and is it ready to pop. (35 replies) |
| Considering moving to Cocoa Beach (11 replies) |
| Best source for Brevard County updated Covid-19 info? (85 replies) |

Median year apartment built: 1977
Household type by relationship:
Households: 10,306- Male householders: 3,541 (1,661 living alone), Female householders: 2,423 (1,283 living alone)
1,943 spouses (1,902 opposite-sex spouses), 649 unmarried partners, (616 opposite-sex unmarried partners), 1,031 children (954 natural, 7 adopted, 70 stepchildren), 104 grandchildren, 137 brothers or sisters, 155 parents, 0 foster children, 52 other relatives, 266 non-relatives
Size of family households: 1,927 2-persons, 418 3-persons, 189 4-persons, 11 6-persons, 9 7-or-more-persons.
Size of nonfamily households: 2,888 1-person, 519 2-persons, 19 3-persons.
164 married couples with children.
406 single-parent households (132 men, 274 women).
90.9% of residents of Cape Canaveral speak English at home.
3.3% of residents speak Spanish at home (60% speak English very well, 32% speak English well, 8% speak English not well).
5.0% of residents speak other Indo-European language at home (58% speak English very well, 39% speak English well, 3% speak English not well).
0.8% of residents speak Asian or Pacific Island language at home (54% speak English very well, 17% speak English well, 29% speak English not well).
0.1% of residents speak other language at home (100% speak English very well).
Foreign born population: 788 (7.6%)
(64.2% of them are naturalized citizens)
| Here: | 4.9 |
| State: | 5.9 |
| Here: | 3.6 |
| State: | 4.2 |

- Bedrooms in owner-occupied houses and condos in Cape Canaveral, Florida
- 142no bedroom
- 2841 bedroom
- 1,4782 bedrooms
- 1,5513 bedrooms
- 2004 bedrooms
- 225+ bedrooms

- Bedrooms in renter-occupied apartments in Cape Canaveral, Florida
- 159no bedroom
- 8021 bedroom
- 1,1112 bedrooms
- 2003 bedrooms
- 384 bedrooms
- 05+ bedrooms

- Cars and other vehicles available in Cape Canaveral in owner-occupied houses/condos
- 86no vehicle
- 1,6311 vehicle
- 1,6652 vehicles
- 2053 vehicles
- 904 vehicles
- 05+ vehicles

- Cars and other vehicles available in Cape Canaveral in renter-occupied apartments
- 313no vehicle
- 1,3001 vehicle
- 6692 vehicles
- 293 vehicles
- 04 vehicles
- 05+ vehicles

- Rooms in owner-occupied houses in Cape Canaveral, Florida
- 1291 room
- 622 rooms
- 3783 rooms
- 7594 rooms
- 1,1015 rooms
- 4956 rooms
- 4867 rooms
- 888 rooms
- 1799+ rooms

- Rooms in renter-occupied apartments in Cape Canaveral, Florida
- 1391 room
- 4242 rooms
- 4963 rooms
- 6094 rooms
- 4975 rooms
- 1106 rooms
- 277 rooms
- 108 rooms
- 09+ rooms


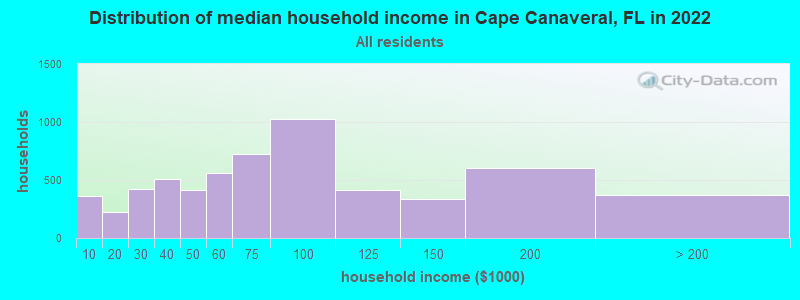
Cape Canaveral, FL household income distribution

- 366Less than $10,000
- 222$10,000 to $19,999
- 420$20,000 to $29,999
- 512$30,000 to $39,999
- 411$40,000 to $49,999
- 560$50,000 to $59,999
- 728$60,000 to $74,999
- 1,025$75,000 to $99,999
- 416$100,000 to $124,999
- 338$125,000 to $149,999
- 603$150,000 to $199,999
- 368$200,000 or more
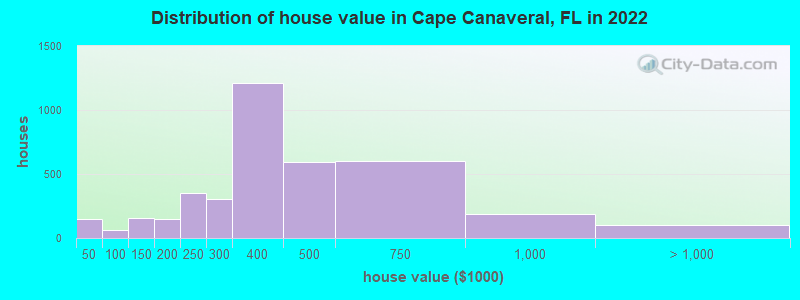
Home value of owner - occupied houses in 2022 in Cape Canaveral, FL
-
- 56Less than $10,000
- 22$10,000 to $14,999
- 36$15,000 to $19,999
- 31$20,000 to $24,999
- 4$40,000 to $49,999
- 11$50,000 to $59,999
- 11$60,000 to $69,999
- 22$80,000 to $89,999
- 13$90,000 to $99,999
- 68$100,000 to $124,999
- 86$125,000 to $149,999
- 76$150,000 to $174,999
- 69$175,000 to $199,999
- 351$200,000 to $249,999
- 304$250,000 to $299,999
- 1,210$300,000 to $399,999
- 592$400,000 to $499,999
- 601$500,000 to $749,999
- 188$750,000 to $999,999
- 89$1,000,000 to $1,499,999
- 11$2,000,000 or more
Rent paid by renters in 2022 in Cape Canaveral, FL
-
- 7$350 to $399
- 9$400 to $449
- 25$450 to $499
- 15$500 to $549
- 9$550 to $599
- 9$600 to $649
- 254$650 to $699
- 217$700 to $749
- 250$750 to $799
- 157$800 to $899
- 230$900 to $999
- 246$1,000 to $1,249
- 233$1,250 to $1,499
- 302$1,500 to $1,999
- 117$2,000 to $2,499
- 49$2,500 to $2,999
- 21$3,000 to $3,499
- 61No cash rent

Percentage of workers working in this county: 89.2%
Number of people working at home: 1,360 (24.9% of all workers)
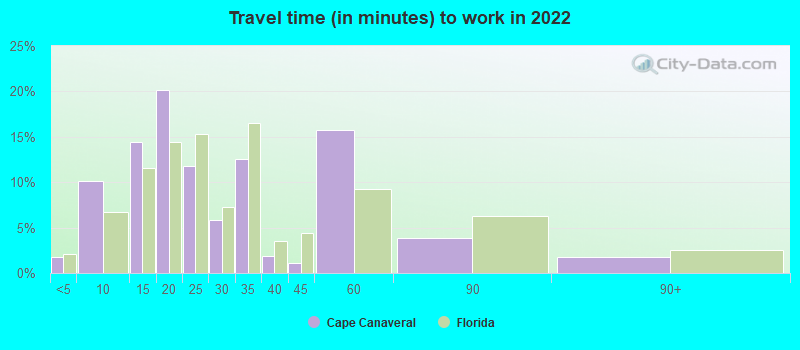
Travel time to work (commute)
- Less than 5 minutes: 134
- 5 to 9 minutes: 660
- 10 to 14 minutes: 784
- 15 to 19 minutes: 522
- 20 to 24 minutes: 441
- 25 to 29 minutes: 193
- 30 to 34 minutes: 371
- 35 to 39 minutes: 297
- 40 to 44 minutes: 193
- 45 to 59 minutes: 471
- 60 to 89 minutes: 141
- 90 or more minutes: 46
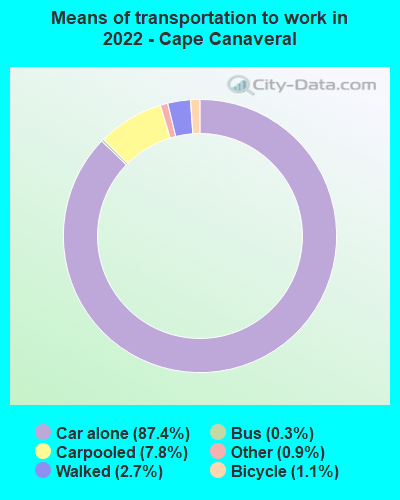
Means of transportation to work:
- Drove a car alone: 3,156 (65.1%)
- Carpooled: 289 (6.0%)
- Bus: 16 (0.3%)
- Taxi: 44 (0.9%)
- Bicycle: 36 (0.7%)
- Walked: 107 (2.2%)
- Worked at home: 1,360 (28.0%)
- Unemployment by race in 2022
- Unemployment rate for White non-Hispanic residents
- 3.5%Males
- 1.8%Females

- Year of entry for the foreign-born population in Cape Canaveral, Florida
- 1982010 or later
- 1472000 to 2009
- 1151990 to 1999
- 1021980 to 1989
- 811970 to 1979
- 309Before 1970
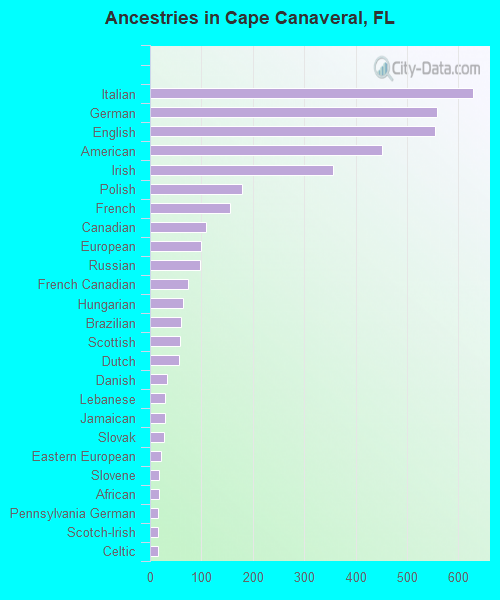
First ancestries reported:
- Italian: 628 (14.8%)
- German: 558 (13.2%)
- English: 554 (13.1%)
- American: 451 (10.6%)
- Irish: 356 (8.4%)
- Polish: 179 (4.2%)
- French: 155 (3.7%)
- Canadian: 108 (2.5%)
- European: 100 (2.4%)
- Russian: 98 (2.3%)
- French Canadian: 74 (1.7%)
- Hungarian: 64 (1.5%)
- Brazilian: 61 (1.4%)
- Scottish: 58 (1.4%)
- Dutch: 57 (1.3%)
- Danish: 33 (0.8%)
- Lebanese: 30 (0.7%)
- Jamaican: 30 (0.7%)
- Slovak: 28 (0.7%)
- Eastern European: 22 (0.5%)
- Slovene: 18 (0.4%)
- African: 17 (0.4%)
- Pennsylvania German: 16 (0.4%)
- Scotch-Irish: 16 (0.4%)
- Celtic: 15 (0.4%)
- Czechoslovakian: 13 (0.3%)
- Swedish: 13 (0.3%)
- Haitian: 12 (0.3%)
- Portuguese: 11 (0.3%)
- Belgian: 10 (0.2%)
- Czech: 9 (0.2%)
- Finnish: 9 (0.2%)
- Scandinavian: 9 (0.2%)
- British: 6 (0.1%)
Most common places of birth for foreign-born residents (%):
| Cape Canaveral: | 13.0% (96) |
| Florida: | 0.7% (30,755) |
| Cape Canaveral: | 12.1% (90) |
| Florida: | 2.4% (109,132) |
| Cape Canaveral: | 9.9% (73) |
| Florida: | 1.2% (54,272) |
| Cape Canaveral: | 8.2% (61) |
| Florida: | 0.2% (9,421) |
| Cape Canaveral: | 6.2% (46) |
| Florida: | 0.6% (25,219) |
| Cape Canaveral: | 5.8% (43) |
| Florida: | 5.0% (227,319) |
| Cape Canaveral: | 5.1% (38) |
| Florida: | 5.6% (257,152) |
| Cape Canaveral: | 5.0% (37) |
| Florida: | 0.2% (9,990) |
| Cape Canaveral: | 4.5% (33) |
| Florida: | 2.7% (122,906) |
| Cape Canaveral: | 4.2% (31) |
| Florida: | 1.8% (84,403) |
| Cape Canaveral: | 3.4% (25) |
| Florida: | 6.5% (298,669) |
| Cape Canaveral: | 2.8% (21) |
| Florida: | 0.4% (16,570) |
| Cape Canaveral: | 2.4% (18) |
| Florida: | 1.2% (56,071) |
| Cape Canaveral: | 2.2% (16) |
| Florida: | 0.0% (2,155) |
| Cape Canaveral: | 1.8% (13) |
| Florida: | 0.4% (19,445) |
| Cape Canaveral: | 1.6% (12) |
| Florida: | 0.2% (9,122) |
Place of birth for U.S.-born residents:
- This state: 1,616
- Other state: 7,742
- Northeast: 3,637
- Midwest: 1,980
- South: 1,552
- West: 592
85.5% of Cape Canaveral residents lived in the same house 1 years ago.
Out of people who lived in different houses, 37.0% lived in this county.
Out of people who lived in different counties, 40.5% lived in Florida.
| Cape Canaveral: | 85.5% |
| State average: | 86.3% |
Education attainment for males 25 years and older:
- No schooling: 94
- Nursery to 4th grade: 0
- 5th and 6th grade: 0
- 7th and 8th grade: 34
- 9th grade: 30
- 10th grade: 0
- 11th grade: 42
- 12th grade, no diploma: 69
- High school graduate (or equivalency): 1,021
- Less than 1 year of college: 307
- Some college more than 1 year, no degree: 944
- Associate degree: 257
- Bachelor's degree: 1,195
- Master's degree: 601
- Professional school degree: 106
- Doctorate degree: 169

Education attainment for females 25 years and older:
- No schooling: 6
- Nursery to 4th grade: 6
- 5th and 6th grade: 0
- 7th and 8th grade: 29
- 9th grade: 3
- 10th grade: 6
- 11th grade: 8
- 12th grade, no diploma: 97
- High school graduate (or equivalency): 1,258
- Less than 1 year of college: 338
- Some college more than 1 year, no degree: 649
- Associate degree: 437
- Bachelor's degree: 1,133
- Master's degree: 380
- Professional school degree: 54
- Doctorate degree: 66


Housing units in structures:
- One, detached: 771
- One, attached: 961
- Two: 495
- 3 or 4: 736
- 5 to 9: 1,093
- 10 to 19: 1,560
- 20 to 49: 2,181
- 50 or more: 802
- Mobile homes: 432
- Boats, RVs, vans, etc.: 76
Median worth of mobile homes: $11,849
Housing units lacking complete kitchen facilities in 2022: 1.0%
House/condo owner moved in on average 8 years ago
Renter moved in on average 2 years ago

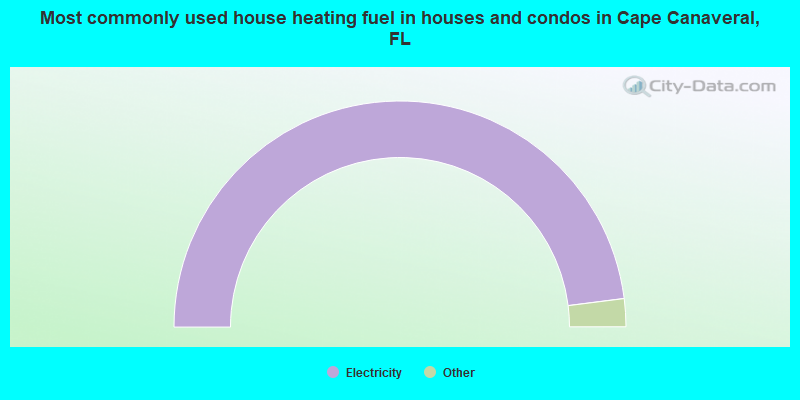
- 96.0%Electricity
- 2.8%Utility gas
- 0.8%Bottled, tank, or LP gas
- 0.4%No fuel used
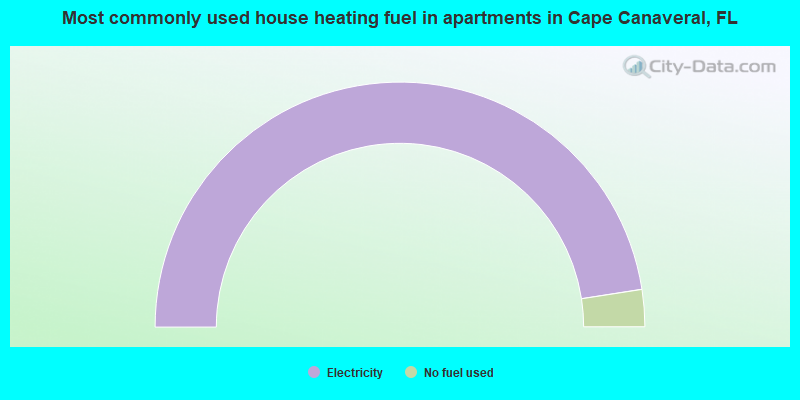
- 95.1%Electricity
- 4.9%No fuel used
Private vs. public school enrollment:
| Here: | 0.0% |
| Florida: | 15.8% |
| Here: | 6.0% |
| Florida: | 12.9% |
| Here: | 29.2% |
| Florida: | 23.6% |


