Caldwell, NJ (New Jersey) Houses and Residents
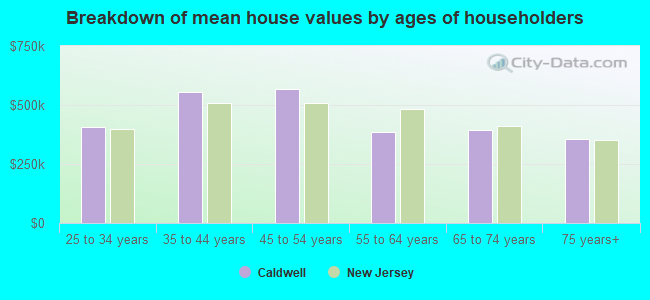
| Caldwell: | $573,303 |
| New Jersey: | $428,900 |
Total population: 7,362 (All urban)
Houses: 3,396 (3,311 occupied: 1,643 owner occupied, 1,668 renter occupied)
| % of renters here: | 50% |
| State: | 35% |
Housing density: 2,864 houses/condos per square mile
Median price asked for vacant for-sale houses and condos in 2022 in this county: $231,294.
Median contract rent in 2022: $1,709 (lower quartile is $1,420, upper quartile is over $2,000)
Median rent asked for vacant for-rent units in 2022: $1,899
Median gross rent in Caldwell, NJ in 2022: $1,844
Housing units in Caldwell with a mortgage: 895 (109 second mortgage, 81 home equity loan, 0 both second mortgage and home equity loan)
Houses without a mortgage: 354
Compare current foreclosures in Caldwell, NJ:
| Photo | Address | Area | Beds / Baths | Price | Details |
|---|---|---|---|---|---|

|
#1
Linwood Ter
Caldwell, NJ 07006
|
2,486 sq. feet
|
- baths - beds |
show details | |

|
#2
Orton Rd
Caldwell, NJ 07006
|
2,755 sq. feet
|
- baths - beds |
show details | |

|
#3
Green Pl
Caldwell, NJ 07006
|
- sq. feet
|
- baths - beds |
show details | |

|
#4
Pine Tree Pl
Caldwell, NJ 07006
|
2,028 sq. feet
|
- baths - beds |
show details | |

|
#5
Park Ave
Caldwell, NJ 07006
|
1,505 sq. feet
|
- baths - beds |
show details | |

|
#6
Mountain Ave
Caldwell, NJ 07006
|
1,977 sq. feet
|
- baths - beds |
show details | |

|
#7
Westville Ave
Caldwell, NJ 07006
|
1,316 sq. feet
|
- baths - beds |
show details | |

|
#8
Pine Tree Pl
Caldwell, NJ 07006
|
2,028 sq. feet
|
- baths - beds |
show details | |

|
#9
Bloomfield Ave Apt 3g
Caldwell, NJ 07006
|
- sq. feet
|
- baths - beds |
show details | |

|
#10
Orton Rd
Caldwell, NJ 07006
|
1,348 sq. feet
|
- baths - beds |
show details |
| Photo | Address | Area | Beds / Baths | Price | Details |
|---|---|---|---|---|---|

|
#11
Dedrick Pl # Cn2285
Caldwell, NJ 07006
|
- sq. feet
|
- baths - beds |
show details | |

|
#12
Westover Ave Apt B19
Caldwell, NJ 07006
|
- sq. feet
|
- baths - beds |
show details | |

|
#13
Debaun Ave
Caldwell, NJ 07006
|
1,867 sq. feet
|
- baths - beds |
show details | |

|
#14
Francisco Ave
Caldwell, NJ 07006
|
1,652 sq. feet
|
- baths - beds |
show details | |

|
#15
Henry Ave
Caldwell, NJ 07006
|
- sq. feet
|
- baths - beds |
show details | |

|
#16
Deerfield Rd
Caldwell, NJ 07006
|
1,688 sq. feet
|
- baths - beds |
show details | |

|
#17
Richland Ave
Caldwell, NJ 07006
|
- sq. feet
|
- baths - beds |
show details | |

|
#18
Woodrow Pl
Caldwell, NJ 07006
|
1,356 sq. feet
|
- baths - beds |
show details | |

|
#19
Westover Ave
Caldwell, NJ 07006
|
1,632 sq. feet
|
- baths - beds |
show details | |

|
#20
Beekman Hill Rd
Caldwell, NJ 07006
|
- sq. feet
|
- baths - beds |
show details |
| Photo | Address | Area | Beds / Baths | Price | Details |
|---|---|---|---|---|---|

|
#21
Bloomfield Ave
Caldwell, NJ 07006
|
1,216 sq. feet
|
- baths - beds |
show details | |

|
#22
Francine Ave
Caldwell, NJ 07006
|
- sq. feet
|
- baths - beds |
show details | |

|
#23
Woodmere Rd
Caldwell, NJ 07006
|
- sq. feet
|
- baths - beds |
show details | |

|
#24
Hillcrest Pl
Caldwell, NJ 07006
|
- sq. feet
|
- baths - beds |
show details | |

|
#25
Johnson Ave
Caldwell, NJ 07006
|
- sq. feet
|
- baths - beds |
show details | |

|
#26
Central Ave
Caldwell, NJ 07006
|
- sq. feet
|
- baths - beds |
show details | |

|
#27
Central Ave
Caldwell, NJ 07006
|
- sq. feet
|
- baths - beds |
show details | |

|
#28
Central Ave
Caldwell, NJ 07006
|
- sq. feet
|
- baths - beds |
show details | |

|
#29
Green Pl
Caldwell, NJ 07006
|
- sq. feet
|
- baths - beds |
show details | |

|
#30
Skyline Dr
Caldwell, NJ 07006
|
- sq. feet
|
- baths - beds |
show details |
| Photo | Address | Area | Beds / Baths | Price | Details |
|---|---|---|---|---|---|

|
#31
Richard Ave
Caldwell, NJ 07006
|
- sq. feet
|
- baths - beds |
show details | |

|
#32
Westview Rd
Caldwell, NJ 07006
|
- sq. feet
|
- baths - beds |
show details | |

|
#33
Forest Ave
Caldwell, NJ 07006
|
- sq. feet
|
- baths - beds |
show details | |

|
Check over 1 million property listings on Foreclosure.com!
|
browse all offers | |||

Latest news about housing in Caldwell, NJ collected exclusively by city-data.com from local newspapers, TV, and radio stations

 | Housing Market is going nuts (78 replies) |
| Caldwell/Verona Apartments? (7 replies) |
| Houses for rent in Northern NJ (7 replies) |
| Home under 400k in the Caldwells, even possible? (15 replies) |
| New home hunters - help please! (22 replies) |
| Prospective queens ny home buyers looking for single family home north nj need help (21 replies) |

Household type by relationship:
Households: 760,197- In family households: 645,040 (104,343 male householders, 84,996 female householders)
113,673 spouses, 245,726 children (232,723 natural, 5,793 adopted, 7,210 stepchildren), 20,627 grandchildren, 15,422 brothers or sisters, 11,923 parents, foster children, 19,910 other relatives, 22,762 non-relatives
- In nonfamily households: 115,157 (42,135 male householders (33,262 living alone)), 52,238 female householders (45,266 living alone)), 20,784 nonrelatives
- In group quarters: 23,772 (12,126 institutionalized population)
108,634 married couples with children.
65,899 single-parent households (10,059 men, 55,840 women).
85.1% of residents of Caldwell speak English at home.
3.9% of residents speak Spanish at home (78% speak English very well, 10% speak English well, 5% speak English not well, 6% don't speak English at all).
7.2% of residents speak other Indo-European language at home (71% speak English very well, 21% speak English well, 8% speak English not well).
3.0% of residents speak Asian or Pacific Island language at home (47% speak English very well, 39% speak English well, 14% speak English not well).
0.8% of residents speak other language at home (70% speak English very well, 30% speak English not well).
Foreign born population: 1,374 (16.9%)
(51.6% of them are naturalized citizens)
| Here: | 6.7 |
| State: | 6.8 |
| Here: | 4.1 |
| State: | 3.9 |
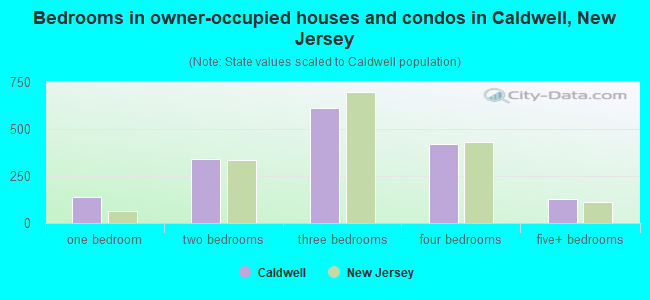
- Bedrooms in owner-occupied houses and condos in Caldwell, New Jersey
- 0no bedroom
- 1391 bedroom
- 3422 bedrooms
- 6113 bedrooms
- 4224 bedrooms
- 1295+ bedrooms
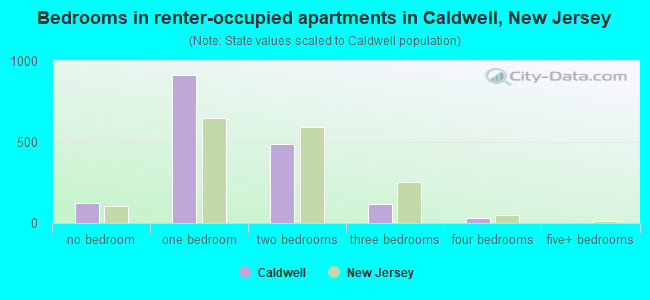
- Bedrooms in renter-occupied apartments in Caldwell, New Jersey
- 121no bedroom
- 9131 bedroom
- 4862 bedrooms
- 1203 bedrooms
- 284 bedrooms
- 05+ bedrooms
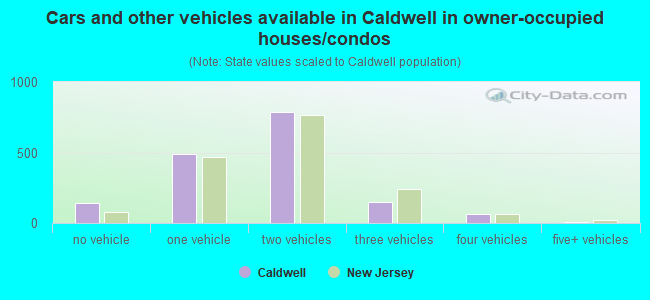
- Cars and other vehicles available in Caldwell in owner-occupied houses/condos
- 140no vehicle
- 4901 vehicle
- 7892 vehicles
- 1523 vehicles
- 654 vehicles
- 75+ vehicles
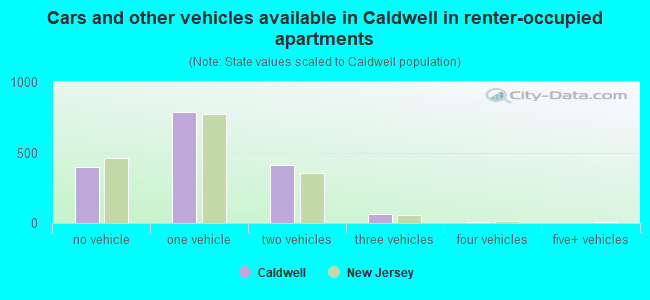
- Cars and other vehicles available in Caldwell in renter-occupied apartments
- 394no vehicle
- 7901 vehicle
- 4122 vehicles
- 643 vehicles
- 84 vehicles
- 05+ vehicles
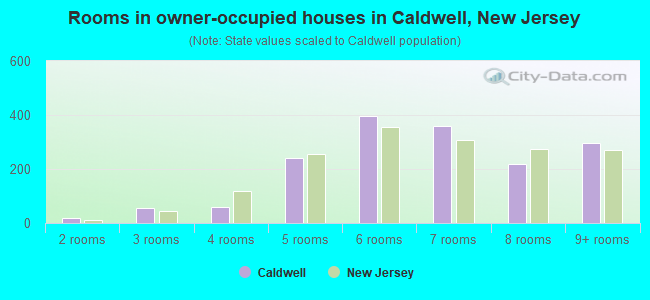
- Rooms in owner-occupied houses in Caldwell, New Jersey
- 01 room
- 182 rooms
- 573 rooms
- 594 rooms
- 2405 rooms
- 3966 rooms
- 3587 rooms
- 2198 rooms
- 2969+ rooms
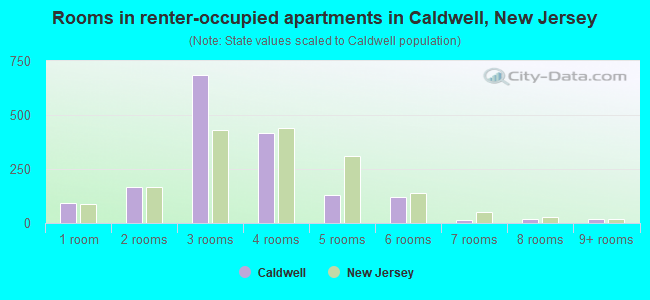
- Rooms in renter-occupied apartments in Caldwell, New Jersey
- 921 room
- 1662 rooms
- 6873 rooms
- 4184 rooms
- 1315 rooms
- 1216 rooms
- 167 rooms
- 208 rooms
- 179+ rooms
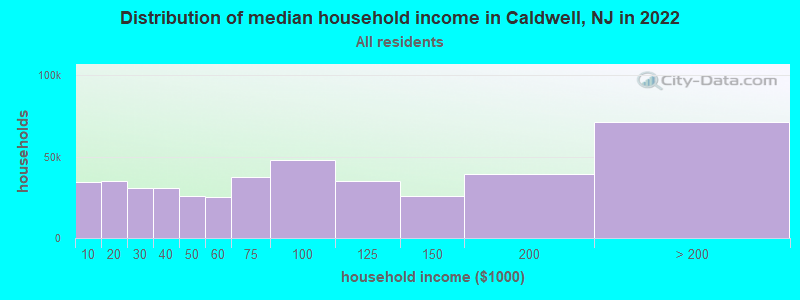
Caldwell, NJ household income distribution

- 34,501Less than $10,000
- 35,042$10,000 to $19,999
- 30,910$20,000 to $29,999
- 30,618$30,000 to $39,999
- 25,710$40,000 to $49,999
- 25,072$50,000 to $59,999
- 37,146$60,000 to $74,999
- 48,121$75,000 to $99,999
- 34,758$100,000 to $124,999
- 25,829$125,000 to $149,999
- 39,046$150,000 to $199,999
- 71,213$200,000 or more
Percentage of workers working in this county: 51.5%
Number of people working at home: 808 (15.4% of all workers)
Travel time to work (commute)
- Less than 5 minutes: 98
- 5 to 9 minutes: 552
- 10 to 14 minutes: 422
- 15 to 19 minutes: 493
- 20 to 24 minutes: 643
- 25 to 29 minutes: 290
- 30 to 34 minutes: 592
- 35 to 39 minutes: 212
- 40 to 44 minutes: 169
- 45 to 59 minutes: 218
- 60 to 89 minutes: 291
- 90 or more minutes: 134
Means of transportation to work:
- Drove a car alone: 3,401 (80.1%)
- Carpooled: 302 (7.1%)
- Bus or trolley bus: 119 (2.8%)
- Subway or elevated: 15 (0.4%)
- Railroad: 61 (1.4%)
- Bicycle: 9 (0.2%)
- Walked: 198 (4.7%)
- Other means: 9 (0.2%)
- Worked at home: 133 (3.1%)
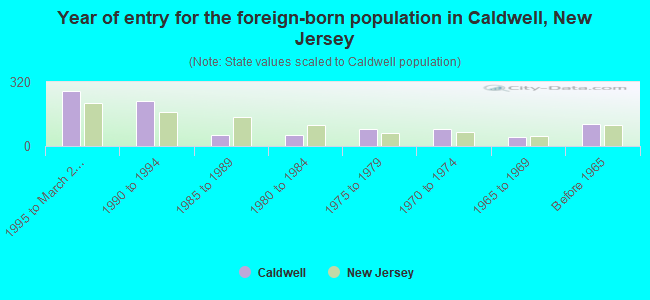
- Year of entry for the foreign-born population in Caldwell, New Jersey
- 2761995 to March 2000
- 2241990 to 1994
- 551985 to 1989
- 541980 to 1984
- 831975 to 1979
- 851970 to 1974
- 431965 to 1969
- 108Before 1965
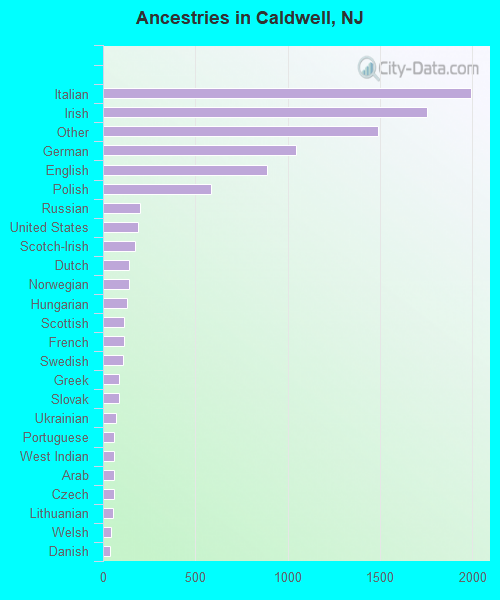
First ancestries reported:
- Italian: 1,991 (20.5%)
- Irish: 1,753 (18.0%)
- Other: 1,490 (15.3%)
- German: 1,046 (10.8%)
- English: 886 (9.1%)
- Polish: 587 (6.0%)
- Russian: 200 (2.1%)
- United States: 192 (2.0%)
- Scotch-Irish: 176 (1.8%)
- Dutch: 141 (1.5%)
- Norwegian: 139 (1.4%)
- Hungarian: 128 (1.3%)
- Scottish: 114 (1.2%)
- French: 113 (1.2%)
- Swedish: 109 (1.1%)
- Greek: 87 (0.9%)
- Slovak: 87 (0.9%)
- Ukrainian: 68 (0.7%)
- Portuguese: 60 (0.6%)
- West Indian: 58 (0.6%)
- Arab: 57 (0.6%)
- Czech: 57 (0.6%)
- Lithuanian: 54 (0.6%)
- Welsh: 42 (0.4%)
- Danish: 38 (0.4%)
- Subsaharan African: 16 (0.2%)
- Swiss: 15 (0.2%)
- French Canadian: 8 (0.08%)
Most common places of birth for foreign-born residents (%):
| Caldwell: | 11.4% (106) |
| New Jersey: | 8.1% (119,497) |
| Caldwell: | 11.2% (104) |
| New Jersey: | 2.1% (30,355) |
| Caldwell: | 8.6% (80) |
| New Jersey: | 3.8% (55,466) |
| Caldwell: | 6.6% (61) |
| New Jersey: | 0.8% (12,383) |
| Caldwell: | 4.0% (37) |
| New Jersey: | 1.2% (17,746) |
| Caldwell: | 3.3% (31) |
| New Jersey: | 1.2% (17,647) |
| Caldwell: | 3.2% (30) |
| New Jersey: | 1.4% (20,079) |
| Caldwell: | 3.1% (29) |
| New Jersey: | 0.9% (13,289) |
| Caldwell: | 3.0% (28) |
| New Jersey: | 0.4% (5,697) |
| Caldwell: | 3.0% (28) |
| New Jersey: | 1.2% (18,066) |
| Caldwell: | 3.0% (28) |
| New Jersey: | 3.5% (51,970) |
| Caldwell: | 2.9% (27) |
| New Jersey: | 1.0% (14,768) |
| Caldwell: | 2.8% (26) |
| New Jersey: | 4.0% (58,395) |
| Caldwell: | 2.6% (24) |
| New Jersey: | 0.8% (12,403) |
| Caldwell: | 2.4% (22) |
| New Jersey: | 4.6% (67,667) |
| Caldwell: | 2.3% (21) |
| New Jersey: | 0.4% (6,115) |
| Caldwell: | 2.3% (21) |
| New Jersey: | 0.8% (11,245) |
| Caldwell: | 2.3% (21) |
| New Jersey: | 0.7% (9,606) |
| Caldwell: | 2.2% (20) |
| New Jersey: | 2.7% (40,092) |
| Caldwell: | 1.9% (18) |
| New Jersey: | 3.7% (55,241) |
| Caldwell: | 1.5% (14) |
| New Jersey: | 0.6% (8,266) |
Place of birth for U.S.-born residents:
- This state: 4,796
- Other state: 1,829
- Northeast: 1,319
- Midwest: 169
- South: 258
- West: 83
57% of Caldwell residents lived in the same house 5 years ago.
Out of people who lived in different houses, 54% lived in this county.
Out of people who lived in different counties, 72% lived in New Jersey.
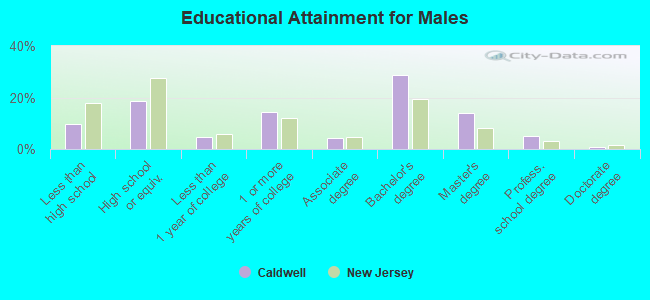
Education attainment for males 25 years and older:
- No schooling: 7
- Nursery to 4th grade: 0
- 5th and 6th grade: 31
- 7th and 8th grade: 27
- 9th grade: 29
- 10th grade: 36
- 11th grade: 23
- 12th grade, no diploma: 87
- High school graduate (or equivalency): 461
- Less than 1 year of college: 111
- Some college more than 1 year, no degree: 361
- Associate degree: 106
- Bachelor's degree: 710
- Master's degree: 351
- Professional school degree: 122
- Doctorate degree: 20
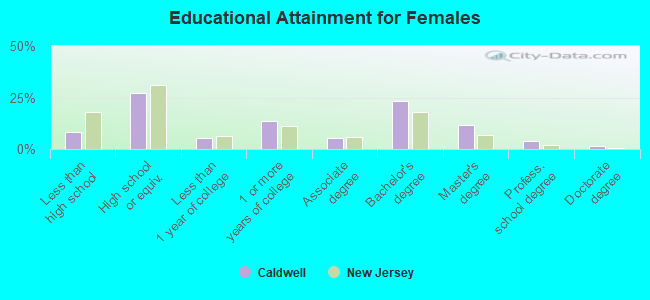
Education attainment for females 25 years and older:
- No schooling: 7
- Nursery to 4th grade: 18
- 5th and 6th grade: 10
- 7th and 8th grade: 53
- 9th grade: 20
- 10th grade: 32
- 11th grade: 25
- 12th grade, no diploma: 83
- High school graduate (or equivalency): 839
- Less than 1 year of college: 163
- Some college more than 1 year, no degree: 421
- Associate degree: 159
- Bachelor's degree: 718
- Master's degree: 357
- Professional school degree: 113
- Doctorate degree: 47


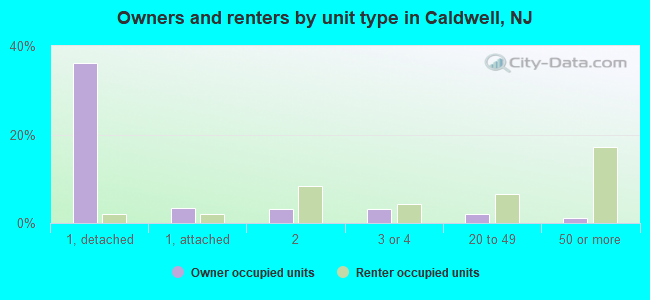
Housing units in structures:
- One, detached: 1,276
- One, attached: 175
- Two: 399
- 3 or 4: 256
- 5 to 9: 211
- 10 to 19: 161
- 20 to 49: 284
- 50 or more: 634
Housing units lacking complete kitchen facilities: 1.6%
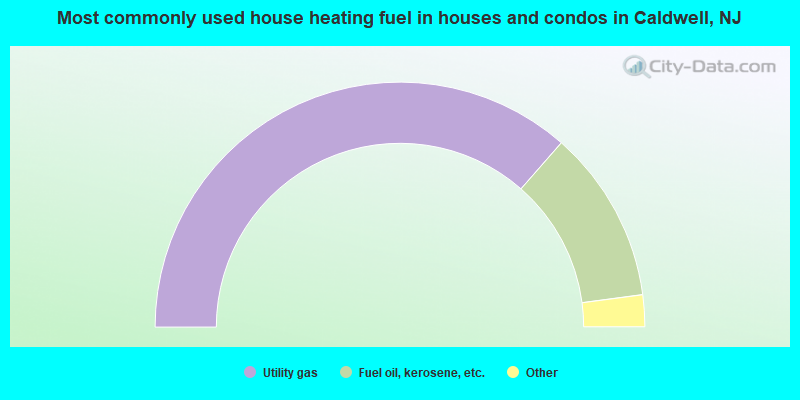
- 72.9%Utility gas
- 22.9%Fuel oil, kerosene, etc.
- 2.7%Electricity
- 1.0%Bottled, tank, or LP gas
- 0.4%Wood
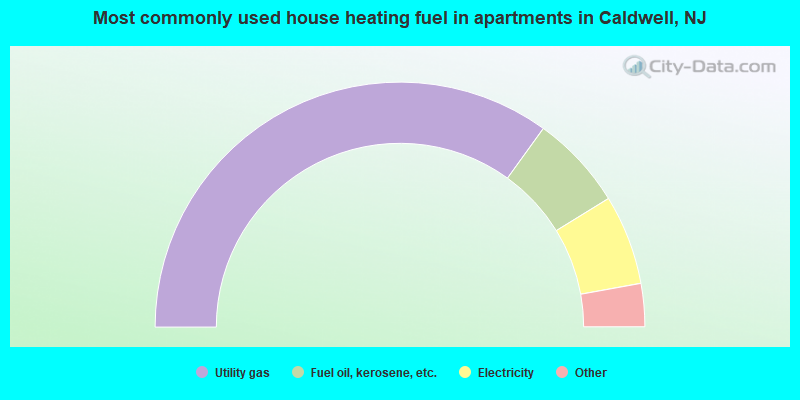
- 70.0%Utility gas
- 12.5%Fuel oil, kerosene, etc.
- 11.9%Electricity
- 2.8%Bottled, tank, or LP gas
- 1.7%Other fuel
- 0.6%Coal or coke
- 0.6%No fuel used
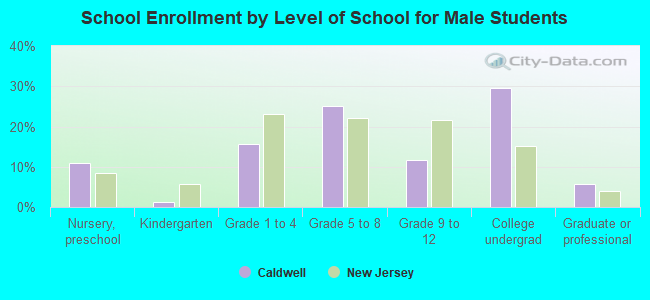
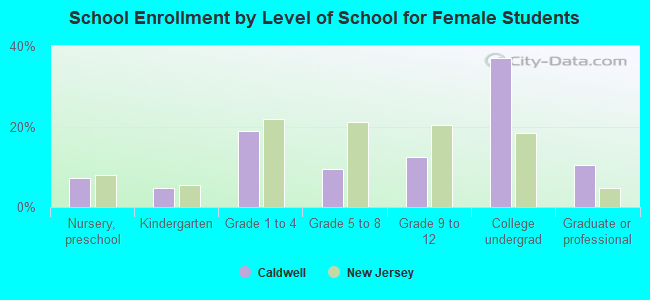
Private vs. public school enrollment:
| Here: | 13.8% |
| New Jersey: | 13.2% |
| Here: | 3.2% |
| New Jersey: | 13.0% |
| Here: | 75.3% |
| New Jersey: | 30.1% |