Housing density: 2,577 houses/condos per square mile
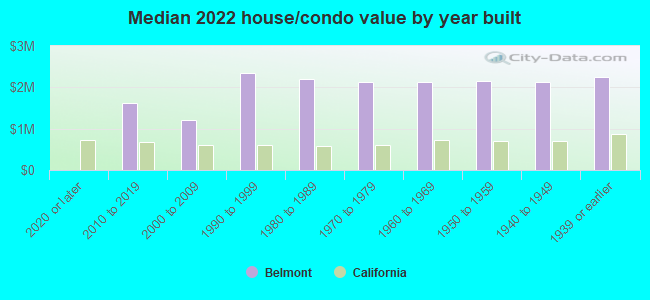
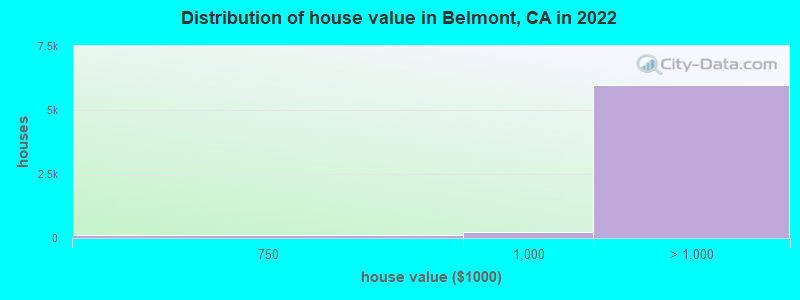
Median price asked for vacant for-sale houses and condos in 2022: $4,320,860.
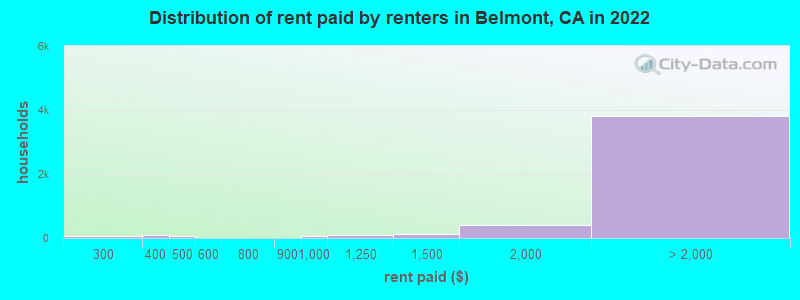
Median contract rent in 2022: over $2,000 (lower quartile is over $2,000, upper quartile is over $2,000)
Median rent asked for vacant for-rent units in 2022: $4,312
Median gross rent in Belmont, CA in 2022: over $2,000
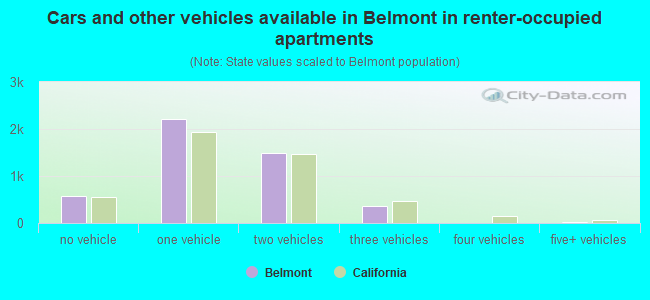
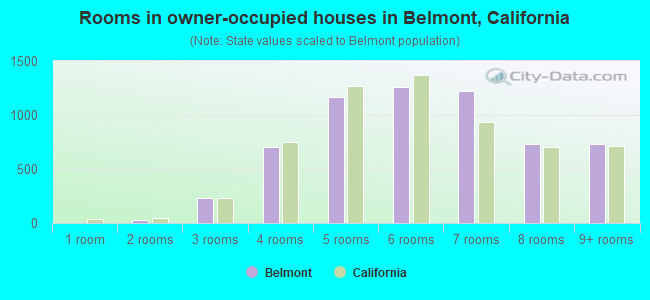
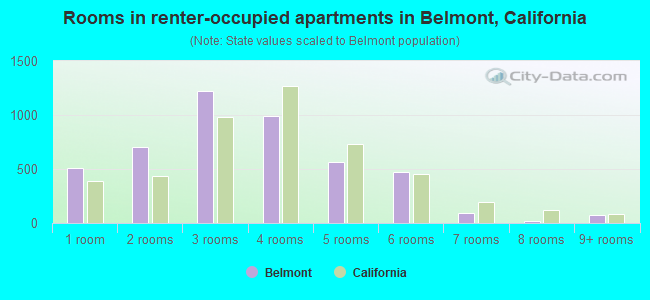
Housing units in Belmont with a mortgage: 4,094 (619 second mortgage, 28 home equity loan, 514 both second mortgage and home equity loan) Houses without a mortgage: 25
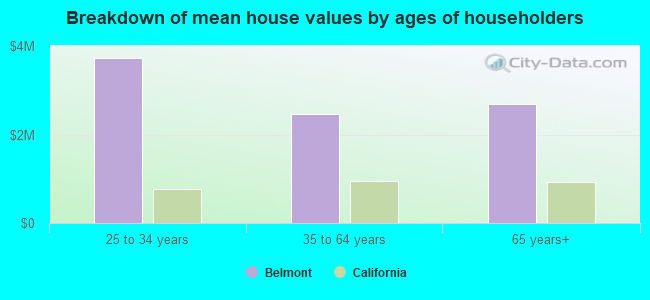
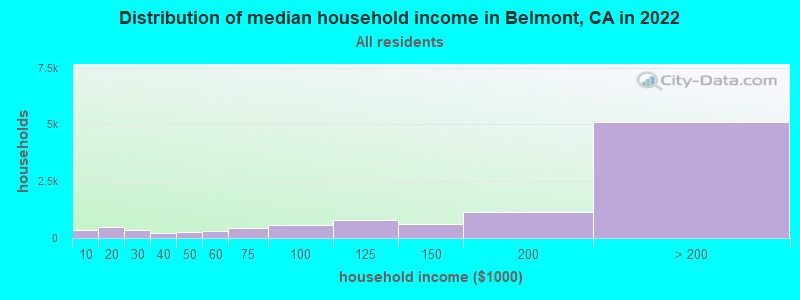
Median household income for houses/condos with a mortgage: $258,196
Median household income for apartments without a mortgage: $162,153
5,033 married couples with children.
763 single-parent households (240 men, 523 women).
65.4% of residents of Belmont speak English at home.
7.3% of residents speak Spanish at home (79% speak English very well, 14% speak English well, 5% speak English not well, 2% don't speak English at all).
10.0% of residents speak other Indo-European language at home (83% speak English very well, 13% speak English well, 4% speak English not well).
16.4% of residents speak Asian or Pacific Island language at home (75% speak English very well, 17% speak English well, 7% speak English not well, 1% don't speak English at all).
0.9% of residents speak other language at home (52% speak English very well, 17% speak English well, 31% speak English not well).
Foreign born population: 8,157 (30.3%)
(57.3% of them are naturalized citizens)
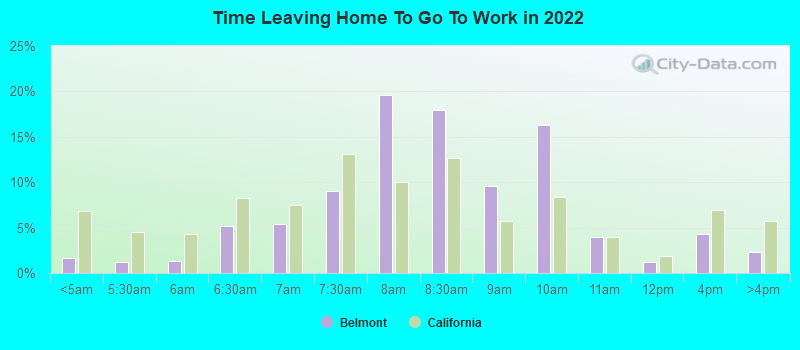
Percentage of workers working in this county: 80.8% Number of people working at home: 5,092 (37.3% of all workers)
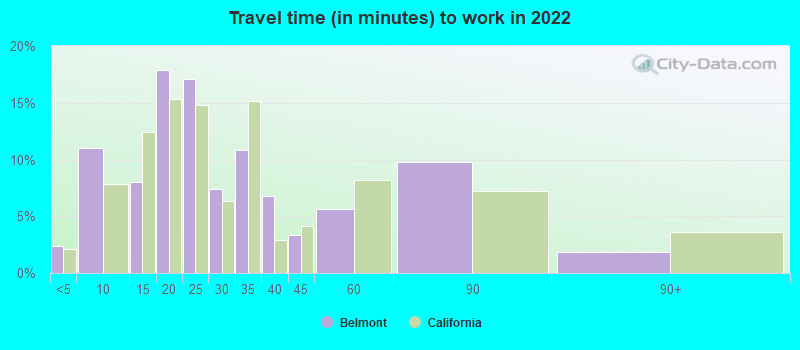
Travel time to work (commute)
Less than 5 minutes: 89
5 to 9 minutes: 667
10 to 14 minutes: 1,436
15 to 19 minutes: 1,330
20 to 24 minutes: 1,378
25 to 29 minutes: 573
30 to 34 minutes: 1,094
35 to 39 minutes: 541
40 to 44 minutes: 512
45 to 59 minutes: 666
60 to 89 minutes: 507
90 or more minutes: 203
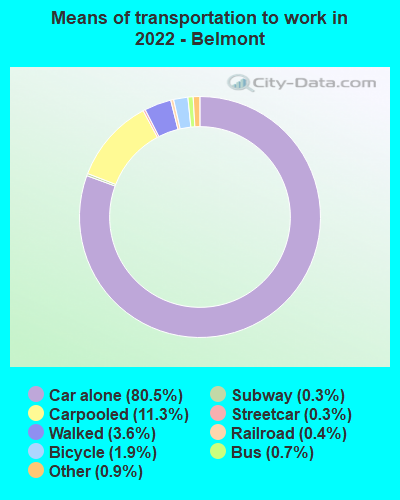
Means of transportation to work:
Drove a car alone: 4,037 (43.2%)
Carpooled: 617 (6.6%)
Bus: 33 (0.4%)
Subway or elevated rail: 13 (0.1%)
Long-distance train or commuter rail: 16 (0.2%)
Light rail, streetcar or trolley: 20 (0.2%)
Taxi: 38 (0.4%)
Bicycle: 107 (1.1%)
Walked: 203 (2.2%)
Worked at home: 5,092 (54.5%)
Unemployment by race in 2022
Unemployment rate for White non-Hispanic residents
1.5%Males
8.6%Females
Unemployment rate for Asian residents
4.1%Males
8.6%Females
Unemployment rate for other race residents
3.7%Males
Unemployment rate for two or more race residents
0.7%Males
1.1%Females
Unemployment rate for Hispanic or Latino residents
4.2%Males
2.2%Females
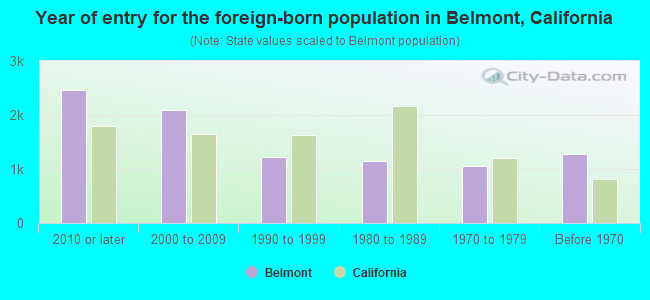
Year of entry for the foreign-born population in Belmont, California
2,4552010 or later
2,0982000 to 2009
1,2261990 to 1999
1,1511980 to 1989
1,0561970 to 1979
1,287Before 1970
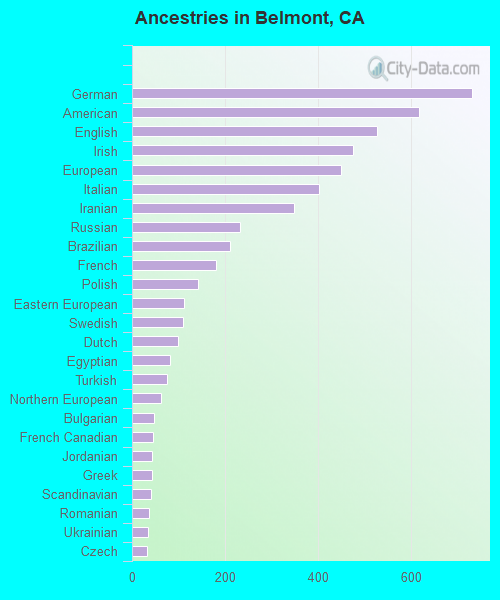
First ancestries reported:
German: 732 (5.1%)
American: 617 (4.3%)
English: 528 (3.7%)
Irish: 475 (3.3%)
European: 450 (3.1%)
Italian: 402 (2.8%)
Iranian: 349 (2.4%)
Russian: 232 (1.6%)
Brazilian: 212 (1.5%)
French: 181 (1.3%)
Polish: 142 (1.0%)
Eastern European: 111 (0.8%)
Swedish: 109 (0.8%)
Dutch: 98 (0.7%)
Egyptian: 82 (0.6%)
Turkish: 75 (0.5%)
Northern European: 63 (0.4%)
Bulgarian: 48 (0.3%)
French Canadian: 45 (0.3%)
Jordanian: 44 (0.3%)
Greek: 44 (0.3%)
Scandinavian: 41 (0.3%)
Romanian: 36 (0.3%)
Ukrainian: 35 (0.2%)
Czech: 33 (0.2%)
Maltese: 33 (0.2%)
Armenian: 33 (0.2%)
Portuguese: 31 (0.2%)
Norwegian: 25 (0.2%)
Celtic: 22 (0.2%)
Hungarian: 18 (0.1%)
Croatian: 18 (0.1%)
British: 18 (0.1%)
Slovene: 17 (0.1%)
Lebanese: 16 (0.1%)
Danish: 13 (0.09%)
Scotch-Irish: 12 (0.08%)
Scottish: 12 (0.08%)
Ethiopian: 12 (0.08%)
Latvian: 11 (0.08%)
Australian: 11 (0.08%)
Assyrian: 10 (0.07%)
Finnish: 8 (0.06%)
Slovak: 8 (0.06%)
Moroccan: 6 (0.04%)
New Zealander: 2 (0.01%)
Most common places of birth for foreign-born residents (%):
India
Belmont:
17.4% (1,435)
California:
5.2% (539,184)
China, excluding Hong Kong and Taiwan
Belmont:
14.0% (1,153)
California:
6.6% (684,672)
Philippines
Belmont:
6.1% (507)
California:
7.8% (818,297)
Mexico
Belmont:
5.4% (449)
California:
37.2% (3,881,193)
Hong Kong
Belmont:
4.1% (335)
California:
1.0% (105,215)
Iran
Belmont:
3.6% (299)
California:
2.0% (206,004)
Vietnam
Belmont:
3.5% (291)
California:
4.9% (512,335)
Korea
Belmont:
3.5% (290)
California:
3.0% (315,248)
Taiwan
Belmont:
3.3% (274)
California:
1.7% (176,274)
Brazil
Belmont:
3.1% (257)
California:
0.5% (53,222)
Canada
Belmont:
2.3% (186)
California:
1.2% (127,477)
El Salvador
Belmont:
2.1% (170)
California:
4.2% (440,287)
Germany
Belmont:
1.9% (158)
California:
0.7% (73,304)
France
Belmont:
1.9% (156)
California:
0.4% (40,224)
Italy
Belmont:
1.8% (148)
California:
0.3% (31,439)
Japan
Belmont:
1.7% (138)
California:
1.0% (103,575)
Nepal
Belmont:
1.6% (129)
California:
0.2% (16,541)
Place of birth for U.S.-born residents:
This state: 13,039
Other state: 5,268
Northeast: 1,729
Midwest: 1,316
South: 1,213
West: 977
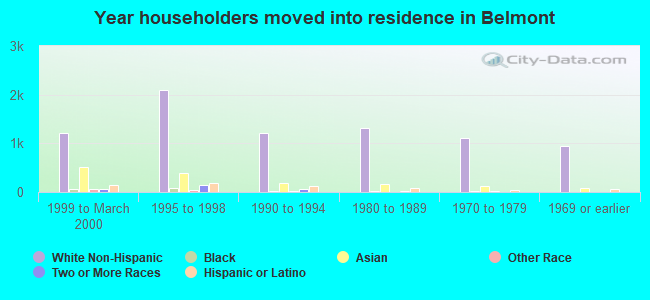
84.4% of Belmont residents lived in the same house 1 years ago. Out of people who lived in different houses, 36.2% lived in this county. Out of people who lived in different counties, 71.2% lived in California.
Belmont:
84.4%
State average:
88.9%
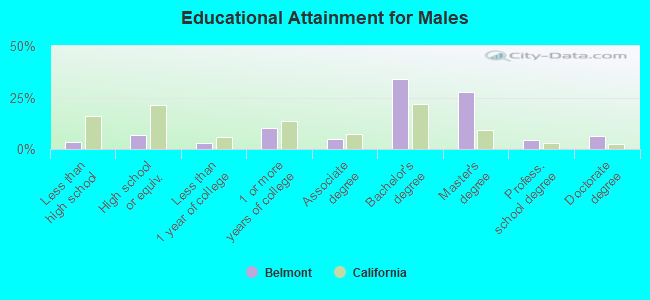
Education attainment for males 25 years and older:
No schooling: 162
Nursery to 4th grade: 0
5th and 6th grade: 46
7th and 8th grade: 19
9th grade: 10
10th grade: 24
11th grade: 31
12th grade, no diploma: 30
High school graduate (or equivalency): 672
Less than 1 year of college: 277
Some college more than 1 year, no degree: 999
Associate degree: 454
Bachelor's degree: 3,305
Master's degree: 2,717
Professional school degree: 429
Doctorate degree: 613
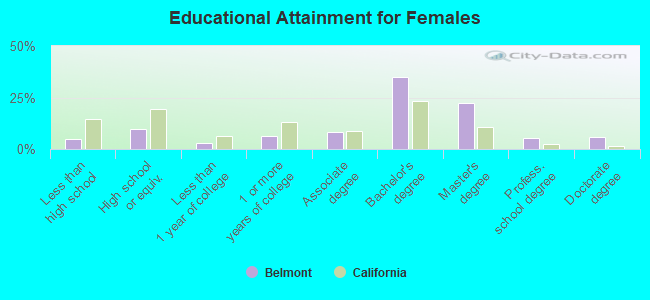
Education attainment for females 25 years and older:
No schooling: 85
Nursery to 4th grade: 12
5th and 6th grade: 169
7th and 8th grade: 3
9th grade: 9
10th grade: 4
11th grade: 8
12th grade, no diploma: 201
High school graduate (or equivalency): 955
Less than 1 year of college: 293
Some college more than 1 year, no degree: 624
Associate degree: 844
Bachelor's degree: 3,475
Master's degree: 2,229
Professional school degree: 525
Doctorate degree: 564
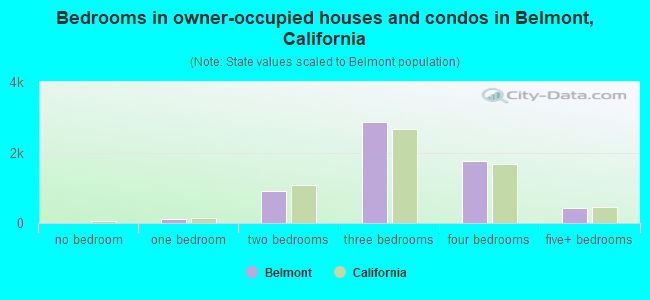
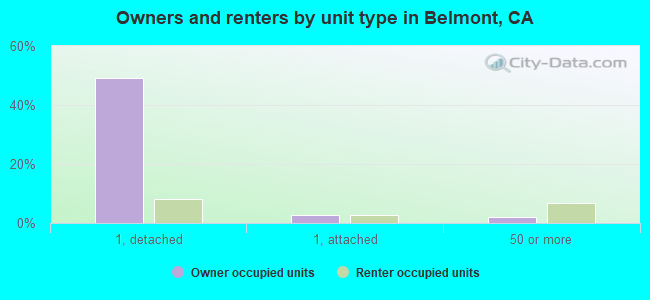
Housing units in structures:
One, detached: 6,333
One, attached: 636
Two: 193
3 or 4: 200
5 to 9: 689
10 to 19: 1,008
20 to 49: 1,448
50 or more: 1,142
Mobile homes: 14
Housing units lacking complete plumbing facilities in 2022: 0.2%
Housing units lacking complete kitchen facilities in 2022: 2.7%
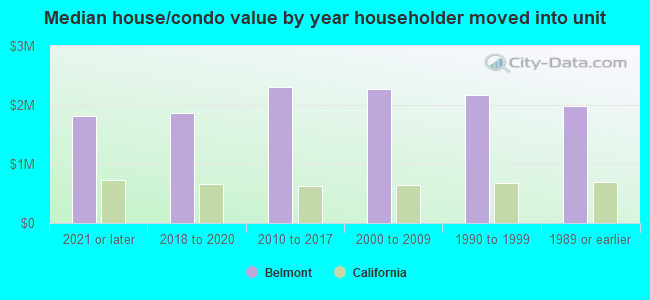
House/condo owner moved in on average 16 years ago