Atlantic Beach, FL (Florida) Houses and Residents
Estimated median house or condo value in 2022: $593,629 (it was $155,400 in 2000 )
Atlantic Beach:
$593,629Florida:
$354,100
Lower value quartile - upper value quartile: $380,341 - $945,042Mean price in 2022: Detached houses: $877,868 Here:
$877,868State:
$500,941
Townhouses or other attached units: $435,582 Here:
$435,582State:
$370,869
In 2-unit structures: $346,409 Here:
$346,409State:
$423,188
In 3-to-4-unit structures: $693,117 Here:
$693,117State:
$309,944
In 5-or-more-unit structures: $356,784 Here:
$356,784State:
$447,145
Total population: 13,031 (All urban)
Houses: 6,708 (6,022 occupied: 4,411 owner occupied, 1,678 renter occupied )
% of renters here:
28%State:
33%
Housing density: 1,799 houses/condos per square mile
Median price asked for vacant for-sale houses and condos in 2022: $600,423.
Median contract rent in 2022: $1,625 (lower quartile is $1,145, upper quartile is over $2,000)
Median rent asked for vacant for-rent units in 2022: $1,743
Median gross rent in Atlantic Beach, FL in 2022: $1,837
Housing units in Atlantic Beach with a mortgage: 2,852 (355 second mortgage, 18 home equity loan, 262 both second mortgage and home equity loan )Houses without a mortgage: 16
Median household income for houses/condos with a mortgage: $144,009
Median household income for apartments without a mortgage: $97,685
Median monthly housing costs: $1,668
Data:
Median house or condo value ($)
Median house or condo value ($ change since 2000)
Median house or condo value ($) - White
Median house or condo value ($) - Black or African American
Median house or condo value ($) - Asian
Median house or condo value ($) - Hispanic or Latino
Median house or condo value ($) - American Indian and Alaska Native
Median house or condo value ($) - Multirace
Median house or condo value ($) - Other Race
Median price asked for mobile homes ($)
Household density (households per square mile)
Mean house or condo value by units in structure - 1, detached ($)
Mean house or condo value by units in structure - 1, attached ($)
Mean house or condo value by units in structure - 2 ($)
Mean house or condo value by units in structure by units in structure - 3 or 4 ($)
Mean house or condo value by units in structure - 5 or more ($)
Mean house or condo value by units in structure - Boat, RV, van, etc. ($)
Mean house or condo value by units in structure - Mobile home ($)
Median contract rent ($)
Median contract rent - Lower quartile ($)
Median contract rent - Upper quartile ($)
Median gross rent ($)
Urban houses (%)
Rural houses (%)
Houses occupied (%)
Houses occupied (% change since 2000)
Houses owner occupied (%)
Houses owner occupied (% change since 2000)
Houses renter occupied (%)
Houses renter occupied (% change since 2000)
Vacant housing units - For rent (%)
Vacant housing units - For rent (% change since 2000)
Vacant housing units - For sale only (%)
Vacant housing units - For sale only (% change since 2000)
Vacant housing units - Rented or sold, not occupied (%)
Vacant housing units - Rented or sold, not occupied (% change since 2000)
Vacant housing units - For seasonal, recreational, or occasional use (%)
Vacant housing units - For seasonal, recreational, or occasional use (% change since 2000)
Vacant housing units - For migrant workers (%)
Vacant housing units - For migrant workers (% change since 2000)
Vacant housing units - Other vacant (%)
Vacant housing units - Other vacant (% change since 2000)
Median monthly housing costs ($)
Median household income for houses/condos with a mortgage ($)
Median household income for houses/condos without a mortgage ($)
Median household income ($)
Median household income ($) - White
Median household income ($) - Black or African American
Median household income ($) - Asian
Median household income ($) - Hispanic or Latino
Median household income ($) - American Indian and Alaska Native
Median household income ($) - Multirace
Median household income ($) - Other Race
Mortgage status - with mortgage (%)
Mortgage status - with second mortgage (%)
Mortgage status - with home equity loan (%)
Mortgage status - with both second mortgage and home equity loan (%)
Mortgage status - without a mortgage (%)
Median year house/condo built
Median year apartment built
Household type by relationship - Male householder living alone (%)
Household type by relationship - Male householder not living alone (%)
Household type by relationship - Female householder living alone (%)
Household type by relationship - Female householder not living alone (%)
Household type by relationship - Opposite-Sex spouse (%)
Household type by relationship - Same-Sex spouse (%)
Household type by relationship - Opposite-Sex unmarried partner (%)
Household type by relationship - Same-Sex unmarried partner (%)
Household type by relationship - In group quarters (%)
Size of family households - 2-person household (%)
Size of family households - 3-person household (%)
Size of family households - 4-person household (%)
Size of family households - 5-person household (%)
Size of family households - 6-person household (%)
Size of family households - 7-or-more-person household (%)
Size of nonfamily households - 1-person household (%)
Size of nonfamily households - 2-person household (%)
Size of nonfamily households - 3-person household (%)
Size of nonfamily households - 4-person household (%)
Size of nonfamily households - 5-person household (%)
Size of nonfamily households - 6-person household (%)
Size of nonfamily households - 7-or-moreperson household (%)
Year house built - Built 2010 or later (%)
Year house built - Built 2000 to 2009 (%)
Year house built - Built 1990 to 1999 (%)
Year house built - Built 1980 to 1989 (%)
Year house built - Built 1970 to 1979 (%)
Year house built - Built 1960 to 1969 (%)
Year house built - Built 1950 to 1959 (%)
Year house built - Built 1940 to 1949 (%)
Year house built - Built 1939 or earlier (%)
Median number of rooms in houses and condos
Median number of rooms in apartments
Median number of bedrooms in owner occupied houses
Mean number of bedrooms in owner occupied houses
Median number of bedrooms in renter occupied houses
Mean number of bedrooms in renter occupied houses
Median number of vehichles in owner occupied houses
Mean number of vehichles in owner occupied houses
Median number of vehichles in renter occupied houses
Mean number of vehichles in renter occupied houses
Rooms in owner-occupied houses - 1 room (%)
Rooms in owner-occupied houses - 2 rooms (%)
Rooms in owner-occupied houses - 3 rooms (%)
Rooms in owner-occupied houses - 4 rooms (%)
Rooms in owner-occupied houses - 5 rooms (%)
Rooms in owner-occupied houses - 6 rooms (%)
Rooms in owner-occupied houses - 7 rooms (%)
Rooms in owner-occupied houses - 8 rooms (%)
Rooms in owner-occupied houses - 9+ rooms (%)
Rooms in renter-occupied houses - 1 room (%)
Rooms in renter-occupied houses - 2 rooms (%)
Rooms in renter-occupied houses - 3 rooms (%)
Rooms in renter-occupied houses - 4 rooms (%)
Rooms in renter-occupied houses - 5 rooms (%)
Rooms in renter-occupied houses - 6 rooms (%)
Rooms in renter-occupied houses - 7 rooms (%)
Rooms in renter-occupied houses - 8 rooms (%)
Rooms in renter-occupied houses - 9+ rooms (%)
Bedrooms in owner-occupied houses - no bedrooms (%)
Bedrooms in owner-occupied houses - 1 bedroom (%)
Bedrooms in owner-occupied houses - 2 bedrooms (%)
Bedrooms in owner-occupied houses - 3 bedrooms (%)
Bedrooms in owner-occupied houses - 4 bedrooms (%)
Bedrooms in owner-occupied houses - 5+ bedrooms (%)
Bedrooms in renter-occupied houses - no bedrooms (%)
Bedrooms in renter-occupied houses - 1 bedroom (%)
Bedrooms in renter-occupied houses - 2 bedrooms (%)
Bedrooms in renter-occupied houses - 3 bedrooms (%)
Bedrooms in renter-occupied houses - 4 bedrooms (%)
Bedrooms in renter-occupied houses - 5+ bedrooms (%)
Vehicles available in owner-occupied houses - no vehicle available (%)
Vehicles available in owner-occupied houses - 1 vehicle available(%)
Vehicles available in owner-occupied houses - 2 Vehicles available (%)
Vehicles available in owner-occupied houses - 3 Vehicles available (%)
Vehicles available in owner-occupied houses - 4 Vehicles available (%)
Vehicles available in owner-occupied houses - 5+ Vehicles available (%)
Vehicles available in renter-occupied houses - no vehicle available (%)
Vehicles available in renter-occupied houses - 1 vehicle available (%)
Vehicles available in renter-occupied houses - 2 Vehicles available (%)
Vehicles available in renter-occupied houses - 3 Vehicles available (%)
Vehicles available in renter-occupied houses - 4 Vehicles available (%)
Vehicles available in renter-occupied houses - 5+ Vehicles available (%)
Housing units in structures - 1, detached (%)
Housing units in structures - 1, attached (%)
Housing units in structures - 2 (%)
Housing units in structures - 3 or 4 (%)
Housing units in structures - 5 to 9 (%)
Housing units in structures - 10 to 19 (%)
Housing units in structures - 20 to 49 (%)
Housing units in structures - 50 or more (%)
Housing units in structures - Mobile home (%)
Housing units in structures - Boat, RV, van, etc. (%)
Housing units in structures - Owners - 1, detached (%)
Housing units in structures - Owners - 1, attached (%)
Housing units in structures - Owners - 2 (%)
Housing units in structures - Owners - 3 or 4 (%)
Housing units in structures - Owners - 5 to 9 (%)
Housing units in structures - Owners - 10 to 19 (%)
Housing units in structures - Owners - 20 to 49 (%)
Housing units in structures - Owners - 50 or more (%)
Housing units in structures - Owners - Mobile home (%)
Housing units in structures - Owners - Boat, RV, van, etc. (%)
Housing units in structures - Renters - 1, detached (%)
Housing units in structures - Renters - 1, attached (%)
Housing units in structures - Renters - 2 (%)
Housing units in structures - Renters - 3 or 4 (%)
Housing units in structures - Renters - 5 to 9 (%)
Housing units in structures - Renters - 10 to 19 (%)
Housing units in structures - Renters - 20 to 49 (%)
Housing units in structures - Renters - 50 or more (%)
Housing units in structures - Renters - Mobile home (%)
Housing units in structures - Renters - Boat, RV, van, etc. (%)
House/condo owner moved in on average (years ago)
Renter moved in on average (years ago)
Year householder moved into unit - Moved in 1999 to March 2000 (%)
Year householder moved into unit - Moved in 1999 to March 2000 (%) - White
Year householder moved into unit - Moved in 1999 to March 2000 (%) - Black or African American
Year householder moved into unit - Moved in 1999 to March 2000 (%) - Asian
Year householder moved into unit - Moved in 1999 to March 2000 (%) - Hispanic or Latino
Year householder moved into unit - Moved in 1999 to March 2000 (%) - American Indian and Alaska Native
Year householder moved into unit - Moved in 1999 to March 2000 (%) - Multirace
Year householder moved into unit - Moved in 1999 to March 2000 (%) - Other Race
Year householder moved into unit - Moved in 1995 to 1998 (%)
Year householder moved into unit - Moved in 1995 to 1998 (%) - White
Year householder moved into unit - Moved in 1995 to 1998 (%) - Black or African American
Year householder moved into unit - Moved in 1995 to 1998 (%) - Asian
Year householder moved into unit - Moved in 1995 to 1998 (%) - Hispanic or Latino
Year householder moved into unit - Moved in 1995 to 1998 (%) - American Indian and Alaska Native
Year householder moved into unit - Moved in 1995 to 1998 (%) - Multirace
Year householder moved into unit - Moved in 1995 to 1998 (%) - Other Race
Year householder moved into unit - Moved in 1990 to 1994 (%)
Year householder moved into unit - Moved in 1990 to 1994 (%) - White
Year householder moved into unit - Moved in 1990 to 1994 (%) - Black or African American
Year householder moved into unit - Moved in 1990 to 1994 (%) - Asian
Year householder moved into unit - Moved in 1990 to 1994 (%) - Hispanic or Latino
Year householder moved into unit - Moved in 1990 to 1994 (%) - American Indian and Alaska Native
Year householder moved into unit - Moved in 1990 to 1994 (%) - Multirace
Year householder moved into unit - Moved in 1990 to 1994 (%) - Other Race
Year householder moved into unit - Moved in 1980 to 1989 (%)
Year householder moved into unit - Moved in 1980 to 1989 (%) - White
Year householder moved into unit - Moved in 1980 to 1989 (%) - Black or African American
Year householder moved into unit - Moved in 1980 to 1989 (%) - Asian
Year householder moved into unit - Moved in 1980 to 1989 (%) - Hispanic or Latino
Year householder moved into unit - Moved in 1980 to 1989 (%) - American Indian and Alaska Native
Year householder moved into unit - Moved in 1980 to 1989 (%) - Multirace
Year householder moved into unit - Moved in 1980 to 1989 (%) - Other Race
Year householder moved into unit - Moved in 1970 to 1979 (%)
Year householder moved into unit - Moved in 1970 to 1979 (%) - White
Year householder moved into unit - Moved in 1970 to 1979 (%) - Black or African American
Year householder moved into unit - Moved in 1970 to 1979 (%) - Asian
Year householder moved into unit - Moved in 1970 to 1979 (%) - Hispanic or Latino
Year householder moved into unit - Moved in 1970 to 1979 (%) - American Indian and Alaska Native
Year householder moved into unit - Moved in 1970 to 1979 (%) - Multirace
Year householder moved into unit - Moved in 1970 to 1979 (%) - Other Race
Year householder moved into unit - Moved in 1969 or earlier (%)
Year householder moved into unit - Moved in 1969 or earlier (%) - White
Year householder moved into unit - Moved in 1969 or earlier (%) - Black or African American
Year householder moved into unit - Moved in 1969 or earlier (%) - Asian
Year householder moved into unit - Moved in 1969 or earlier (%) - Hispanic or Latino
Year householder moved into unit - Moved in 1969 or earlier (%) - American Indian and Alaska Native
Year householder moved into unit - Moved in 1969 or earlier (%) - Multirace
Year householder moved into unit - Moved in 1969 or earlier (%) - Other Race
Housing units lacking complete plumbing facilities (%)
Housing units lacking complete kitchen facilities (%)
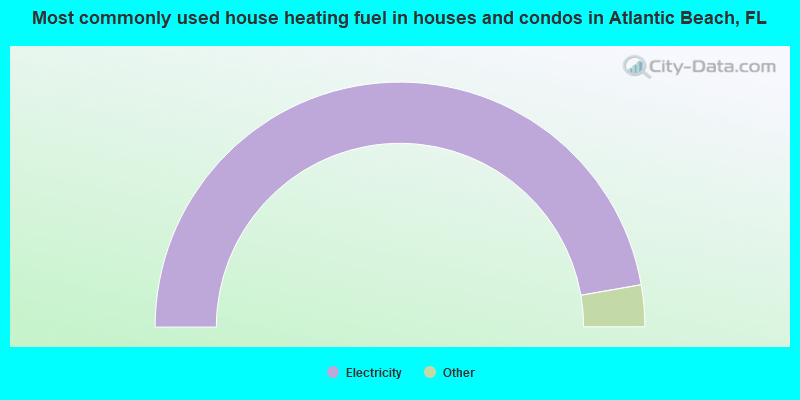
House heating fuel used in houses and condos - Utility gas (%)
House heating fuel used in houses and condos - Bottled, tank, or LP gas (%)
House heating fuel used in houses and condos - Electricity (%)
House heating fuel used in houses and condos - Fuel oil, kerosene, etc. (%)
House heating fuel used in houses and condos - Coal or coke (%)
House heating fuel used in houses and condos - Wood (%)
House heating fuel used in houses and condos - Solar energy (%)
House heating fuel used in houses and condos - Other fuel (%)
House heating fuel used in houses and condos - No fuel used (%)
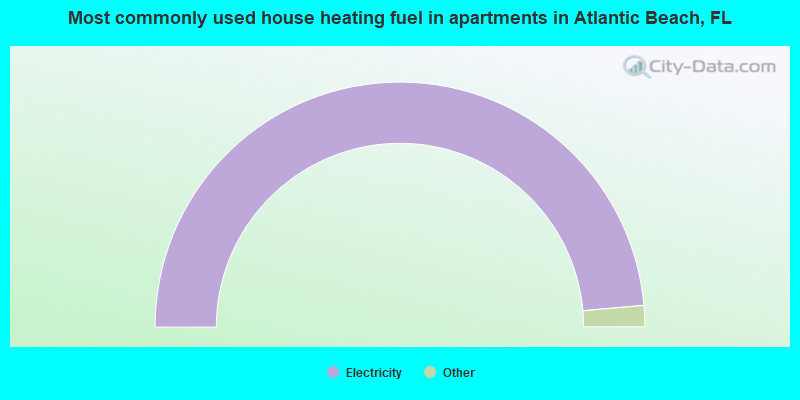
House heating fuel used in apartments - Utility gas (%)
House heating fuel used in apartments - Bottled, tank, or LP gas (%)
House heating fuel used in apartments - Electricity (%)
House heating fuel used in apartments - Fuel oil, kerosene, etc. (%)
House heating fuel used in apartments - Coal or coke (%)
House heating fuel used in apartments - Wood (%)
House heating fuel used in apartments - Solar energy (%)
House heating fuel used in apartments - Other fuel (%)
House heating fuel used in apartments - No fuel used (%)
Median year house/condo built: 1983Median year apartment built: 1985Household type by relationship:
Households: 13,660
Male householders: 3,169 (723 living alone ), Female householders: 2,749 (931 living alone )3,128 spouses (3,119 opposite-sex spouses ), 308 unmarried partners , (308 opposite-sex unmarried partners ), 3,229 children (3,064 natural , 55 adopted , 109 stepchildren ), 364 grandchildren , 36 brothers or sisters , 71 parents , 0 foster children , 118 other relatives , 372 non-relatives In group quarters: 112
Size of family households: 2,576 2-persons , 608 3-persons , 543 4-persons , 265 5-persons , 29 6-persons , 37 7-or-more-persons .
Size of nonfamily households: 1,555 1-person , 518 2-persons , 42 3-persons .
1,707 married couples with children. single-parent households (32 men , 287 women ).
92.1% of residents of Atlantic Beach speak English at home. of residents speak Spanish at home (88% speak English very well , 8% speak English well , 2% speak English not well , 2% don't speak English at all ).of residents speak other Indo-European language at home (87% speak English very well , 13% speak English well ).of residents speak Asian or Pacific Island language at home (94% speak English very well , 6% speak English well ).
Foreign born population: 1,248 (9.1%)of them are naturalized citizens )
Median number of rooms in houses and condos:
Median number of rooms in apartments
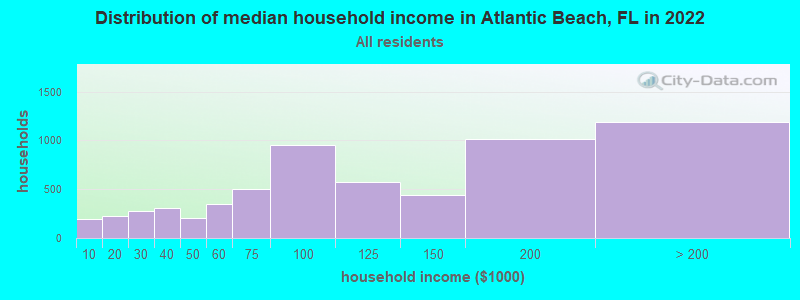
Atlantic Beach, FL household income distribution 193 Less than $10,000226 $10,000 to $19,999275 $20,000 to $29,999307 $30,000 to $39,999209 $40,000 to $49,999349 $50,000 to $59,999502 $60,000 to $74,999958 $75,000 to $99,999572 $100,000 to $124,999437 $125,000 to $149,9991,017 $150,000 to $199,9991,189 $200,000 or more
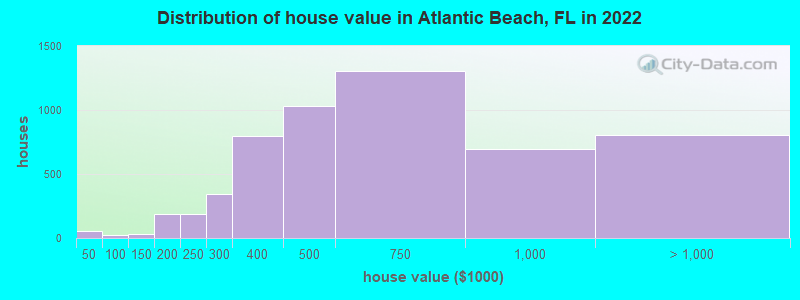
Home value of owner - occupied houses in 2022 in Atlantic Beach, FL 32 Less than $10,00012 $20,000 to $24,99911 $30,000 to $34,99922 $80,000 to $89,9993 $90,000 to $99,99914 $100,000 to $124,99913 $125,000 to $149,999121 $150,000 to $174,99969 $175,000 to $199,999184 $200,000 to $249,999343 $250,000 to $299,999798 $300,000 to $399,9991,030 $400,000 to $499,9991,304 $500,000 to $749,999693 $750,000 to $999,999375 $1,000,000 to $1,499,999135 $1,500,000 to $1,999,999293 $2,000,000 or moreRent paid by renters in 2022 in Atlantic Beach, FL 9 $350 to $39930 $500 to $54960 $600 to $64953 $650 to $69944 $700 to $7495 $750 to $79941 $800 to $89923 $900 to $999232 $1,000 to $1,249284 $1,250 to $1,499362 $1,500 to $1,999189 $2,000 to $2,49984 $2,500 to $2,99979 $3,000 to $3,499401 $3,500 or more108 No cash rent
Percentage of workers working in this county: 89.7%Number of people working at home: 1,527 (21.9% of all workers )
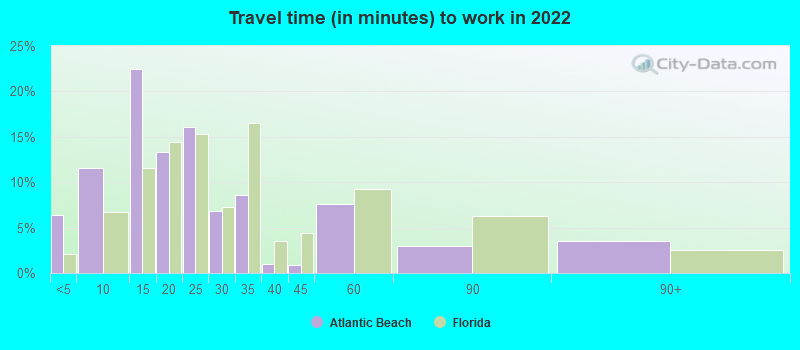
Travel time to work (commute)
Less than 5 minutes: 2775 to 9 minutes: 39710 to 14 minutes: 56115 to 19 minutes: 56420 to 24 minutes: 1,15725 to 29 minutes: 32530 to 34 minutes: 1,32135 to 39 minutes: 36840 to 44 minutes: 14445 to 59 minutes: 29060 to 89 minutes: 8690 or more minutes: 97
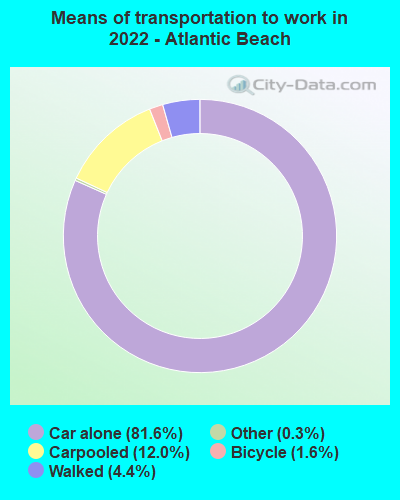
Means of transportation to work:
Drove a car alone: 3,162 (61.5%)Carpooled: 524 (10.2%)Taxi: 10 (0.2%)Bicycle: 60 (1.2%)Walked: 187 (3.6%)Worked at home: 1,527 (29.7%)
Unemployment by race in 2022
Unemployment rate for White non-Hispanic residents 0.7% Males0.8% FemalesUnemployment rate for Black residents 12.1% MalesUnemployment rate for Asian residents 21.6% MalesUnemployment rate for other race residents 7.9% MalesUnemployment rate for two or more race residents 7.0% MalesUnemployment rate for Hispanic or Latino residents 5.3% Males
Year of entry for the foreign-born population in Atlantic Beach, Florida
317 2010 or later 171 2000 to 2009 151 1990 to 1999 101 1980 to 1989 103 1970 to 1979 213 Before 1970
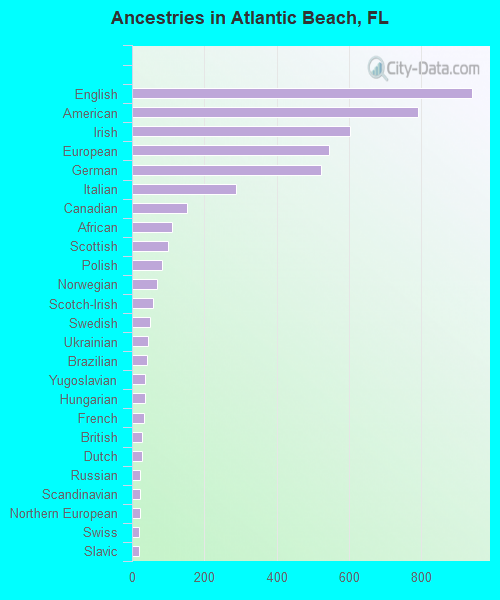
First ancestries reported:
English: 941 (14.6%)
American: 791 (12.3%)
Irish: 602 (9.3%)
European: 546 (8.5%)
German: 523 (8.1%)
Italian: 287 (4.5%)
Canadian: 151 (2.3%)
African: 111 (1.7%)
Scottish: 100 (1.6%)
Polish: 82 (1.3%)
Norwegian: 68 (1.1%)
Scotch-Irish: 59 (0.9%)
Swedish: 49 (0.8%)
Ukrainian: 44 (0.7%)
Brazilian: 41 (0.6%)
Yugoslavian: 37 (0.6%)
Hungarian: 35 (0.5%)
French: 33 (0.5%)
British: 29 (0.5%)
Dutch: 29 (0.5%)
Russian: 23 (0.4%)
Scandinavian: 23 (0.4%)
Northern European: 21 (0.3%)
Swiss: 20 (0.3%)
Slavic: 18 (0.3%)
Belgian: 16 (0.2%)
Croatian: 16 (0.2%)
Portuguese: 14 (0.2%)
Czech: 14 (0.2%)
Greek: 13 (0.2%)
Danish: 13 (0.2%)
French Canadian: 11 (0.2%)
Celtic: 10 (0.2%)
Eastern European: 9 (0.1%)
Serbian: 7 (0.1%)
Czechoslovakian: 7 (0.1%) Most common places of birth for foreign-born residents (%): Canada Atlantic Beach:
17.4% (215)Florida:
2.4% (109,132)
India Atlantic Beach:
12.4% (153)Florida:
2.1% (94,349)
South Africa Atlantic Beach:
6.5% (80)Florida:
0.2% (11,243)
China, excluding Hong Kong and Taiwan Atlantic Beach:
6.4% (79)Florida:
1.2% (56,071)
Cambodia Atlantic Beach:
6.1% (76)Florida:
0.1% (3,268)
Bosnia and Herzegovina Atlantic Beach:
4.9% (60)Florida:
0.2% (8,695)
Colombia Atlantic Beach:
4.7% (58)Florida:
6.5% (298,669)
Ukraine Atlantic Beach:
4.4% (55)Florida:
0.5% (21,886)
Brazil Atlantic Beach:
3.7% (46)Florida:
2.7% (122,906)
Guatemala Atlantic Beach:
3.4% (42)Florida:
2.1% (97,632)
Peru Atlantic Beach:
2.9% (36)Florida:
2.1% (96,693)
Philippines Atlantic Beach:
2.9% (36)Florida:
1.8% (84,403)
Ireland Atlantic Beach:
1.9% (24)Florida:
0.2% (9,421)
Panama Atlantic Beach:
1.9% (23)Florida:
0.5% (22,972)
United Kingdom, excluding England and Scotland Atlantic Beach:
1.8% (22)Florida:
0.7% (34,227)
England Atlantic Beach:
1.7% (21)Florida:
0.8% (37,723)
Venezuela Atlantic Beach:
1.7% (21)Florida:
5.7% (262,042)
Poland Atlantic Beach:
1.6% (20)Florida:
0.6% (25,219)
Place of birth for U.S.-born residents:
This state: 4,786Other state: 7,402Northeast: 2,223Midwest: 1,717South: 2,650West: 808 91.2% of Atlantic Beach residents lived in the same house 1 years ago.
Out of people who lived in different houses, 27.3% lived in this county.
Out of people who lived in different counties, 41.6% lived in Florida.
Atlantic Beach:
91.2%State average:
86.3%
Education attainment for males 25 years and older:
No schooling: 41Nursery to 4th grade: 05th and 6th grade: 357th and 8th grade: 829th grade: 510th grade: 3011th grade: 3512th grade, no diploma: 102High school graduate (or equivalency): 846Less than 1 year of college: 143Some college more than 1 year, no degree: 263Associate degree: 344Bachelor's degree: 1,877Master's degree: 721Professional school degree: 246Doctorate degree: 97
Education attainment for females 25 years and older:
No schooling: 145Nursery to 4th grade: 1095th and 6th grade: 07th and 8th grade: 109th grade: 11510th grade: 8811th grade: 012th grade, no diploma: 194High school graduate (or equivalency): 806Less than 1 year of college: 263Some college more than 1 year, no degree: 516Associate degree: 498Bachelor's degree: 1,887Master's degree: 985Professional school degree: 167Doctorate degree: 72
Housing units in structures:
One, detached: 4,503One, attached: 1,054Two: 2543 or 4: 895 to 9: 7910 to 19: 7820 to 49: 26150 or more: 260Mobile homes: 125Housing units lacking complete plumbing facilities in 2022: 0.1%Housing units lacking complete kitchen facilities in 2022: 2.1%House/condo owner moved in on average 12 years ago
Renter moved in on average 4 years ago
Private vs. public school enrollment:
Students in private schools in grades 1 to 8 (elementary and middle school): 214 Students in private schools in grades 9 to 12 (high school): 77 Students in private undergraduate colleges: 90