Altamonte Springs, FL (Florida) Houses and Residents
Estimated median house or condo value in 2022: $289,989 (it was $101,500 in 2000 )
Altamonte Springs:
$289,989Florida:
$354,100
Lower value quartile - upper value quartile: $189,211 - $406,983Mean price in 2022: Detached houses: $362,135 Here:
$362,135State:
$500,941
Townhouses or other attached units: $213,908 Here:
$213,908State:
$370,869
In 2-unit structures: $234,571 Here:
$234,571State:
$423,188
In 3-to-4-unit structures: $142,012 Here:
$142,012State:
$309,944
In 5-or-more-unit structures: $178,705 Here:
$178,705State:
$447,145
Mobile homes: $88,784 Here:
$88,784State:
$113,202
Total population: 42,225 (Urban population: 41,402, Rural population: 0)
Houses: 23,257 (21,435 occupied: 8,682 owner occupied, 12,913 renter occupied )
% of renters here:
60%State:
33%
Housing density: 2,614 houses/condos per square mile
Median price asked for vacant for-sale houses and condos in 2022: $1,107,113.
Median contract rent in 2022: $1,419 (lower quartile is $1,208, upper quartile is $1,614)
Median rent asked for vacant for-rent units in 2022: $1,471
Median gross rent in Altamonte Springs, FL in 2022: $1,562
Housing units in Altamonte Springs with a mortgage: 4,655 (299 second mortgage, 0 home equity loan, 280 both second mortgage and home equity loan )Houses without a mortgage: 111
Median household income for houses/condos with a mortgage: $96,286
Median household income for apartments without a mortgage: $69,048
Median monthly housing costs: $1,434
Data:
Median house or condo value ($)
Median house or condo value ($ change since 2000)
Median house or condo value ($) - White
Median house or condo value ($) - Black or African American
Median house or condo value ($) - Asian
Median house or condo value ($) - Hispanic or Latino
Median house or condo value ($) - American Indian and Alaska Native
Median house or condo value ($) - Multirace
Median house or condo value ($) - Other Race
Median price asked for mobile homes ($)
Household density (households per square mile)
Mean house or condo value by units in structure - 1, detached ($)
Mean house or condo value by units in structure - 1, attached ($)
Mean house or condo value by units in structure - 2 ($)
Mean house or condo value by units in structure by units in structure - 3 or 4 ($)
Mean house or condo value by units in structure - 5 or more ($)
Mean house or condo value by units in structure - Boat, RV, van, etc. ($)
Mean house or condo value by units in structure - Mobile home ($)
Median contract rent ($)
Median contract rent - Lower quartile ($)
Median contract rent - Upper quartile ($)
Median gross rent ($)
Urban houses (%)
Rural houses (%)
Houses occupied (%)
Houses occupied (% change since 2000)
Houses owner occupied (%)
Houses owner occupied (% change since 2000)
Houses renter occupied (%)
Houses renter occupied (% change since 2000)
Vacant housing units - For rent (%)
Vacant housing units - For rent (% change since 2000)
Vacant housing units - For sale only (%)
Vacant housing units - For sale only (% change since 2000)
Vacant housing units - Rented or sold, not occupied (%)
Vacant housing units - Rented or sold, not occupied (% change since 2000)
Vacant housing units - For seasonal, recreational, or occasional use (%)
Vacant housing units - For seasonal, recreational, or occasional use (% change since 2000)
Vacant housing units - For migrant workers (%)
Vacant housing units - For migrant workers (% change since 2000)
Vacant housing units - Other vacant (%)
Vacant housing units - Other vacant (% change since 2000)
Median monthly housing costs ($)
Median household income for houses/condos with a mortgage ($)
Median household income for houses/condos without a mortgage ($)
Median household income ($)
Median household income ($) - White
Median household income ($) - Black or African American
Median household income ($) - Asian
Median household income ($) - Hispanic or Latino
Median household income ($) - American Indian and Alaska Native
Median household income ($) - Multirace
Median household income ($) - Other Race
Mortgage status - with mortgage (%)
Mortgage status - with second mortgage (%)
Mortgage status - with home equity loan (%)
Mortgage status - with both second mortgage and home equity loan (%)
Mortgage status - without a mortgage (%)
Median year house/condo built
Median year apartment built
Household type by relationship - Male householder living alone (%)
Household type by relationship - Male householder not living alone (%)
Household type by relationship - Female householder living alone (%)
Household type by relationship - Female householder not living alone (%)
Household type by relationship - Opposite-Sex spouse (%)
Household type by relationship - Same-Sex spouse (%)
Household type by relationship - Opposite-Sex unmarried partner (%)
Household type by relationship - Same-Sex unmarried partner (%)
Household type by relationship - In group quarters (%)
Size of family households - 2-person household (%)
Size of family households - 3-person household (%)
Size of family households - 4-person household (%)
Size of family households - 5-person household (%)
Size of family households - 6-person household (%)
Size of family households - 7-or-more-person household (%)
Size of nonfamily households - 1-person household (%)
Size of nonfamily households - 2-person household (%)
Size of nonfamily households - 3-person household (%)
Size of nonfamily households - 4-person household (%)
Size of nonfamily households - 5-person household (%)
Size of nonfamily households - 6-person household (%)
Size of nonfamily households - 7-or-moreperson household (%)
Year house built - Built 2010 or later (%)
Year house built - Built 2000 to 2009 (%)
Year house built - Built 1990 to 1999 (%)
Year house built - Built 1980 to 1989 (%)
Year house built - Built 1970 to 1979 (%)
Year house built - Built 1960 to 1969 (%)
Year house built - Built 1950 to 1959 (%)
Year house built - Built 1940 to 1949 (%)
Year house built - Built 1939 or earlier (%)
Median number of rooms in houses and condos
Median number of rooms in apartments
Median number of bedrooms in owner occupied houses
Mean number of bedrooms in owner occupied houses
Median number of bedrooms in renter occupied houses
Mean number of bedrooms in renter occupied houses
Median number of vehichles in owner occupied houses
Mean number of vehichles in owner occupied houses
Median number of vehichles in renter occupied houses
Mean number of vehichles in renter occupied houses
Rooms in owner-occupied houses - 1 room (%)
Rooms in owner-occupied houses - 2 rooms (%)
Rooms in owner-occupied houses - 3 rooms (%)
Rooms in owner-occupied houses - 4 rooms (%)
Rooms in owner-occupied houses - 5 rooms (%)
Rooms in owner-occupied houses - 6 rooms (%)
Rooms in owner-occupied houses - 7 rooms (%)
Rooms in owner-occupied houses - 8 rooms (%)
Rooms in owner-occupied houses - 9+ rooms (%)
Rooms in renter-occupied houses - 1 room (%)
Rooms in renter-occupied houses - 2 rooms (%)
Rooms in renter-occupied houses - 3 rooms (%)
Rooms in renter-occupied houses - 4 rooms (%)
Rooms in renter-occupied houses - 5 rooms (%)
Rooms in renter-occupied houses - 6 rooms (%)
Rooms in renter-occupied houses - 7 rooms (%)
Rooms in renter-occupied houses - 8 rooms (%)
Rooms in renter-occupied houses - 9+ rooms (%)
Bedrooms in owner-occupied houses - no bedrooms (%)
Bedrooms in owner-occupied houses - 1 bedroom (%)
Bedrooms in owner-occupied houses - 2 bedrooms (%)
Bedrooms in owner-occupied houses - 3 bedrooms (%)
Bedrooms in owner-occupied houses - 4 bedrooms (%)
Bedrooms in owner-occupied houses - 5+ bedrooms (%)
Bedrooms in renter-occupied houses - no bedrooms (%)
Bedrooms in renter-occupied houses - 1 bedroom (%)
Bedrooms in renter-occupied houses - 2 bedrooms (%)
Bedrooms in renter-occupied houses - 3 bedrooms (%)
Bedrooms in renter-occupied houses - 4 bedrooms (%)
Bedrooms in renter-occupied houses - 5+ bedrooms (%)
Vehicles available in owner-occupied houses - no vehicle available (%)
Vehicles available in owner-occupied houses - 1 vehicle available(%)
Vehicles available in owner-occupied houses - 2 Vehicles available (%)
Vehicles available in owner-occupied houses - 3 Vehicles available (%)
Vehicles available in owner-occupied houses - 4 Vehicles available (%)
Vehicles available in owner-occupied houses - 5+ Vehicles available (%)
Vehicles available in renter-occupied houses - no vehicle available (%)
Vehicles available in renter-occupied houses - 1 vehicle available (%)
Vehicles available in renter-occupied houses - 2 Vehicles available (%)
Vehicles available in renter-occupied houses - 3 Vehicles available (%)
Vehicles available in renter-occupied houses - 4 Vehicles available (%)
Vehicles available in renter-occupied houses - 5+ Vehicles available (%)
Housing units in structures - 1, detached (%)
Housing units in structures - 1, attached (%)
Housing units in structures - 2 (%)
Housing units in structures - 3 or 4 (%)
Housing units in structures - 5 to 9 (%)
Housing units in structures - 10 to 19 (%)
Housing units in structures - 20 to 49 (%)
Housing units in structures - 50 or more (%)
Housing units in structures - Mobile home (%)
Housing units in structures - Boat, RV, van, etc. (%)
Housing units in structures - Owners - 1, detached (%)
Housing units in structures - Owners - 1, attached (%)
Housing units in structures - Owners - 2 (%)
Housing units in structures - Owners - 3 or 4 (%)
Housing units in structures - Owners - 5 to 9 (%)
Housing units in structures - Owners - 10 to 19 (%)
Housing units in structures - Owners - 20 to 49 (%)
Housing units in structures - Owners - 50 or more (%)
Housing units in structures - Owners - Mobile home (%)
Housing units in structures - Owners - Boat, RV, van, etc. (%)
Housing units in structures - Renters - 1, detached (%)
Housing units in structures - Renters - 1, attached (%)
Housing units in structures - Renters - 2 (%)
Housing units in structures - Renters - 3 or 4 (%)
Housing units in structures - Renters - 5 to 9 (%)
Housing units in structures - Renters - 10 to 19 (%)
Housing units in structures - Renters - 20 to 49 (%)
Housing units in structures - Renters - 50 or more (%)
Housing units in structures - Renters - Mobile home (%)
Housing units in structures - Renters - Boat, RV, van, etc. (%)
House/condo owner moved in on average (years ago)
Renter moved in on average (years ago)
Year householder moved into unit - Moved in 1999 to March 2000 (%)
Year householder moved into unit - Moved in 1999 to March 2000 (%) - White
Year householder moved into unit - Moved in 1999 to March 2000 (%) - Black or African American
Year householder moved into unit - Moved in 1999 to March 2000 (%) - Asian
Year householder moved into unit - Moved in 1999 to March 2000 (%) - Hispanic or Latino
Year householder moved into unit - Moved in 1999 to March 2000 (%) - American Indian and Alaska Native
Year householder moved into unit - Moved in 1999 to March 2000 (%) - Multirace
Year householder moved into unit - Moved in 1999 to March 2000 (%) - Other Race
Year householder moved into unit - Moved in 1995 to 1998 (%)
Year householder moved into unit - Moved in 1995 to 1998 (%) - White
Year householder moved into unit - Moved in 1995 to 1998 (%) - Black or African American
Year householder moved into unit - Moved in 1995 to 1998 (%) - Asian
Year householder moved into unit - Moved in 1995 to 1998 (%) - Hispanic or Latino
Year householder moved into unit - Moved in 1995 to 1998 (%) - American Indian and Alaska Native
Year householder moved into unit - Moved in 1995 to 1998 (%) - Multirace
Year householder moved into unit - Moved in 1995 to 1998 (%) - Other Race
Year householder moved into unit - Moved in 1990 to 1994 (%)
Year householder moved into unit - Moved in 1990 to 1994 (%) - White
Year householder moved into unit - Moved in 1990 to 1994 (%) - Black or African American
Year householder moved into unit - Moved in 1990 to 1994 (%) - Asian
Year householder moved into unit - Moved in 1990 to 1994 (%) - Hispanic or Latino
Year householder moved into unit - Moved in 1990 to 1994 (%) - American Indian and Alaska Native
Year householder moved into unit - Moved in 1990 to 1994 (%) - Multirace
Year householder moved into unit - Moved in 1990 to 1994 (%) - Other Race
Year householder moved into unit - Moved in 1980 to 1989 (%)
Year householder moved into unit - Moved in 1980 to 1989 (%) - White
Year householder moved into unit - Moved in 1980 to 1989 (%) - Black or African American
Year householder moved into unit - Moved in 1980 to 1989 (%) - Asian
Year householder moved into unit - Moved in 1980 to 1989 (%) - Hispanic or Latino
Year householder moved into unit - Moved in 1980 to 1989 (%) - American Indian and Alaska Native
Year householder moved into unit - Moved in 1980 to 1989 (%) - Multirace
Year householder moved into unit - Moved in 1980 to 1989 (%) - Other Race
Year householder moved into unit - Moved in 1970 to 1979 (%)
Year householder moved into unit - Moved in 1970 to 1979 (%) - White
Year householder moved into unit - Moved in 1970 to 1979 (%) - Black or African American
Year householder moved into unit - Moved in 1970 to 1979 (%) - Asian
Year householder moved into unit - Moved in 1970 to 1979 (%) - Hispanic or Latino
Year householder moved into unit - Moved in 1970 to 1979 (%) - American Indian and Alaska Native
Year householder moved into unit - Moved in 1970 to 1979 (%) - Multirace
Year householder moved into unit - Moved in 1970 to 1979 (%) - Other Race
Year householder moved into unit - Moved in 1969 or earlier (%)
Year householder moved into unit - Moved in 1969 or earlier (%) - White
Year householder moved into unit - Moved in 1969 or earlier (%) - Black or African American
Year householder moved into unit - Moved in 1969 or earlier (%) - Asian
Year householder moved into unit - Moved in 1969 or earlier (%) - Hispanic or Latino
Year householder moved into unit - Moved in 1969 or earlier (%) - American Indian and Alaska Native
Year householder moved into unit - Moved in 1969 or earlier (%) - Multirace
Year householder moved into unit - Moved in 1969 or earlier (%) - Other Race
Housing units lacking complete plumbing facilities (%)
Housing units lacking complete kitchen facilities (%)
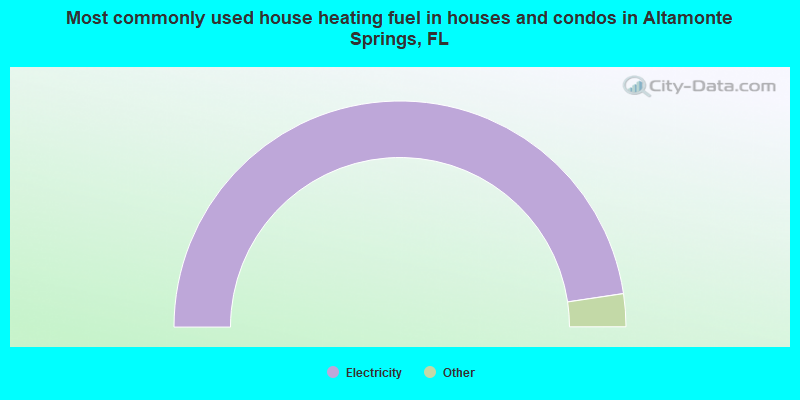
House heating fuel used in houses and condos - Utility gas (%)
House heating fuel used in houses and condos - Bottled, tank, or LP gas (%)
House heating fuel used in houses and condos - Electricity (%)
House heating fuel used in houses and condos - Fuel oil, kerosene, etc. (%)
House heating fuel used in houses and condos - Coal or coke (%)
House heating fuel used in houses and condos - Wood (%)
House heating fuel used in houses and condos - Solar energy (%)
House heating fuel used in houses and condos - Other fuel (%)
House heating fuel used in houses and condos - No fuel used (%)
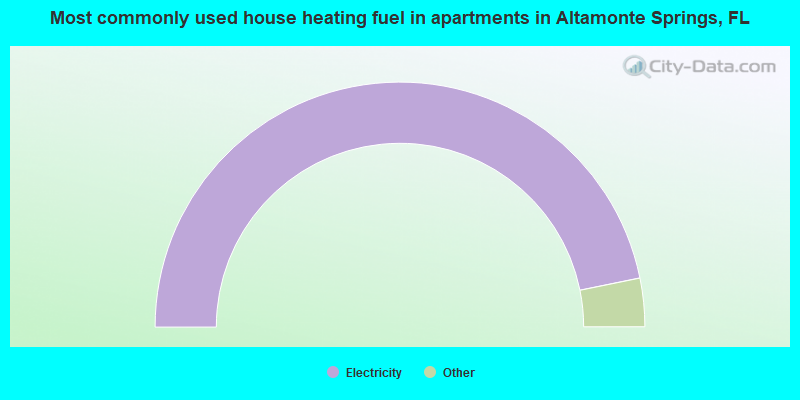
House heating fuel used in apartments - Utility gas (%)
House heating fuel used in apartments - Bottled, tank, or LP gas (%)
House heating fuel used in apartments - Electricity (%)
House heating fuel used in apartments - Fuel oil, kerosene, etc. (%)
House heating fuel used in apartments - Coal or coke (%)
House heating fuel used in apartments - Wood (%)
House heating fuel used in apartments - Solar energy (%)
House heating fuel used in apartments - Other fuel (%)
House heating fuel used in apartments - No fuel used (%)
Median year house/condo built: 1979Median year apartment built: 1985Household type by relationship:
Households: 46,495
Male householders: 9,127 (3,248 living alone ), Female householders: 12,116 (4,944 living alone )6,332 spouses (6,241 opposite-sex spouses ), 2,440 unmarried partners , (2,334 opposite-sex unmarried partners ), 10,809 children (9,661 natural , 587 adopted , 560 stepchildren ), 876 grandchildren , 848 brothers or sisters , 950 parents , 9 foster children , 921 other relatives , 1,688 non-relatives In group quarters: 374
Size of family households: 4,978 2-persons , 2,635 3-persons , 1,849 4-persons , 861 5-persons , 55 6-persons , 167 7-or-more-persons .
Size of nonfamily households: 8,091 1-person , 2,541 2-persons , 265 3-persons , 161 4-persons , 11 6-persons .
4,022 married couples with children. single-parent households (466 men , 2,805 women ).
70.5% of residents of Altamonte Springs speak English at home. of residents speak Spanish at home (65% speak English very well , 13% speak English well , 20% speak English not well , 2% don't speak English at all ).of residents speak other Indo-European language at home (61% speak English very well , 19% speak English well , 20% speak English not well ).of residents speak Asian or Pacific Island language at home (53% speak English very well , 30% speak English well , 17% speak English not well ).of residents speak other language at home (90% speak English very well , 10% speak English well ).
Foreign born population: 9,127 (19.6%)of them are naturalized citizens )
Median number of rooms in houses and condos:
Median number of rooms in apartments
Owner-occupied Renter-occupied
Rooms in owner-occupied houses in Altamonte Springs, Florida
0 1 room 188 2 rooms 718 3 rooms 1,267 4 rooms 1,878 5 rooms 1,864 6 rooms 1,223 7 rooms 816 8 rooms 729 9+ rooms
Rooms in renter-occupied apartments in Altamonte Springs, Florida
925 1 room 1,859 2 rooms 3,216 3 rooms 3,046 4 rooms 1,915 5 rooms 1,293 6 rooms 306 7 rooms 267 8 rooms 87 9+ rooms
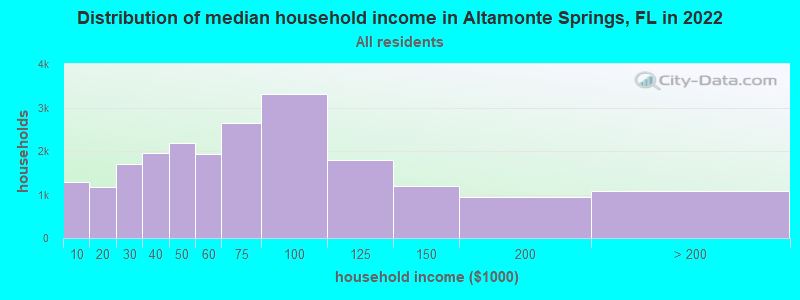
Altamonte Springs, FL household income distribution 1,287 Less than $10,0001,175 $10,000 to $19,9991,707 $20,000 to $29,9991,949 $30,000 to $39,9992,181 $40,000 to $49,9991,933 $50,000 to $59,9992,633 $60,000 to $74,9993,315 $75,000 to $99,9991,782 $100,000 to $124,9991,195 $125,000 to $149,999936 $150,000 to $199,9991,080 $200,000 or more
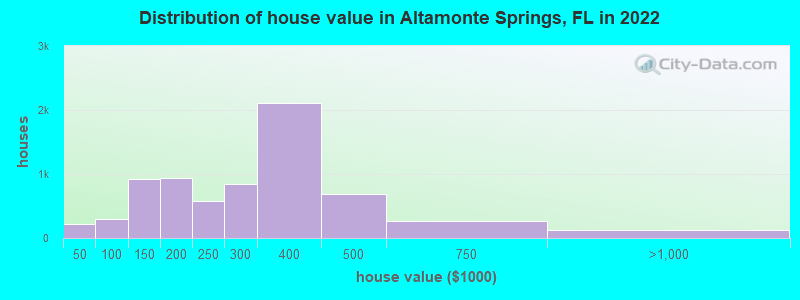
Home value of owner - occupied houses in 2022 in Altamonte Springs, FL 74 Less than $10,00011 $10,000 to $14,99923 $15,000 to $19,99943 $25,000 to $29,99948 $30,000 to $34,99919 $35,000 to $39,9994 $40,000 to $49,99943 $50,000 to $59,99916 $60,000 to $69,999120 $70,000 to $79,99934 $80,000 to $89,99974 $90,000 to $99,999454 $100,000 to $124,999465 $125,000 to $149,999374 $150,000 to $174,999563 $175,000 to $199,999576 $200,000 to $249,999842 $250,000 to $299,9992,107 $300,000 to $399,999684 $400,000 to $499,999262 $500,000 to $749,99988 $750,000 to $999,9993 $1,500,000 to $1,999,99928 $2,000,000 or moreRent paid by renters in 2022 in Altamonte Springs, FL 42 $100 to $14945 $200 to $2499 $400 to $44943 $450 to $49936 $550 to $59956 $600 to $64934 $650 to $69986 $700 to $74952 $750 to $799174 $800 to $899580 $900 to $9993,012 $1,000 to $1,2494,218 $1,250 to $1,4993,367 $1,500 to $1,999506 $2,000 to $2,49979 $2,500 to $2,9999 $3,500 or more612 No cash rent
Percentage of workers working in this county: 56.1%Number of people working at home: 4,855 (18.3% of all workers )
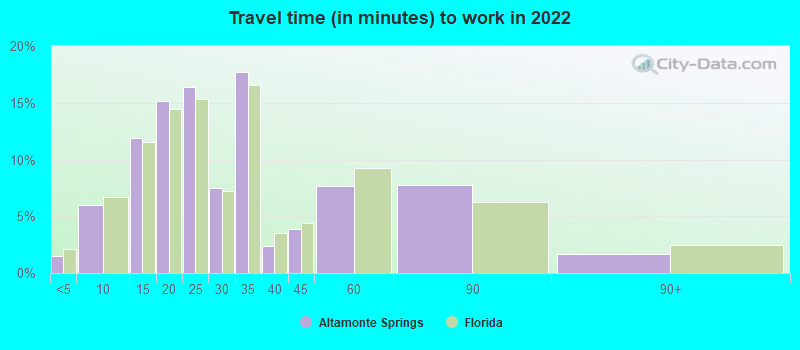
Travel time to work (commute)
Less than 5 minutes: 2095 to 9 minutes: 1,27210 to 14 minutes: 2,58115 to 19 minutes: 3,34320 to 24 minutes: 4,01325 to 29 minutes: 2,15030 to 34 minutes: 3,64135 to 39 minutes: 1,04440 to 44 minutes: 57945 to 59 minutes: 1,69360 to 89 minutes: 53590 or more minutes: 333
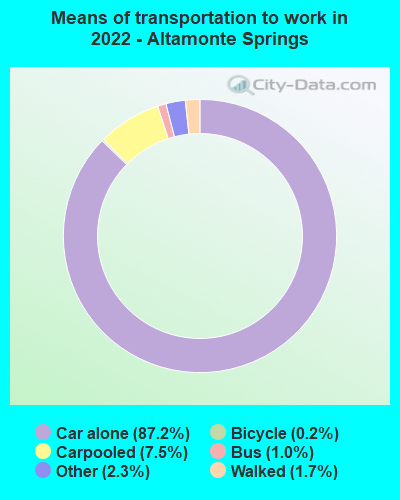
Means of transportation to work:
Drove a car alone: 23,500 (70.1%)Carpooled: 2,563 (7.6%)Bus : 265 (0.8%)Subway or elevated rail : 9 (0.0%)Taxi: 699 (2.1%)Bicycle: 47 (0.1%)Walked: 439 (1.3%)Worked at home: 4,855 (14.5%)
Unemployment by race in 2022
Unemployment rate for White non-Hispanic residents 6.7% Males1.8% FemalesUnemployment rate for Black residents 4.6% Males5.2% FemalesUnemployment rate for other race residents 4.4% Males4.7% FemalesUnemployment rate for two or more race residents 3.3% Males1.6% FemalesUnemployment rate for Hispanic or Latino residents 3.1% Males1.2% Females
Year of entry for the foreign-born population in Altamonte Springs, Florida
4,214 2010 or later 1,485 2000 to 2009 2,064 1990 to 1999 1,228 1980 to 1989 786 1970 to 1979 1,143 Before 1970
First ancestries reported:
American: 3,080 (12.1%)
German: 1,006 (4.0%)
English: 990 (3.9%)
Haitian: 967 (3.8%)
Italian: 889 (3.5%)
Irish: 835 (3.3%)
Jamaican: 596 (2.3%)
Brazilian: 384 (1.5%)
French: 310 (1.2%)
European: 276 (1.1%)
Scottish: 238 (0.9%)
Polish: 233 (0.9%)
British: 204 (0.8%)
Egyptian: 188 (0.7%)
Ukrainian: 174 (0.7%)
Russian: 163 (0.6%)
West Indian: 161 (0.6%)
Guyanese: 138 (0.5%)
African: 133 (0.5%)
French Canadian: 118 (0.5%)
Welsh: 114 (0.4%)
Eastern European: 113 (0.4%)
Zimbabwean: 111 (0.4%)
Bermudan: 85 (0.3%)
Romanian: 83 (0.3%)
Nigerian: 73 (0.3%)
Swedish: 67 (0.3%)
Iranian: 58 (0.2%)
Afghan: 55 (0.2%)
Scotch-Irish: 50 (0.2%)
Yugoslavian: 45 (0.2%)
Greek: 43 (0.2%)
Scandinavian: 39 (0.2%)
Czech: 37 (0.1%)
Dutch: 34 (0.1%)
Portuguese: 30 (0.1%)
Estonian: 30 (0.1%)
Serbian: 30 (0.1%)
Arab: 30 (0.1%)
Finnish: 27 (0.1%)
Danish: 24 (0.09%)
Trinidadian and Tobagonian: 23 (0.09%)
Bulgarian: 21 (0.08%)
Lebanese: 20 (0.08%)
British West Indian: 20 (0.08%)
Cape Verdean: 17 (0.07%)
Iraqi: 14 (0.06%)
Northern European: 14 (0.06%)
Slovak: 11 (0.04%)
Palestinian: 10 (0.04%)
Latvian: 9 (0.04%)
Turkish: 9 (0.04%)
Bahamian: 9 (0.04%)
Lithuanian: 7 (0.03%)
Croatian: 6 (0.02%)
Swiss: 5 (0.02%)
Canadian: 4 (0.02%)
Most common places of birth for foreign-born residents (%): Colombia Altamonte Springs:
13.7% (1,211)Florida:
6.5% (298,669)
Venezuela Altamonte Springs:
12.4% (1,092)Florida:
5.7% (262,042)
Haiti Altamonte Springs:
10.3% (911)Florida:
7.5% (342,375)
Ecuador Altamonte Springs:
5.6% (494)Florida:
1.2% (54,585)
Brazil Altamonte Springs:
5.1% (454)Florida:
2.7% (122,906)
Cuba Altamonte Springs:
5.1% (451)Florida:
22.0% (1,006,576)
Jamaica Altamonte Springs:
4.2% (367)Florida:
5.0% (227,319)
Mexico Altamonte Springs:
3.6% (314)Florida:
5.6% (257,152)
Nicaragua Altamonte Springs:
3.2% (281)Florida:
2.3% (105,066)
Egypt Altamonte Springs:
2.7% (238)Florida:
0.3% (13,998)
Peru Altamonte Springs:
2.5% (224)Florida:
2.1% (96,693)
Ukraine Altamonte Springs:
2.4% (214)Florida:
0.5% (21,886)
England Altamonte Springs:
2.1% (188)Florida:
0.8% (37,723)
Guyana Altamonte Springs:
2.1% (185)Florida:
0.7% (33,556)
Dominican Republic Altamonte Springs:
2.0% (178)Florida:
3.0% (137,727)
Philippines Altamonte Springs:
1.8% (158)Florida:
1.8% (84,403)
Place of birth for U.S.-born residents:
This state: 14,856Other state: 20,316Northeast: 9,073Midwest: 3,568South: 5,691West: 2,074 77.4% of Altamonte Springs residents lived in the same house 1 years ago.
Out of people who lived in different houses, 28.9% lived in this county.
Out of people who lived in different counties, 70.0% lived in Florida.
Altamonte Springs:
77.4%State average:
86.3%
Education attainment for males 25 years and older:
No schooling: 201Nursery to 4th grade: 835th and 6th grade: 1217th and 8th grade: 1229th grade: 19910th grade: 7211th grade: 30812th grade, no diploma: 247High school graduate (or equivalency): 3,300Less than 1 year of college: 943Some college more than 1 year, no degree: 2,193Associate degree: 1,820Bachelor's degree: 4,021Master's degree: 1,081Professional school degree: 307Doctorate degree: 153
Education attainment for females 25 years and older:
No schooling: 190Nursery to 4th grade: 475th and 6th grade: 637th and 8th grade: 3919th grade: 6010th grade: 6011th grade: 44812th grade, no diploma: 197High school graduate (or equivalency): 3,525Less than 1 year of college: 1,794Some college more than 1 year, no degree: 2,305Associate degree: 2,957Bachelor's degree: 4,902Master's degree: 1,616Professional school degree: 191Doctorate degree: 133
Housing units in structures:
One, detached: 5,408One, attached: 2,340Two: 4503 or 4: 2,9795 to 9: 3,58110 to 19: 4,52020 to 49: 2,09550 or more: 1,868Mobile homes: 12Housing units lacking complete plumbing facilities in 2022: 1.2%Housing units lacking complete kitchen facilities in 2022: 2.0%House/condo owner moved in on average 10 years ago
Renter moved in on average 3 years ago
Private vs. public school enrollment:
Students in private schools in grades 1 to 8 (elementary and middle school): 535 Students in private schools in grades 9 to 12 (high school): 143 Students in private undergraduate colleges: 169