Alamo, TX (Texas) Houses and Residents
| Alamo: | $108,992 |
| Texas: | $275,400 |
Mean price in 2022:
Detached houses: $158,285
Here: $158,285 State: $369,058 Townhouses or other attached units: $215,293
Here: $215,293 State: $327,631 Mobile homes: $74,497
Here: $74,497 State: $124,413 Occupied boats, RVs, vans, etc.: $20,999
Here: $20,999 State: $73,921
Total population: 19,224 (Urban population: 15,078, Rural population: 0)
Houses: 7,803 (6,237 occupied: 4,486 owner occupied, 1,817 renter occupied)
| % of renters here: | 29% |
| State: | 38% |
Housing density: 1,364 houses/condos per square mile
Median price asked for vacant for-sale houses and condos in 2022: $72,171.
Median contract rent in 2022: $482 (lower quartile is $359, upper quartile is $640)
Median rent asked for vacant for-rent units in 2022: $608
Median gross rent in Alamo, TX in 2022: $663
Housing units in Alamo with a mortgage: 1,553 (0 second mortgage, 0 home equity loan, 0 both second mortgage and home equity loan)
Houses without a mortgage: 60
Median household income for houses/condos with a mortgage: $86,152
Median household income for apartments without a mortgage: $42,427
Median monthly housing costs: $636
Compare current foreclosures near Alamo, TX:
| Photo | Address | Area | Beds / Baths | Price | Details |
|---|---|---|---|---|---|

|
#1
Oneida Cir
Alamo, TX 78516
|
1,902 sq. feet
|
- baths 3 beds |
show details | |

|
#2
Vanilla
Alamo, TX 78516
|
1,011 sq. feet
|
- baths 3 beds |
show details | |

|
#3
State Highway 495, Lot 354
Alamo, TX 78516
|
- sq. feet
|
- baths - beds |
show details | |

|
#4
Minnesota Rd
Alamo, TX 78516
|
- sq. feet
|
- baths - beds |
show details | |

|
#5
Mohawk Trl
Alamo, TX 78516
|
- sq. feet
|
- baths - beds |
show details | |

|
#6
Mossy Oak Dr
Alamo, TX 78516
|
- sq. feet
|
- baths - beds |
show details | |

|
#7
Tulipan Ave
Alamo, TX 78516
|
- sq. feet
|
- baths - beds |
show details | |

|
#8
Lupine St
Alamo, TX 78516
|
- sq. feet
|
- baths - beds |
show details | |

|
#9
Campanilla Ave
Alamo, TX 78516
|
- sq. feet
|
- baths - beds |
show details | |

|
#10
Camelia St
Alamo, TX 78516
|
- sq. feet
|
- baths - beds |
show details |
| Photo | Address | Area | Beds / Baths | Price | Details |
|---|---|---|---|---|---|

|
#11
Lion Lake Dr N
Weslaco, TX 78596
|
3,556 sq. feet
|
4 baths 5 beds |
$289,900
|
show details |

|
#12
Middle St
Alamo, TX 78516
|
- sq. feet
|
- baths - beds |
show details | |

|
#13
Carina St
Alamo, TX 78516
|
- sq. feet
|
- baths - beds |
show details | |

|
#14
E Ramseyer Rd
Edinburg, TX 78542
|
3,715 sq. feet
|
2 baths 4 beds |
show details | |

|
#15
Mile 7 1/2 Road
Mission, TX 78573
|
1,789 sq. feet
|
2 baths 3 beds |
show details | |

|
#16
W Eagle Ave
Pharr, TX 78577
|
1,302 sq. feet
|
2 baths 3 beds |
show details | |

|
#17
Amber Dr
Weslaco, TX 78596
|
1,085 sq. feet
|
2 baths 3 beds |
show details | |

|
#18
Esther Ave
Edinburg, TX 78539
|
3,080 sq. feet
|
3 baths 4 beds |
show details | |

|
#19
Moon Lake Dr N
Weslaco, TX 78596
|
1,645 sq. feet
|
2 baths 3 beds |
show details | |

|
#20
N 5th St
Mcallen, TX 78504
|
2,961 sq. feet
|
2 baths 3 beds |
show details |
| Photo | Address | Area | Beds / Baths | Price | Details |
|---|---|---|---|---|---|

|
#21
N Taylor Rd
Mcallen, TX 78504
|
1,909 sq. feet
|
2 baths 3 beds |
show details | |

|
#22
Jubilee Ave
Pharr, TX 78577
|
930 sq. feet
|
1 baths 2 beds |
show details | |

|
#23
Violet Ave
Mcallen, TX 78504
|
1,752 sq. feet
|
2 baths 3 beds |
show details | |

|
#24
Toledo Ave
Edinburg, TX 78541
|
- sq. feet
|
3 baths 3 beds |
show details | |

|
#25
N 25th Ln
Mcallen, TX 78504
|
- sq. feet
|
2 baths 3 beds |
show details | |

|
#26
N 27th Ln
Mcallen, TX 78504
|
1,390 sq. feet
|
2 baths 3 beds |
show details | |

|
#27
Bella Vista Ave
Weslaco, TX 78596
|
4,184 sq. feet
|
2 baths 3 beds |
show details | |

|
#28
Orange St
Mercedes, TX 78570
|
1,066 sq. feet
|
2 baths 3 beds |
show details | |

|
#29
Davina St
Mission, TX 78572
|
1,366 sq. feet
|
2 baths 3 beds |
show details | |

|
#30
San Esteban St
Mission, TX 78572
|
1,928 sq. feet
|
2 baths 3 beds |
show details |
| Photo | Address | Area | Beds / Baths | Price | Details |
|---|---|---|---|---|---|

|
#31
N Sky Soldier Rd
Weslaco, TX 78596
|
- sq. feet
|
3 baths 3 beds |
show details | |

|
#32
Drennan St
Edinburg, TX 78541
|
1,778 sq. feet
|
2 baths 3 beds |
show details | |

|
#33
State St
San Juan, TX 78589
|
1,045 sq. feet
|
2 baths 3 beds |
show details | |

|
#34
Mile 7 1/2 Rd
Mission, TX 78573
|
2,013 sq. feet
|
2 baths 3 beds |
show details | |

|
#35
N 16th Ln
Mcallen, TX 78504
|
2,713 sq. feet
|
3 baths 4 beds |
show details | |

|
#36
E Hibiscus Ave
Mcallen, TX 78501
|
2,004 sq. feet
|
2 baths 3 beds |
show details | |

|
#37
W Washington St
Weslaco, TX 78599
|
2,252 sq. feet
|
2 baths 4 beds |
show details | |

|
#38
Retama St
Hidalgo, TX 78557
|
- sq. feet
|
2 baths 3 beds |
show details | |

|
#39
Guayavitos Ln
San Juan, TX 78589
|
- sq. feet
|
2 baths 3 beds |
show details | |

|
#40
N Maple St
Mission, TX 78573
|
1,281 sq. feet
|
3 baths 4 beds |
show details |
| Photo | Address | Area | Beds / Baths | Price | Details |
|---|---|---|---|---|---|

|
#41
Maria Luiza Dr
Edinburg, TX 78539
|
2,642 sq. feet
|
3 baths 4 beds |
show details | |

|
#42
Ramirez St
Mission, TX 78573
|
- sq. feet
|
2 baths 3 beds |
show details | |

|
#43
Oriole Dr
Mission, TX 78572
|
2,202 sq. feet
|
4 baths 5 beds |
show details | |

|
#44
Stella Dr
San Juan, TX 78589
|
1,509 sq. feet
|
2 baths 3 beds |
show details | |

|
#45
Luis Dr
Mercedes, TX 78570
|
1,315 sq. feet
|
2 baths 3 beds |
show details | |

|
#46
Irene St
Weslaco, TX 78596
|
- sq. feet
|
2 baths 3 beds |
show details | |

|
#47
Irene St
Weslaco, TX 78599
|
1,696 sq. feet
|
2 baths 3 beds |
show details | |

|
#48
N Pine St
Mission, TX 78573
|
1,568 sq. feet
|
1 baths 3 beds |
show details | |

|
#49
E 28th St
Mission, TX 78574
|
2,073 sq. feet
|
2 baths 4 beds |
show details | |

|
Check over 1 million property listings on Foreclosure.com!
|
browse all offers | |||

Latest news about housing in Alamo, TX collected exclusively by city-data.com from local newspapers, TV, and radio stations

 | Would be starting work in Windcrest and Wazlem area. Looking for safe rental apartments. (10 replies) |
| Nice rental homes near Ft Sam Houston? (18 replies) |
| Moving back to Austin/Renting a house (6 replies) |
| Section 8 Apartments off FM 1560?? (99 replies) |
| Helotes vs Alamo Ranch Area buying a home (9 replies) |
| Alamo Heights Apartment Development Abandoned (76 replies) |

Median year apartment built: 1992
Household type by relationship:
Households: 20,155- Male householders: 2,738 (729 living alone), Female householders: 3,358 (511 living alone)
3,040 spouses (3,020 opposite-sex spouses), 346 unmarried partners, (346 opposite-sex unmarried partners), 7,297 children (7,009 natural, 27 adopted, 260 stepchildren), 1,385 grandchildren, 492 brothers or sisters, 303 parents, 0 foster children, 1,083 other relatives, 72 non-relatives
- In group quarters: 36
Size of family households: 1,718 2-persons, 982 3-persons, 556 4-persons, 681 5-persons, 387 6-persons, 411 7-or-more-persons.
Size of nonfamily households: 1,294 1-person, 280 2-persons.
2,816 married couples with children.
1,775 single-parent households (201 men, 1,574 women).
26.8% of residents of Alamo speak English at home.
72.6% of residents speak Spanish at home (68% speak English very well, 14% speak English well, 9% speak English not well, 10% don't speak English at all).
0.3% of residents speak other Indo-European language at home (100% speak English very well).
Foreign born population: 4,423 (21.9%)
(28.0% of them are naturalized citizens)
| Here: | 5.1 |
| State: | 6.3 |
| Here: | 4.1 |
| State: | 4.0 |

- Bedrooms in owner-occupied houses and condos in Alamo, Texas
- 78no bedroom
- 6621 bedroom
- 8592 bedrooms
- 1,9733 bedrooms
- 8154 bedrooms
- 1005+ bedrooms

- Bedrooms in renter-occupied apartments in Alamo, Texas
- 38no bedroom
- 4421 bedroom
- 8742 bedrooms
- 2983 bedrooms
- 1664 bedrooms
- 05+ bedrooms

- Cars and other vehicles available in Alamo in owner-occupied houses/condos
- 54no vehicle
- 1,8031 vehicle
- 1,3972 vehicles
- 7043 vehicles
- 3674 vehicles
- 1625+ vehicles

- Cars and other vehicles available in Alamo in renter-occupied apartments
- 191no vehicle
- 1,0251 vehicle
- 4252 vehicles
- 1773 vehicles
- 04 vehicles
- 05+ vehicles

- Rooms in owner-occupied houses in Alamo, Texas
- 561 room
- 452 rooms
- 6243 rooms
- 7614 rooms
- 1,4285 rooms
- 8896 rooms
- 3727 rooms
- 1448 rooms
- 1689+ rooms

- Rooms in renter-occupied apartments in Alamo, Texas
- 381 room
- 1882 rooms
- 3153 rooms
- 7234 rooms
- 3015 rooms
- 2276 rooms
- 07 rooms
- 88 rooms
- 189+ rooms


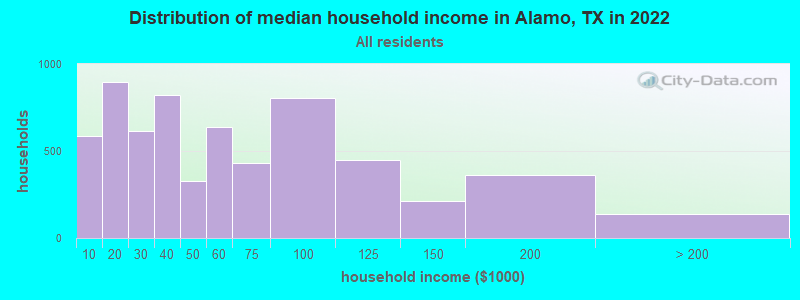
Alamo, TX household income distribution

- 587Less than $10,000
- 895$10,000 to $19,999
- 615$20,000 to $29,999
- 820$30,000 to $39,999
- 326$40,000 to $49,999
- 636$50,000 to $59,999
- 433$60,000 to $74,999
- 802$75,000 to $99,999
- 451$100,000 to $124,999
- 211$125,000 to $149,999
- 364$150,000 to $199,999
- 140$200,000 or more
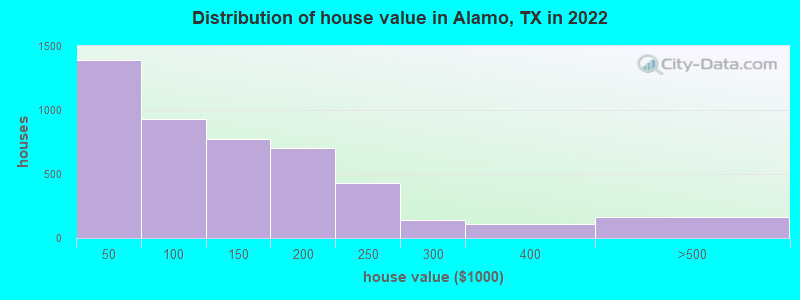
Home value of owner - occupied houses in 2022 in Alamo, TX
-
- 421Less than $10,000
- 20$10,000 to $14,999
- 60$15,000 to $19,999
- 149$20,000 to $24,999
- 301$25,000 to $29,999
- 58$30,000 to $34,999
- 194$35,000 to $39,999
- 182$40,000 to $49,999
- 181$50,000 to $59,999
- 258$60,000 to $69,999
- 50$70,000 to $79,999
- 117$80,000 to $89,999
- 143$90,000 to $99,999
- 383$100,000 to $124,999
- 392$125,000 to $149,999
- 412$150,000 to $174,999
- 293$175,000 to $199,999
- 427$200,000 to $249,999
- 144$250,000 to $299,999
- 109$300,000 to $399,999
- 164$400,000 to $499,999
Rent paid by renters in 2022 in Alamo, TX
-
- 72Less than $100
- 115$150 to $199
- 108$200 to $249
- 60$250 to $299
- 65$300 to $349
- 180$350 to $399
- 136$400 to $449
- 187$450 to $499
- 193$500 to $549
- 39$550 to $599
- 130$600 to $649
- 103$650 to $699
- 93$700 to $749
- 55$750 to $799
- 11$800 to $899
- 79$900 to $999
- 42$1,250 to $1,499
- 14$1,500 to $1,999
- 118No cash rent


Percentage of workers working in this county: 85.4%
Number of people working at home: 380 (5.5% of all workers)
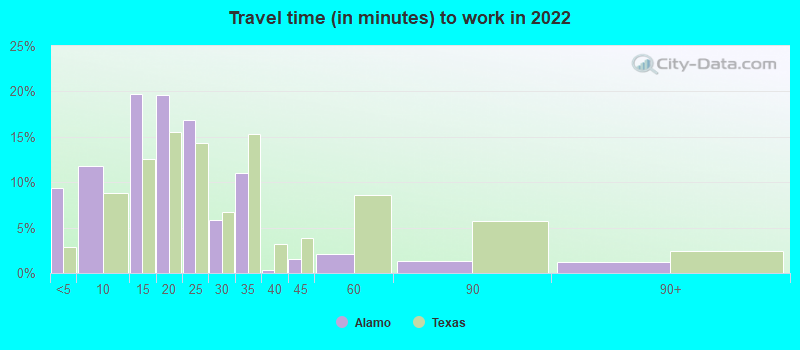
Travel time to work (commute)
- Less than 5 minutes: 302
- 5 to 9 minutes: 637
- 10 to 14 minutes: 879
- 15 to 19 minutes: 999
- 20 to 24 minutes: 1,559
- 25 to 29 minutes: 282
- 30 to 34 minutes: 1,076
- 35 to 39 minutes: 121
- 40 to 44 minutes: 102
- 45 to 59 minutes: 378
- 60 to 89 minutes: 22
- 90 or more minutes: 108
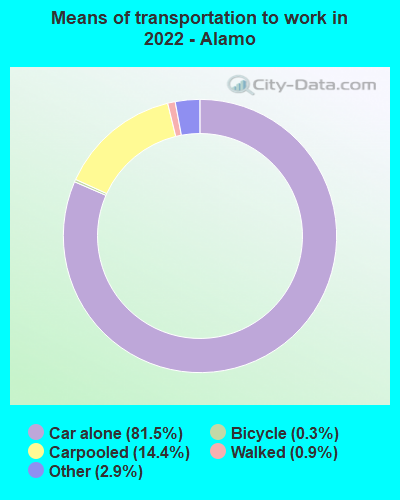
Means of transportation to work:
- Drove a car alone: 3,839 (73.7%)
- Carpooled: 693 (13.3%)
- Taxi: 182 (3.5%)
- Bicycle: 10 (0.2%)
- Walked: 58 (1.1%)
- Worked at home: 380 (7.3%)

- Unemployment by race in 2022
- Unemployment rate for White non-Hispanic residents
- 4.4%Males
- 2.1%Females
- Unemployment rate for American Indian and Alaska Native residents
- 50.9%Females
- Unemployment rate for other race residents
- 20.5%Females
- Unemployment rate for two or more race residents
- 3.1%Males
- 11.9%Females
- Unemployment rate for Hispanic or Latino residents
- 5.9%Males
- 10.8%Females

- Year of entry for the foreign-born population in Alamo, Texas
- 5442010 or later
- 1,3112000 to 2009
- 9161990 to 1999
- 1,1601980 to 1989
- 6681970 to 1979
- 589Before 1970
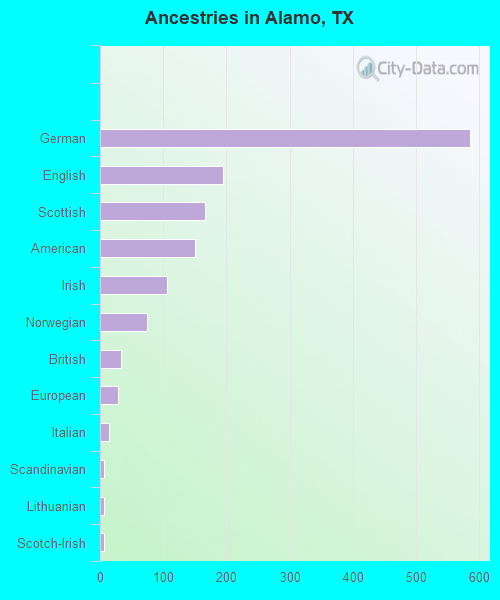
First ancestries reported:
- German: 586 (3.7%)
- English: 194 (1.2%)
- Scottish: 166 (1.0%)
- American: 151 (1.0%)
- Irish: 106 (0.7%)
- Norwegian: 75 (0.5%)
- British: 33 (0.2%)
- European: 28 (0.2%)
- Italian: 15 (0.09%)
- Scandinavian: 7 (0.04%)
- Lithuanian: 6 (0.04%)
- Scotch-Irish: 6 (0.04%)
Most common places of birth for foreign-born residents (%):
| Alamo: | 92.9% (4,160) |
| Texas: | 48.4% (2,411,723) |
Place of birth for U.S.-born residents:
- This state: 12,447
- Other state: 3,302
- Northeast: 96
- Midwest: 1,876
- South: 184
- West: 1,103
85.6% of Alamo residents lived in the same house 1 years ago.
Out of people who lived in different houses, 42.5% lived in this county.
Out of people who lived in different counties, 28.3% lived in Texas.
| Alamo: | 85.6% |
| State average: | 85.7% |
Education attainment for males 25 years and older:
- No schooling: 184
- Nursery to 4th grade: 195
- 5th and 6th grade: 374
- 7th and 8th grade: 123
- 9th grade: 387
- 10th grade: 226
- 11th grade: 366
- 12th grade, no diploma: 105
- High school graduate (or equivalency): 1,504
- Less than 1 year of college: 373
- Some college more than 1 year, no degree: 623
- Associate degree: 346
- Bachelor's degree: 526
- Master's degree: 92
- Professional school degree: 51
- Doctorate degree: 7

Education attainment for females 25 years and older:
- No schooling: 348
- Nursery to 4th grade: 151
- 5th and 6th grade: 293
- 7th and 8th grade: 224
- 9th grade: 211
- 10th grade: 212
- 11th grade: 207
- 12th grade, no diploma: 146
- High school graduate (or equivalency): 1,844
- Less than 1 year of college: 225
- Some college more than 1 year, no degree: 743
- Associate degree: 304
- Bachelor's degree: 768
- Master's degree: 225
- Professional school degree: 0
- Doctorate degree: 19


Housing units in structures:
- One, detached: 4,046
- One, attached: 137
- Two: 133
- 3 or 4: 253
- 5 to 9: 160
- 10 to 19: 132
- 20 to 49: 41
- 50 or more: 39
- Mobile homes: 2,813
- Boats, RVs, vans, etc.: 44
Median worth of mobile homes: $33,582
Housing units lacking complete kitchen facilities in 2022: 0.2%
House/condo owner moved in on average 10 years ago
Renter moved in on average 4 years ago

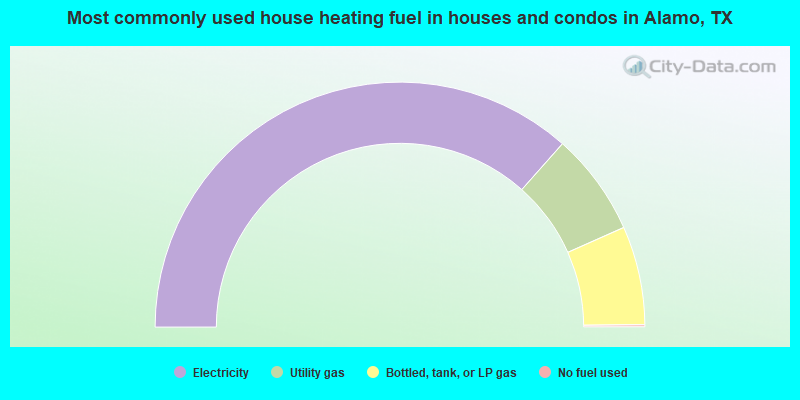
- 73.1%Electricity
- 13.6%Utility gas
- 13.0%Bottled, tank, or LP gas
- 0.3%No fuel used
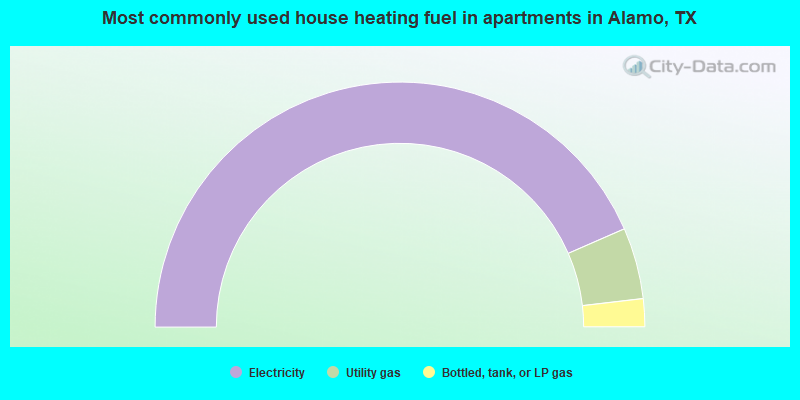
- 86.9%Electricity
- 9.4%Utility gas
- 3.7%Bottled, tank, or LP gas
Private vs. public school enrollment:
| Here: | 1.3% |
| Texas: | 8.8% |
| Here: | 2.2% |
| Texas: | 8.0% |
| Here: | 4.9% |
| Texas: | 16.2% |


